Overview
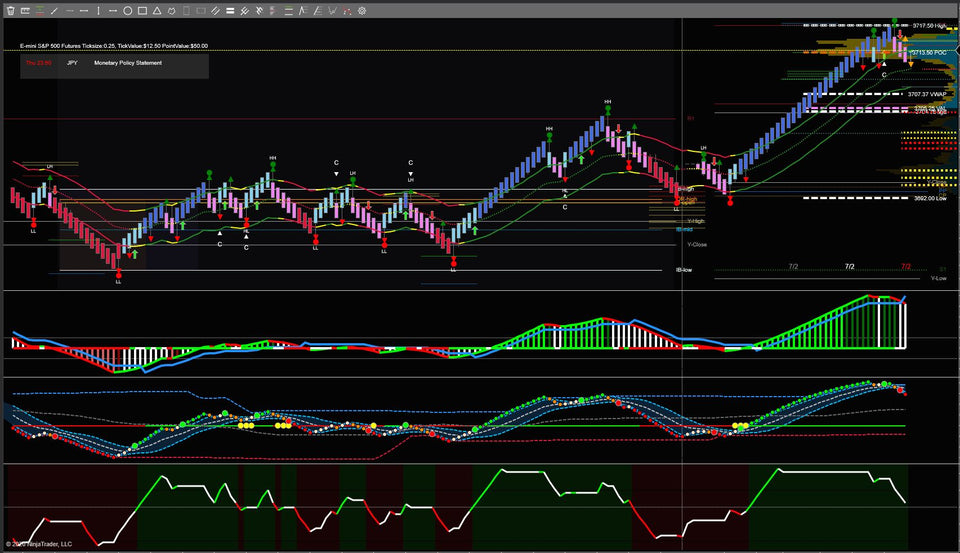
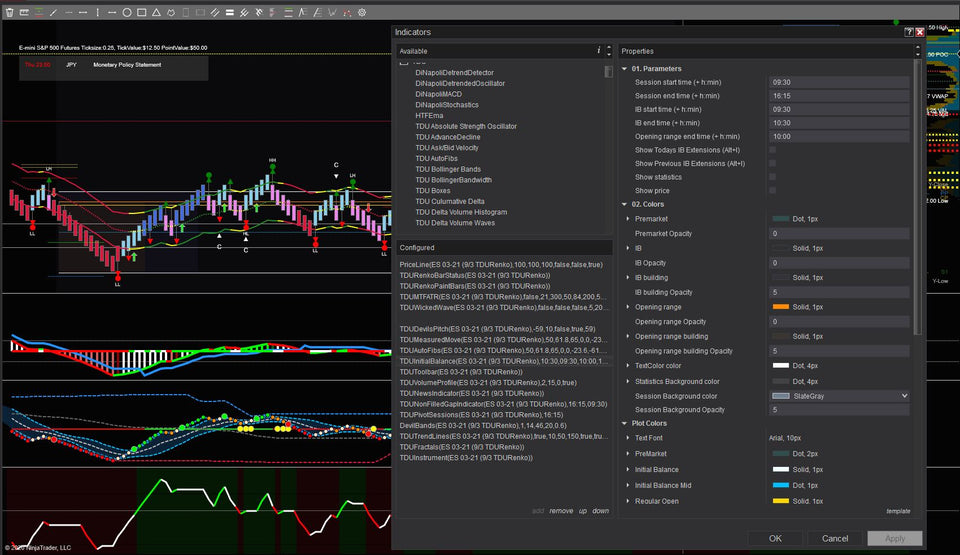
The Renko chart package contains everything we use to trade Renko charts including a custom chart template. It contains a total of 16 indicators, toolbar, order module, and much more worth over $3120 when bought separately.
- Includes 16 indicators professional indicators to trade Renko based charts
- Includes read-to-start chart template
- Extensive video's about all indicators included
- Total value $3120, but you get it for just $2150
16 Indicators included:
Renko and UniRenko Suite
The TDU Renko is a complete Renko trading suite including all the indicators needed to trade Renko. Besides the Renko bar chart, it includes the unique Renko brick size calculator, the Renko status lines, the Renko paint bars, and the TDU order.
- Mean renko
- Uni Renko
- Renko Paintbars
- Renko status line
- Renko Order module
News Indicator
Whether you are a fundamental or technical trader news events are always important. During news events, we often see huge volatility in price. With the TDU News Indicator, you won't make the mistake of accidentally opening or being in a trade when an important news event is incoming. All news is shown in a clearly condensed table and also as vertical lines on your chart. You can choose to hide low and/or medium impact news and even filter out news events that are not important to your trading.

TDU Wicked wave
The TDU Wicked Wave is our flagship custom build oscillator. By taking and combining all the best parts from well-known oscillators such as the RSI, QQE, MACD, and Stochastics, the TDU Wicked Wave can be used by traders to spot suitable entries for both continuation and reversal trades.
TDU Devils Pitch
The TDU Devil's Pitch is a one-of-a-kind tool that allows you to show the slope/angle of any indicator. Most indicators simply show you a line (e.g. a moving average) on or below the chart, however, a simple line is not very helpful in many cases since by the time our human eyes see the line angle changing the trend has already started (or ended). Instead of a simple line, the Devil's Pitch shows the angle of the line so you can quickly see if the indicator line is starting to rise or flattening out.
TDU Measured move
The 'measured move' is a common pattern repeatedly found across every market and time frame. It is used by many great traders like Sam Eels, Tim Racette, and David Halsey
Using key price swings, measured moves can be recognized in the market when price makes a 50% - 61.8% retracement followed by a move to the -23.6% target in the same direction as the previous price movement. Spotting evidence of these price movements is easy when you look, but for traders focusing on every aspect of their strategy, keeping in tune with which measured moves are in play across multiple timeframes is a time-consuming process. The TDU Measured Move indicator removes the need for you to do this extra work by showing you which measured moves in the past remained unbroken and reached their -23.6% target, allowing you to find confluence across multiple timeframes and anticipate which measured move is more likely to come next.
Auto Fibonacci indicator
Most Fibonacci traders are aware of the important 50%, 61.8%, 65%, and -23.6% are very important Fibonacci levels. Traders like Sam from TradeDevils, Tim from eminimind and David Halsey from eminiaddict based their entire trading strategies on those Fibonacci levels. These levels often act as key support/resistance levels used to anticipate potential price movements, market turning points, and points of profit-taking.
The TDU Auto Fib indicator makes Fibonacci trading much simpler by automatically identifying and drawing all the relevant Fibonacci retracements for you. Not only that but tick by tick, the indicator will keep your fibs updated in real-time helping you focus only on the most important levels while you trade.
TDU Divergence
Many traders use divergence as a way of recognizing when the market is losing strength in a particular direction. When comparing the price action against other indicators, traders can recognize moments of divergence when for example price continues to rise while at the same time the strength or momentum of the move decreases. Using the TDU Divergence Indicator you can automatically spot possible reversal zones. The indicator will draw lines when divergence occurs on both the chart and chosen indicator so you are always aware when divergence is occurring without needing to put in any extra work.
Initial Balance Indicator
The opening range and initial balance are defined as the price range the market creates in the first 30 min and the first hour after the session open. These ranges are very important in the market and are used by traders to spot potential turning points and support and resistance levels. The TDU Initial Balance indicator draws all the important pre-market levels, opening range, and initial balance in realtime. When the market rallies once the initial balance is established any extensions are automatically drawn as these extensions often act as support & resistance levels.
Advanced Toolbar
![]()
The TDU Toolbar is an advanced toolbar that not only contains all the default drawing tools but also adds some new custom drawing tools every trader needs.
Click here to read more about all the tools and options it offers
Volume Profile indicator
Suitable for breakout, reversal, or trend following strategies, many traders are using volume profiles in their trading arsenal to get visibility of the price levels where the most and least volume has traded over a given time. When price returns to an area where previously a large volume has been traded we can naturally expect support/resistance. Likewise, when price returns to a region where previously a very small amount of volume was traded we can expect the price to move through that area with relative ease.
TDU Unfilled gap
On most days we see the market gapping up or down. A gap occurs when the market opens above or below the previous day's close. When this happens the market always has a tendency to close this gap. Most but not all of these gaps are filled within 1 trading session. Some though might take days, weeks or months before they get filled.
A trader which knows where the next unfilled gaps are has a clear advantage in the market. Since probability tells us that the market will always try to close the gap whenever possible we can set up a clear trading plan if the market is within range of the next gap.
The Unfilled Gap Indicator shows all unfilled (and optionally filled) gaps. It allows you to never miss a gap that was created days or weeks ago. Unfilled gaps are presented as red lines on your chart from the point they were created to the present time. Filled gaps (if this option is enabled) are presented as brown lines on your chart, from the point they were created to the point they were filled.
Daily Pivots Indicator
Pivot points are something that has been used by traders since the '80s. Calculated based on the high, low, and closing prices of previous trading sessions, the TDU Pivots indicator tracks and draws key pivot points that can be used to predict key support and resistance levels in the current or upcoming session. Since they are widely known and regularly used, we see the markets respecting these pivots on a daily basis, making them an important consideration for traders determining suitable entry and exit points, stop-loss positioning, and profit-taking zones.
TDU Devils Edge
The Devil's Edge is a super-charged version of the popular MACD. By nature the MACD is a trend following indicator, the difference with the TDU Devil's Edge is that this indicator works to minimize the false signals that are so common with the standard MACD.
TDU Devils Bands
The TDU Devils bands are dynamic bands that widen and shrink depending on the volatility of the market. The centerline uses a McGinley Line instead of a plain moving average. The advantage of the McGinley line is that it adjusts itself in relation to the speed of the market. This is exactly where a normal moving average fails. For example, how can one know when to use a 10,20 or 50 moving average in a slow or fast market. The McGinley was built to automatically adjust to the current speed of the market and so proves to be a much more adaptable and useful tool to utilize.
TDU Waddah Attar explosion
The Waddah Attar Explosion Indicator is intended for use by all traders. It merges the Bollinger Bands and MACD together in a special way. This allows it to identify the start of the price explosion situations with very high accuracy. These explosions happen every day and sometimes multiple times a day. By using the Waddah Attar Explosion indicator you can know when this explosion begins and when they end with a high degree of success.
VWAP Indicator
The volume-weighted average price (VWAP) is one of the most famous indicators used by day traders. TDU VWAP not only shows you the swap but also allows you to select up to 4 standard deviation bands. The basic VWAP is drawn on the chart with up/down coloring. When VWAP is trending up it is colored green, when VWAP is trending down it Is colored red. And when VWAP is neutral then the color is white. Of course, you can change any of the colors to your liking
Many traders add 1 or more standard deviation bands to the VWAP indicator. When price moves beyond 1-2 standard deviations away from VWAP it is very likely that price will return to the mean (VWAP). This makes these standard deviation bands a good spot to be looking for trades. With TDU VWAP you can add up to 4 different standard deviation bands and customize them as you wish.


