1. Overview
On most days we see the market gapping up or down. A gap occurs when the market opens above or below the previous day's close. When this happens the market always has a tendency to close this gap. Most but not all of these gaps are filled within 1 trading session. Some though might take days, weeks, or months before they get filled. But in the end.. they always get filled. That is why many smart traders know about unfilled gaps and take advantage of the high probability that the market will fill an unfilled gap

A trader which knows where the next unfilled gaps are has a clear advantage in the market. Since probability tells us that the market will always try to close the gap whenever possible we can set up a clear trading plan if the market is within range of the next gap.
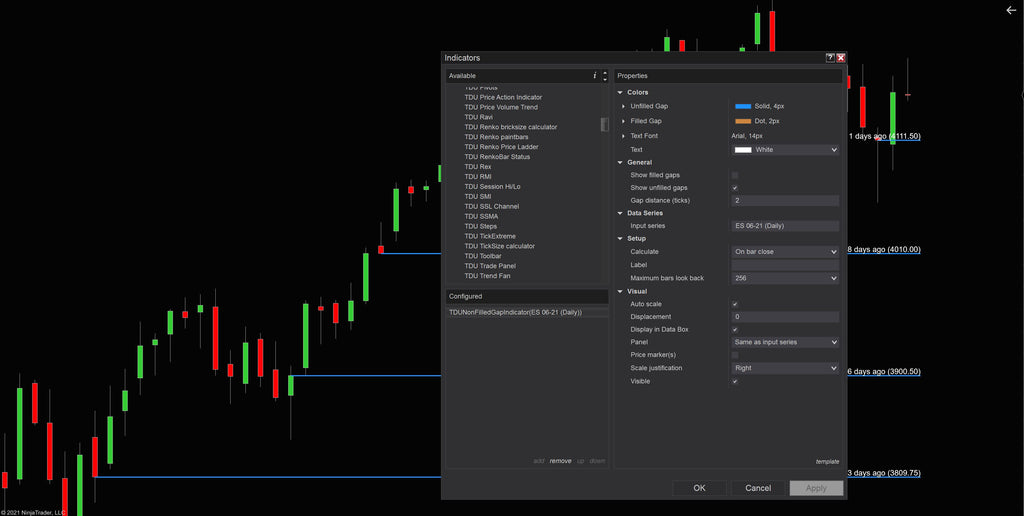
2. Plots all unfilled (and optionally filled) gaps
The Unfilled Gap Indicator shows all unfilled (and optionally filled) gaps. It allows you to never miss a gap that was created days or weeks ago. Unfilled gaps are presented as red lines on your chart from the point they were created to the present time. Filled gaps (if this option is enabled) are presented as brown lines on your chart, from the point they were created to the point they were filled.
As said before most gaps will fill within 1 trading session. That is why many smart traders only trade in the direction of the gap. But without an indicator like this, it is very easy to forget where the next gap is, and how far we are away from it.
This indicator will plot all unfilled (and optionally all filled) gaps on your chart so you never miss one again

3. Gap-fill probability & stop loss placement
The only gap-fill indicator which tells you how likely it is that the gap will be filled today
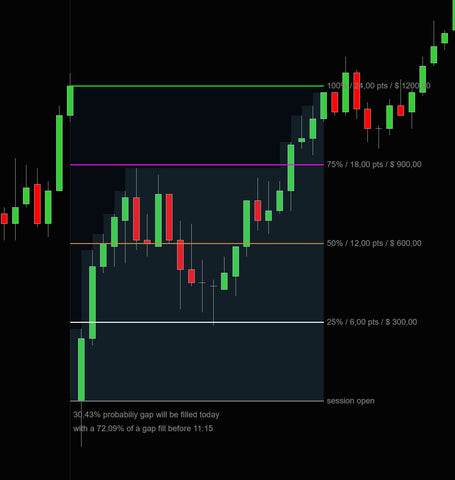
This little feature is what makes our indicator truly unique. Based on all historical gap fills our gap-fill indicator will calculate what's the chance that today's gap will be filled during the current session, and even what is the most likely time for the gap fill
And what is the best place to put your stop loss based on all historical gap fills
But that's not all. The indicator will also show you the best stop loss placement based on the statistical analysis of all historical gap fills
In the screenshot below you can see that this gap had a 30,43% of getting filled during the session with a 72% of this happening before 11:15
The red line below the gap-fill indicates the best place to put your stop loss

4. Statistics for all historical gaps
If you turn on the statistics, the indicator will show you all the statistics from all historical gap
4.1 Overal statistics
On the left top, you can see the total number of gaps and how many gaps are filled. In this case, we have 353 gaps, of which 326 are filled. On average 61.9% of all gaps are filled within the same trading day. Furthermore, we see that 61% are gap downs and 38% are gap ups
4.2 Statistics per gap range
Below we can see all the statistics for each gap range.
For example, we can see that a gap from 5-10 points has a 70.89% likelihood to be filled within 1 day. Of course, this is very valuable information. If you see a 10 point gap and you know it has a 70% chance of filling that day, you will have much more confidence in trading this gap fill

4.3 Statistics per gap-fill time
Next to the gap range statistics, we see statistics that display when most gap fills take place. For example in the screenshot below we can see that most gap fills occur before 10:30

5. Key Features
- Show both filled & unfilled gaps
- Advanced statistics
- Show the probability of today's gap fill
- Shows whats the most likely moment the gap will be filled today
- Shows 25%, 50%, 75% and 100% gap-fill targets in points and $
- Shows place where to put your stop loss based on all historical gap fills
- Works on any instrument
- Works on any timeframe
- Works with any bar type
- Works with any NinjaTrader license
6. Changelog
version 1.0.0.4 19-jun-2022
- Added option to hide stoploss, targets and profitability
- Added option to show/hide prices
version 1.0.0.3 07-Nov-2021
- Added statistics for all historical gap fills
- shows gap-fill targets for 25%, 50%, 75% and 100% in point and PnL
- shows the probability that today's gap will be filled and even at what time based on historical gap fills
8. Media