


Overview
The volume-weighted average price (VWAP) is one of the most famous indicators used by day traders. TDU VWAP not only shows you the VWAP but also allows you to select up to 4 standard deviation bands.
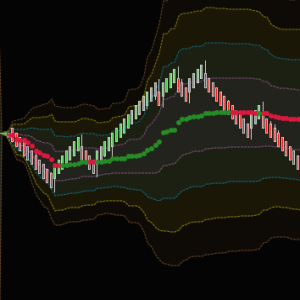
1) VWAP with up/downslope coloring
The basic VWAP is drawn on the chart with up/down coloring. When VWAP is trending up it is colored green, when VWAP is trending down it Is colored red. And when VWAP is neutral then the color is white. Of course, you can change any of the colors to your liking

2) Up to 4 different standard deviation bands
Many traders add 1 or more standard deviation bands to the VWAP indicator. When price moves beyond 1-2 standard deviations away from VWAP it is very likely that price will return to the mean (VWAP). This makes these standard deviation bands a good spot to be looking for trades. With TDU VWAP you can add up to 4 different standard deviation bands and customize them as you wish.

Key Features
- Plots Session VWAP
- Up/downslope coloring
- Plots Up to 4 different standard deviation bands
- Paint regions between VWAP and bands
- Colorize VWAP to show up- / downtrend
- Fully Customizable
- Works on any market (futures, forex, crypto, options, forex)
- Works on any (intraday) timeframe
- Works with any bar type (time, tick, volume, range, Renko,...)
What is the Volume Weighted Average Price (VWAP)?
The Volume Weighted Average Price or VWAP is used by day traders around the world. This essential indicator will be explained further in this article. It can be used in a variety of trading systems and is included in software such as the NinjaTrader 8.
Volume Weighted Average Price or VWAP is an indicator that tells you what price has traded at all day. It is an average and quickly gives you an idea of how that instrument is performing on the market on that day. Since it's a volume-weighted benchmark, it reflects the impact of changes in volume, so it will still be accurate as a comparison tool, whether you're looking at a day in which the security was traded in large numbers or one in which there was less market activity.
Why is the VWAP important?
The VWAP gives traders valuable insights. It allows them to see how the price of a security is trending. From that, they can make a decision on whether they think they should purchase a lot more of that security or sell, depending on what they think will happen in the future. They also gain information on the perceived value of the security to other traders in the market at that point in time.
Traders always want to ensure that they get what they consider to be the best price, whether they are buying or selling. The VWAP lets them do that, by providing them with current market information. VWAP presents the best value for an asset. So it's the price where most trading happened. The further price gets away from VWAP the more likely it becomes that it will reverse and to return to VWAP
When you study the VWAP line, you'll be able to determine what the average price was where the trading volume occurred. The standard deviation lines on your screen can be considered echoes of the VWAP line. You can adjust each of these lines to suit your own preferences in terms of color thickness and other factors.
Intraday Traders and VWAP
If you're an intraday trader, you will usually want to know what the VWAP is telling you about the instrument that you are monitoring. Often, at the end of the trading day, you may want to have a look at the VWAP for each of those securities. Perhaps, you might track the information in a spreadsheet.
With the VWAP you can instantly tell whether you received a price that day that was better than average. You can also tell whether your price was worse than average and think about how you can do better for yourself next time. No one really wants to get a worse than average price and since VWAP is calculated daily, it tells you immediately that you made a mistake in your calculations when you were deciding how much to buy or sell a particular security for, so you don't keep making the same error for weeks.
The VWAP starts you off fresh every day. Since most trading is often done in the morning, it is influenced by that action in the early part of the day. You can compare the trending price of the security to VWAP to decide whether you will buy or sell on that day at that particular point. if the price is below VWAP, it may be a good idea to buy. Likewise, if the price is above VWAP, it may be a good point in time to sell.
The unfortunate thing is that you can't just make a decision to sell or buy based on that indicator alone. As stated before, the VWAP depends on market conditions. Things can suddenly change and that will affect your own decision to sell or buy. What looked like a good opportunity to sell at 9 a.m. may not be so by the time it reaches 11 a.m.
At the end of a trading day, if the price you bought was below the VWAP, you did well. If the price you sold a security at was above the VWAP, you also did well. In both cases, you would have done better than average, as indicated by the VWAP.
You always want to sell at a price that is better than the average or buy at a price that is lower than the average. If the average price of ICE is $2 and you bought it for $1,75, you did well. You bought it for $0.25 less than the average price and its likely that if you sell it the next day, you will be able to make a profit of $0.25 per unit.
Similarly, if you sold ICE at $2.20 when the average price was $2, you made a profit of $0.20 per unit. If you want to profit in this way on a ranging day, you can buy as the price crosses above VWAP. When you observe that the price is crossing below VWAP, you could sell at that point. There is a risk to this since you could get caught in whipsaw action. Always use other indicators to get a more complete understanding of what is happening.
Adjusting VWAP
The VWAP can be adjusted to suit your needs. While NinjaTrader 8 automatically presents you with the standard VWAP, you don't have to stick with this. This can be adjusted for different time frames, to match your trading requirements. The standard VWAP that we have been looking at in this article is based on all of the orders that took place within a particular trading day but you can adjust the time interval to match the information that you require.
The VWAP lets you observe how other traders are behaving. You can detect where there is natural selling pressure and act in accordance with what's happening. If you are bullish, you can adjust the interval for a short time and wait for a clean VWAP cross above. When that happens, you can enter long and hope to make a profit within the interval of time that you have designated.
If you are or have decided to be more of a bear for the time that you have set, you can short the stock on a VWAP cross below. A VWAP cross below indicates to you that buyers may be stepping away from the market. There could also be a seller in the market. You can adjust the VWAP interval in NinjaTrader 8 to help you identify profitable opportunities in a specific period.
The VWAP shows you when there is natural buying pressure or natural selling pressure. There is generally a battle between those who want to sell and those who want to buy when security tries to cross above or below the VWAP line. Some traders also like to wait until a particular side has clearly lost the battle and then they jump in to make a profit. You can use the VWAP along with other indicators in the software, to help inform your trading decisions and if you are a beginner, you will start to understand the market more clearly.
Media


