
Predict Daily Price Targets And High-Probability Reversals With Institutional Accuracy By Instantly Mapping The Market’S Opening Range.
You Are Trading Against Institutional Algorithms Blindfolded.
Most retail traders get chopped to pieces in the morning session because they don't understand the hidden structure of the first 60 minutes of the trading day.
You spot a sudden aggressive push off the open. You buy the breakout, assuming a trend day has begun. Then price immediately stalls and violently reverses, stopping you out. The truth? You just bought directly into an institutional resistance zone defined by the Initial Balance—and you couldn't even see it.
The Initial Balance & Opening Range Indicator pulls back the curtain on these invisible liquidity pools. The price zones created in the first 30 and 60 minutes dictate where big money is likely to defend their positions or push for algorithmic extensions. Without this mapped on your chart, you are purely guessing.
We remove the guesswork. By projecting premarket levels, opening ranges, and calculated extensions directly onto your chart, accompanied by hard historical statistics, you stop trading illusions and start trading the institutional agenda.
You're Trading Illusions.
We Map The Institutional Blueprint.
Stop getting trapped in morning volatility. Know exactly where the market is statistically most likely to reverse, stall, or aggressively expand.
Morning Chop Massacre
You enter trades in the first hour based on momentum, only to get chopped up as price violently whipsaws within undefined ranges. You are fighting algorithmic volatility without knowing the true boundaries of the battlefield.
Flying Blind on Breakouts
You take a breakout trade beyond the morning high, but lack the historical data to know if it's a high-probability expansion or a classic institutional fakeout. You risk capital on hope instead of hard probability.
Statistical Certainty
The indicator automatically draws the opening ranges and calculates session statistics live on your chart. You see exactly how often a level breaks, turning subjective momentum trades into calculated, data-backed executions.
Understand The Opening Range In Minutes.

Raw Output: On-Chart Session Statistics & Probability Logic.
The Architecture Of The Edge
Everything you need to trade the morning session like a quantitative firm.
Map Institutional Footprints
Automatically plot the premarket, 30-minute, and 60-minute initial balance ranges, so that you know exactly where big money intends to defend their positions and trap retail traders.
Trade With Live Statistics
Access real-time probability metrics on how often session highs or lows are broken for your specific instrument, so that you can filter out low-probability fakeouts before ever risking your capital.
Target Algorithmic Extensions
Project advanced target zones from 100% to 600% beyond the initial balance, so that you have precise, mathematically derived profit targets the moment a major session breakout occurs.
Automate Your Morning Open
Seamlessly integrate with Bloodhound and NinjaScript to read session plots and states, allowing your automated systems to flawlessly execute high-probability opening range breakouts without hesitation.
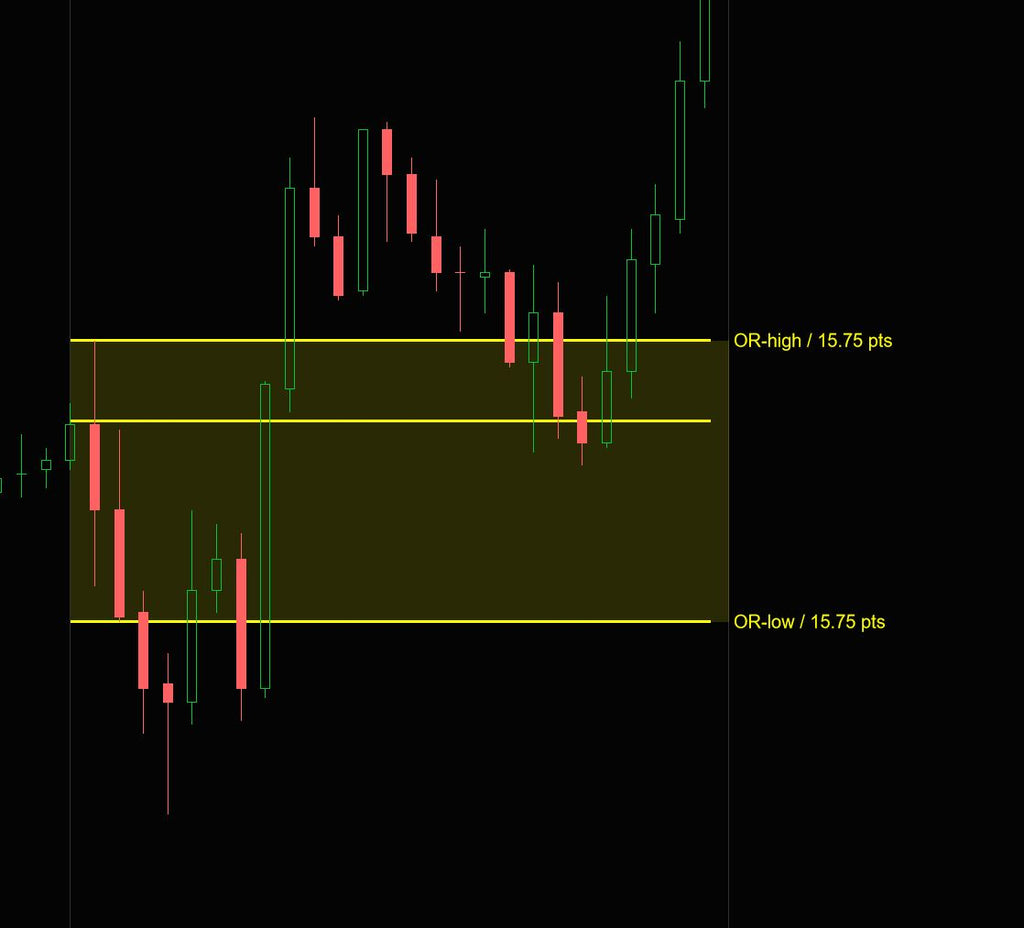
Dictate The Opening Range.
Stop fumbling with manual line drawing during the most volatile part of the day. The tool flawlessly calculates and plots the 30-minute and 60-minute boundaries, so you can immediately identify the day's foundational structure and pivot with the institutions.
- Instantly view high, low, and midpoint levels of the first hour.
- Customize exact start and end times to match any global market.
- Shade backgrounds to visually separate critical session phases.
Trade Based On Hard Statistics.
Don't guess if the market is trending or ranging. View historical data directly on your chart detailing how often the initial balance is broken, giving you the statistical edge required to size up on high-probability trend days and scale back during chop.
- See exact percentages of High vs Low session breaks.
- Analyze the average price expansion beyond the initial range.
- Filter out dangerous "fakeouts" using quantitative logic.

Target Mathematical Extensions.
When the market finally escapes the opening range gravity, it seeks liquidity at precise multiples. The indicator calculates extension levels (100% to 600%) dynamically, providing you with pinpoint accurate profit targets and reversal zones where algorithmic traders take profits.
- Project targets objectively, removing emotional "hope" from exits.
- Identify stacked confluence zones when extensions align with VWAP.
- Lock in profits right as institutional momentum stalls.
Define The Premarket Battleground.
The regular trading session doesn't happen in a vacuum. Price action constantly gravitates toward overnight highs and lows. The algorithm automatically maps the premarket extremes, ensuring you never accidentally fade a massive support/resistance level built while you were sleeping.
- Automatically detect premarket high, low, and mid levels.
- Configure specific premarket start times for strict accuracy.
- Catch massive bounce plays as the open tests overnight liquidity.

The Nerd Vault
Automatically calculates and plots Premarket, Opening Range (30m), and Initial Balance (60m) levels.
Projects mathematically accurate expansion targets from 100% up to 600% of the initial range.
Full control over session start/end definitions to adapt to any global index, forex pair, or crypto asset.
Built-in performance data revealing historical probabilities for session breaks and fakeouts.
Togglable level visibility and customizable background shading for distinct session phases.
Operates flawlessly across all instruments and bar types (Tick, Renko, Volume, Time).
Built for quants. The indicator exports raw range data directly into memory, providing robust integration capabilities for NinjaScript strategies, Bloodhound, or BlackBird.
- Session Extremes: Exposes exact High and Low plot data for Premarket, OR, and IB states.
- Midpoint Calculations: Outputs precise mid-level data for all defined session ranges.
- Extension Coordinates: Exports 100% to 600% target parameters for automated exit management.
- State Logic: Enables systems to detect if the current price action is contained within or has breached the opening ranges.
- 09-sep-2024 (v1.0.3.0) - Added precise Opening Range Midpoint (OR-mid) tracking.
- 03-mar-2024 (v1.0.2.8) - Added option to specify custom pre-market start times.
- 17-may-2023 (v1.0.2.3) - Resolved UI duplication in chart drop-down menus upon workspace reload.
- 28-apr-2022 (v1.0.2.2) - Implemented adjustable duration configurations for IB & OR logic. Added quick Enable toggles.
- 17-feb-2021 (v1.0.1.0) - Core release with foundational Bloodhound/Blackbird plotting integration.
Frequently Asked Questions
Everything you need to know about licensing, platform architecture, and trials.
General Info & Trials
Licensing & Billing
Platforms & Technical
Tools & Automation
Hardware & Specs
Ready to Automate Your Edges?
Stop guessing. Start executing with statistical certainty.