The Best Order flow Footprint indicator for Ninjatrader 8 - page 2
TDU FootPrint — Detailed Signals & Features
Complete documentation of every signal, imbalance, delta pattern, volume signal, and customization option.
Every signal includes detection rules, settings, and trading insights.
Page 1 — Product Overview | Page 3 — Strategies & Developer Guide
1. Imbalances
Imbalances detect aggressive buying or selling at specific price levels by comparing the bid and ask volume at adjacent price levels. When the ask volume at one level significantly exceeds the bid volume at the adjacent level (or vice versa), an imbalance is triggered. Imbalances are one of the most important order flow concepts — professional traders use them to identify areas of aggressive institutional activity and potential support/resistance zones.
Single Imbalances

The indicator highlights single delta imbalances at each price level. An imbalance occurs when the ratio between the bid and ask exceeds a predefined percentage.
Detection Rules
- Buy Imbalance: Ask(price) ≥ Bid(price − 1 tick) × imbalance ratio
- Sell Imbalance: Bid(price) ≥ Ask(price + 1 tick) × imbalance ratio
- Both bid and ask must show a minimum volume of 1 (prevents false imbalances on zero volumes)
Settings:
- Imbalance Ratio: Default 400% (industry standard). Increase for fewer, higher-quality signals. Decrease for more sensitivity.
- Minimum Volume: Default 1. Prevents imbalances when one side is zero.
- Delta Method: Horizontal (standard) or Diagonal (compares across ticks diagonally).
Visual: Buy imbalances highlighted with blue text, sell imbalances with red text. All colors customizable.
Multiple Imbalances

A multiple imbalance occurs when a bar contains 3 or more imbalances on the ask side and/or bid side. The entire bar is surrounded by a colored border — green for buy-side dominance, red for sell-side dominance.
Why this matters: Multiple imbalances indicate that aggressive activity isn't limited to a single price — the entire bar is dominated by one side. This is a much stronger signal than a single imbalance because it shows sustained institutional activity across many price levels.
Stacked Imbalances

Stacked imbalances occur when 3 or more consecutive price levels all have imbalances in the same direction. This is one of the most powerful imbalance signals — it indicates concentrated institutional activity in a narrow price range, often forming strong support/resistance zones that get revisited later.
Detection Rules
- 3+ consecutive price levels with buy imbalances (stacked buy) or sell imbalances (stacked sell)
- Minimum stack size is configurable (default: 3)
Settings:
- Minimum Stack Size: Default 3 levels. Lower for more signals, higher for stronger levels.
- Location Filter: Show all stacked imbalances, or only those at the top or bottom of the bar.
- Extension: Extend the zone for a fixed number of bars, until broken, or until tested.
Visual: Highlighted zone that extends to the right of the bar. Separate colors for buy/sell stacked imbalances.
Oversized Imbalances

An oversized imbalance is when the bid/ask ratio exceeds a much higher threshold (default: 1000%). These are extreme cases where one side is overwhelmingly dominant. Think of them as "super imbalances" — the aggressor's volume is 10x or more than the opposing side. These rare events often mark the most significant institutional activity on the entire chart.
How to trade it: Oversized imbalances should be rare — when you see one, pay attention. They often mark the exact price level where a large institution made a decisive move. Use these levels as high-confidence support/resistance for future entries, stops, and targets.
Settings: Oversized ratio is configurable (default: 1000%). Adjust based on your instrument's volume characteristics.
Visual: Highlighted with both colored text AND a colored outline (e.g., red text + red outline for sell oversized).
Big Imbalances

A big imbalance is detected when the volume on the dominant side at an imbalance level exceeds a configured threshold. Unlike regular imbalances which use a ratio, big imbalances focus on raw volume size — they tell you that a large number of contracts changed hands at a single price level. These represent significant institutional interest at a specific price.
How to trade it: Big imbalances pinpoint exactly where large players are active. Use them as key support/resistance levels. They should be rare — ideally 1–2 per day. If you see many, increase the threshold to filter out noise and keep only the most significant levels.
Settings: Big imbalance level (default: 1300 for ES). Adjust based on your market.
Visual: Yellow outline around the imbalance.
2nd Slot Delta Imbalances

A 2nd slot delta imbalance compares volume two ticks apart instead of one. It signals that buyers or sellers have failed to push the market in their direction.
Detection Rules
- Buy side: Red candle with a buy imbalance at the 2nd price level from the top (High − 1 tick)
- Sell side: Green candle with a sell imbalance at the 2nd price level from the bottom (Low + 1 tick)
Why this matters: Buyers spent heavy volume trying to push price up, but the candle closed lower anyway. Since buyers failed, price is likely to continue downward. The diamond marker on the chart makes these easy to spot.
Inverse Imbalances

Inverse imbalances are a powerful trapped-trader signal. They occur when there are stacked buy imbalances in a red bar, or stacked sell imbalances in a green bar. Aggressive traders went long (or short) trying to push price in their direction, but the bar closed against them — trapping them in losing positions.
How to trade it: Inverse imbalances mark failed breakout attempts. The trapped traders will eventually need to exit, adding fuel to the opposite direction. Look for continuation in the bar's closing direction. These zones also function as strong support/resistance since the trapped side will try to exit at breakeven if price returns.
Detection Rules
- Bullish: Red bar with multiple consecutive buy imbalances — buyers went aggressive but price closed lower, trapping them
- Bearish: Green bar with multiple consecutive sell imbalances — sellers went aggressive but price closed higher, trapping them
Extension: Fixed bars, until tested, or until broken.
Reversal Imbalances

A reversal imbalance detects potential turning points by looking at order flow at the edges of a bar. It occurs when buy/sell imbalances appear at the extreme price levels of a bar, but price closes in the opposite direction. This contradiction between aggressive activity at the edge and the closing direction often signals an upcoming pullback or reversal.
How to trade it: Reversal imbalances are early warning signals. A bearish reversal imbalance (buy imbalance at the top of a red bar) means buyers tried to push higher but failed — expect further downside. Combine with other signals like exhaustion prints or delta divergence for higher-probability entries.
Detection Rules
- Bullish: Green bar with a sell imbalance at one of the lower 2 price levels
- Bearish: Red bar with a buy imbalance at one of the upper 2 price levels
Consecutive Imbalances

Consecutive imbalances occur when a buy (or sell) imbalance appears at the same price level for 2 or more consecutive bars. This indicates an aggressive seller or buyer is actively defending that level across multiple bars.
Why this matters: A single-bar imbalance could be random. But when the same level shows imbalances bar after bar, someone is deliberately defending that price. These levels often become key support/resistance zones.
2. Print Signals
Print signals analyze volume at individual price levels to identify meaningful patterns. They reveal where the market moved fast (thin/zero prints), where heavy activity occurred (fat prints), and where momentum exhausted (exhaustion prints).
Zero Prints

A zero print is a price level where zero volume was traded on the bid or ask side. Price moved through so quickly that no orders were filled. Zero prints indicate fast, aggressive momentum.
Why this matters: These "skipped" levels represent gaps in the order book that often get revisited. They indicate where aggressive orders swept through the book without finding resting orders, and the market may return to fill them later.
Visual: Highlighted on the footprint chart. Bar marker and alert available.
Thin Prints

Thin prints are levels where very little volume was traded (below a configurable threshold). Price moved through quickly — aggressive buying or selling pushed price with minimal resistance.
Why this matters: Thin print areas represent "weak" price levels with poor volume support. The market often returns to fill these areas, making them potential trading targets.
Settings: Volume threshold (configurable). Extension: fixed bars, until broken, or until tested.
Fat Prints
Fat prints are the opposite of thin prints — levels where an unusually large amount of volume was traded (above a configurable threshold). These high-activity levels often serve as strong support or resistance.
Why this matters: Where lots of volume traded, lots of positions were opened. Those traders will defend their positions, creating support/resistance at those levels.
Settings: Volume threshold (configurable). Extension: fixed bars, until broken, or until tested.
Exhaustion Prints

Exhaustion prints detect when a move is running out of steam at its extreme. One of the most reliable reversal signals in order flow trading.
Bearish Exhaustion Print
- Red candle (close < open)
- Almost no volume at the ask at the high of the bar
- The bar tested the high but almost no buying occurred there — buying pressure is exhausted
Bullish Exhaustion Print
- Green candle (close > open)
- Almost no volume at the bid at the low of the bar
- The bar tested the low but almost no selling occurred there — selling pressure is exhausted
Settings: Exhaustion threshold (configurable). Extension: fixed bars, until broken, or until tested.
Why this matters: Exhaustion prints show where the market has run out of fuel. Price often reverses from these levels, making them excellent entry signals for counter-trend trades.
3. Delta Signals
Delta signals analyze the relationship between bar delta (ask minus bid volume), price action, and previous bars to identify turning points and continuation patterns. Each signal is shown as a letter code on the bar marker row and can display a colored vertical stripe behind the bar. All 11 delta signals are fully configurable and can be toggled individually.
Delta Rise (S)

Delta Rise Signal
A 4-bar signal that detects a sudden increase in delta where each successive bar has stronger delta than the previous. This indicates buyers (or sellers) are gaining control and the market may be starting to trend.
- Rules: 4 consecutive bars with increasing delta
- Bullish example: Bar 1: delta −461, Bar 2: +119, Bar 3: +429, Bar 4: +620
- Bearish: 4 consecutive bars with increasingly negative delta
Why use it: Delta Rise confirms building momentum. It's a trend-following signal — look for entries in the direction of the rise.
Delta Drop (O)

Delta Drop Signal
The opposite of Delta Rise. A 4-bar signal detecting decreasing delta — each bar has weaker delta. The current trend is losing steam.
- Rules: 4 consecutive bars with decreasing delta
- Example: Bar 1: delta +596, Bar 2: +13, Bar 3: −109, Bar 4: −130
Why use it: Early warning that buying/selling pressure is evaporating. Consolidation or reversal likely.
Delta Divergence (D)

Delta Divergence Signal
A trend reversal signal. Detects when price direction and delta direction disagree. Only triggers when the bar is the highest or lowest within the configured lookback period.
- Mode 1 — Candle Color vs Delta: Red bar with positive delta (bearish) or green bar with negative delta (bullish). Simplest mode.
- Mode 2 — Candle High/Low vs Delta: New high with negative delta & red bar (bearish) or new low with positive delta & green bar (bullish). Compares against previous bar.
- Mode 3 — Session High/Low vs Delta: Same as Mode 2, but compares against the session high/low instead of just the previous bar.
Settings: Three divergence modes — Session High/Low vs Delta (new extreme based on session), Candle High/Low vs Delta (based on previous bar), or Candle Color vs Delta (simplest). Lookback period configurable.
Delta Price Divergence

Delta Price Divergence Signal
Compares delta direction against price direction within the same bar. When delta and price move in opposite directions, the visible price action is not supported by the underlying order flow.
- Bullish: Negative delta but price closed higher — hidden buying is present
- Bearish: Positive delta but price closed lower — hidden selling is present
Why use it: Delta Price Divergence is an intra-bar signal (not multi-bar like regular divergence). It reveals hidden buying/selling that isn't visible from the candle alone. When price goes up but delta is negative, passive buyers are absorbing aggressive selling.
Delta Flip (F)
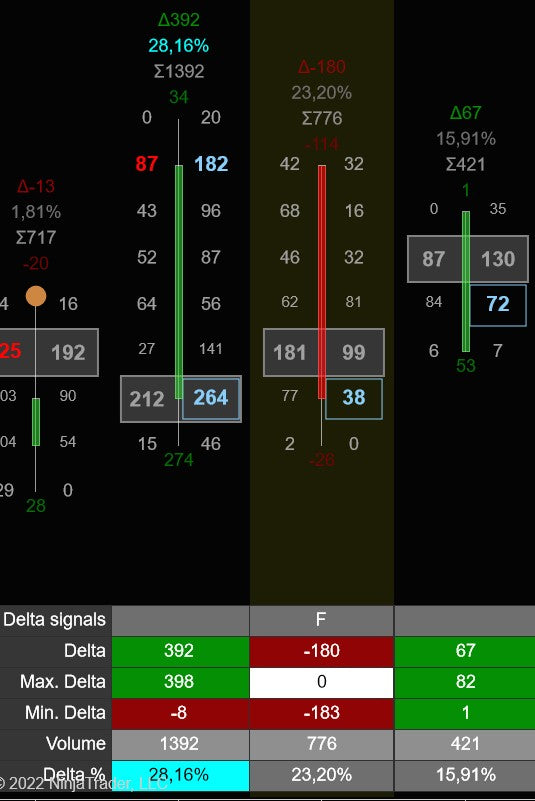
Delta Flip Signal
The Delta Flip captures a sudden and complete shift in market sentiment across two bars. One bar is dominated by one side, and the very next bar is dominated by the other — a clean handoff of control. This is one of the most decisive signals in order flow because it shows a clear change of heart by the market.
A 2-bar signal detecting a sudden shift in delta polarity. Look for these at important levels like swing lows/highs.
- Bullish: First bar closes at min-delta (near 0 max-delta), next bar closes at max-delta (near 0 min-delta)
- Bearish: First bar closes at max-delta, next bar closes at min-delta
How to trade it: Delta Flips are strongest at swing highs and lows. A bullish flip at a swing low means sellers dominated one bar, then buyers took complete control the next — a strong reversal signal. Enter in the direction of the flip and use the previous bar's extreme as your stop level.
Delta Tail (T)

Delta Tail Signal
The Delta Tail reveals absorption at the bar's extreme price level. It occurs when diagonal delta is one-directional at all price levels except one extreme — a "tail" of opposite delta at the edge where price reversed. This single contrary level shows exactly where a buyer (or seller) stepped in and absorbed the selling (or buying) pressure, causing the reversal within the bar.
- Bullish: Positive diagonal delta at the low, negative at all other prices — buying absorbed selling at the bottom
- Bearish: Negative diagonal delta at the high, positive at all other prices — selling overwhelmed buying at the top
How to trade it: Delta Tails show where a large player defended a price level. A bullish tail (buying at the low) suggests price won't easily break that level again. Use the tail level as support for entries or stop placement. Combines well with exhaustion prints and stopping volume for high-conviction reversal setups.
Delta Reversal (R)

Delta Reversal Signal
The Delta Reversal identifies high-energy bars where both buyers and sellers fought aggressively within the same bar. Unlike most signals that show one-sided dominance, this detects bars with extreme intrabar delta swings in both directions — a genuine tug-of-war. These bars often mark significant turning points because they represent a climactic battle between opposing forces.
- Bar's max delta exceeds the running average of all previous bars' max deltas
- Bar's min delta (absolute) exceeds the running average of all previous bars' min deltas
- Both conditions must be true — confirms a genuine tug-of-war, not just one-sided pressure
How to trade it: Delta Reversals mark the climax of a move. The losing side put up an above-average fight, suggesting that the balance of power is shifting. Watch the bar's closing direction for bias — if the bar closes green after the tug-of-war, buyers won. Use the bar's range as a key decision zone.
Delta Trap (A)

Delta Trap Signal
The Delta Trap catches a classic market trick: a pullback that lures counter-trend traders in, then reverses to continue the original trend. The trapped traders are forced to cover, adding fuel to the move. This is one of the most reliable continuation patterns because it exploits the mechanics of stop-loss liquidation.
A multi-bar signal identifying trapped traders in a strong trend. Price pulls back, trapping counter-trend traders, then continues in the original direction. Detected in 3-bar and 4-bar variants.
- Bullish 3-bar: Red bar with strong negative delta → 2 green bars with positive delta that outweighs the red bar's negative delta → last green bar has a value area gap up
- Bearish 3-bar: Green bar with strong positive delta → 2 red bars with negative delta → last red bar has value area gap down
- 4-bar variant: Adds a "pause" bar between the initial bar and the confirmation bars (e.g., Red → Green pause → Red → Red confirm with VA gap)
How to trade it: Enter in the direction of the trap confirmation (the final bar with the value area gap). The trapped traders' stop-losses become your fuel. Place your stop below/above the trap bar's extreme. This signal works best in trending markets where pullbacks are shallow.
Delta Continuous POC (C)

Delta Continuous POC Signal
The Delta Continuous POC combines price acceptance with momentum to identify high-probability trend continuations. When two consecutive bars share the same POC, the market has accepted that price level as fair value. A subsequent directional bar with a value area gap then confirms that the market is ready to move away from that accepted level — a clean trend continuation setup.
- Two consecutive bars share the same POC (price acceptance at that level)
- Bullish: Next bar is green with strong positive delta and a value area gap up from the previous bar
- Bearish: Next bar is red with strong negative delta and a value area gap down from the previous bar
How to trade it: Enter on the confirmation bar (the one with the value area gap). The two prior bars with shared POC show that the market built a base — now it's breaking out. Use the shared POC level as your support/resistance for stop placement.
Delta Sweep (W)

Delta Sweep Signal
The Delta Sweep detects aggressive institutional entries that clear multiple price levels in a single bar. A big trader enters the market and sweeps through thin areas of the order book with large delta to push price forward. These events indicate strong conviction from a large player willing to absorb whatever resting orders exist in their path.
- Bullish: Green bar with a market sweep and strong positive delta
- Bearish: Red bar with a market sweep and strong negative delta
Settings: Option to filter market sweeps at candle highs/lows only.
How to trade it: Delta Sweeps show institutional conviction. Trade in the direction of the sweep. When filtered to candle highs/lows, they identify breakout bars where the sweeping trader is pushing through a significant price level. Use the sweep zone as a pull-back entry area.
Delta Slingshot (I)

Delta Slingshot Signal
The Delta Slingshot captures dramatic momentum reversals. Like a slingshot being pulled back and released, price stretches in one direction with extreme delta, then snaps back with even stronger force in the opposite direction. This is one of the most visually dramatic signals and often marks the beginning of a new trend leg. Detected in 2-bar, 3-bar, and 4-bar variants.
- Bullish (2-bar): Red bar with extreme negative delta → green bar that closes above the red bar's high with extreme positive delta
- Bullish (3-bar): Red bar with extreme negative delta → middle bar stays below the red bar's high → green bar closes above with extreme positive delta
- Bullish (4-bar): Same as 3-bar but with 2 middle bars that both stay below the initial red bar's high
- Bearish: Mirror of the above — green bar(s) with extreme positive delta followed by a red bar closing below with extreme negative delta
How to trade it: Slingshots are reversal entries. The initial extreme-delta bar(s) represent exhausted one-sided pressure. When the snap-back bar closes beyond the initial bar's range, the reversal is confirmed. Enter on the slingshot bar and place your stop beyond the extreme of the initial bar. The 2-bar variant is most aggressive; 3-bar and 4-bar are higher-probability but arrive later.
Delta Close at Min / Max Delta

Delta Close at Min / Max Delta
A single signal that returns 1 when the bar's closing delta is within 95% of its intrabar extreme:
- Green bar: Closing delta ≥ 95% of max delta — buying pressure was strongest right at the close
- Red bar: Closing delta ≤ 95% of min delta — selling pressure was strongest right at the close
4. Volume & Advanced Signals
Volume Sequencing

Volume sequencing reveals institutional accumulation in real time. It detects when ask or bid volume at each successive price level is increasing — e.g., 100 contracts at one level, 150 at the next, 200 above that. This staircase pattern indicates large players are aggressively building a position, adding more contracts at each new price level as they push the market in their direction.
How to trade it: Volume sequencing at the bottom of a bar suggests a large buyer is accumulating — look for long entries. At the top, a seller is distributing — look for shorts. These zones often become strong support/resistance because the institution will defend their accumulated position.
Detection Rules
- Bullish: Ask volume at each higher price is increasing (e.g., 100, 150, 200, 250)
- Bearish: Bid volume at each lower price is increasing
Settings: Extension options (fixed bars, until broken, or until tested). Location filter: show at top/bottom only.
Sweeps (Market Sweeps)

Market Sweeps identify areas of minimal resistance in the order book. They detect consecutive price levels where volume is very thin — price moved through rapidly because there were almost no resting orders. A sweep is an area where aggressive orders cleared the book so fast that only a handful of contracts traded at each level. These "thin zones" often get revisited because they represent poor price discovery.
How to trade it: Sweep zones are areas of low volume that price rushed through. Like zero prints and thin prints, the market often returns to fill these areas. Use sweep zones as targets for mean-reversion trades, or as warning areas where price can move fast again on a retest.
Detection Rules
- Consecutive bid (or ask) volumes at adjacent price levels are all ≤ the max sweep volume threshold
- The number of consecutive thin levels must meet the minimum sweep level count
Settings: Max sweep volume per level (threshold), minimum consecutive levels, location filter (all or at candle highs/lows only). Extension: fixed bars, until broken, or until tested. Bar marker available.
Stopping Volume

Detection Rules
- Bullish: In a downmove, heavy bid volume but price stops declining — a large resting buyer absorbs all the selling
- Bearish: In an upmove, heavy ask volume but price stabilizes — a large resting seller absorbs all the buying
Why this matters: Stopping volume is one of the strongest reversal signals. When aggressive selling can't push price lower despite heavy volume, a big player is absorbing everything. This is exactly how institutional reversals happen.
Fading Momentum

Detection Rules
- Bullish fading: 3+ bars with negative delta where each bar's delta is less negative (increasing toward zero) and the current bar is green — selling pressure is fading
- Bearish fading: 3+ bars with positive delta where each bar's delta is lower (decreasing toward zero) and the current bar is red — buying pressure is fading
Why this matters: An early warning that the current move is running out of energy even though delta is still on the same side. The fading side is losing conviction, and a reversal or consolidation may be approaching.
Absorption
Absorption
Absorption is one of the most important institutional footprints. It detects when large passive orders (limit orders) absorb aggressive market orders without letting price move. This is exactly how institutional players accumulate or distribute positions — they place large limit orders that soak up all the aggressive selling (or buying) while keeping price stable. The footprint shows high volume but no price movement, which is the telltale sign of absorption.
How to trade it: When you see bullish absorption (heavy selling being absorbed by a large buyer), expect price to eventually move higher once the selling dries up. The absorber controls the market. Wait for the aggressive side to exhaust, then enter in the absorber's direction. Works well at support/resistance levels and near session extremes.
- Bullish: High bid volume but price doesn't fall — passive buyer absorbing selling
- Bearish: High ask volume but price doesn't rise — passive seller absorbing buying
Passive Absorption

Passive Absorption
Passive Absorption detects bars where above-average volume concentrates at the price extreme and tapers off moving inward. This pattern reveals passive limit orders absorbing aggressive market orders at the bar's edge — a sign that a large player is defending a price level.
How to trade it: Passive absorption identifies levels where strong passive orders are sitting. These levels are likely to hold on retests. Use it for entries near the absorption level with tight stops just beyond it. If the passive order gets overwhelmed (price breaks through with volume), the level is invalidated.
- Bullish: Above-average bid volume at the bar's low that strictly decreases at each price level moving upward — passive buyers absorbing aggressive selling
- Bearish: Above-average ask volume at the bar's high that strictly decreases at each price level moving downward — passive sellers absorbing aggressive buying
Bid/Ask Fade

Bid/Ask Fade
Detects when volume on one side diminishes across consecutive price levels at the bar's extreme, signaling that the losing side is withdrawing.
- Bullish: Green bar where bid volume at the bottom 3 price levels is declining upward (bid2 > bid1 > bid0) — selling pressure is fading at the low
- Bearish: Red bar where ask volume at the top 3 price levels is declining downward (ask2 > ask1 > ask0) — buying pressure is fading at the high
Why use it: Bid/Ask Fade catches the moment when one side starts giving up. Unlike absorption (which detects passive orders), fade detects withdrawal of aggressive orders — a different but equally important sign of directional change.
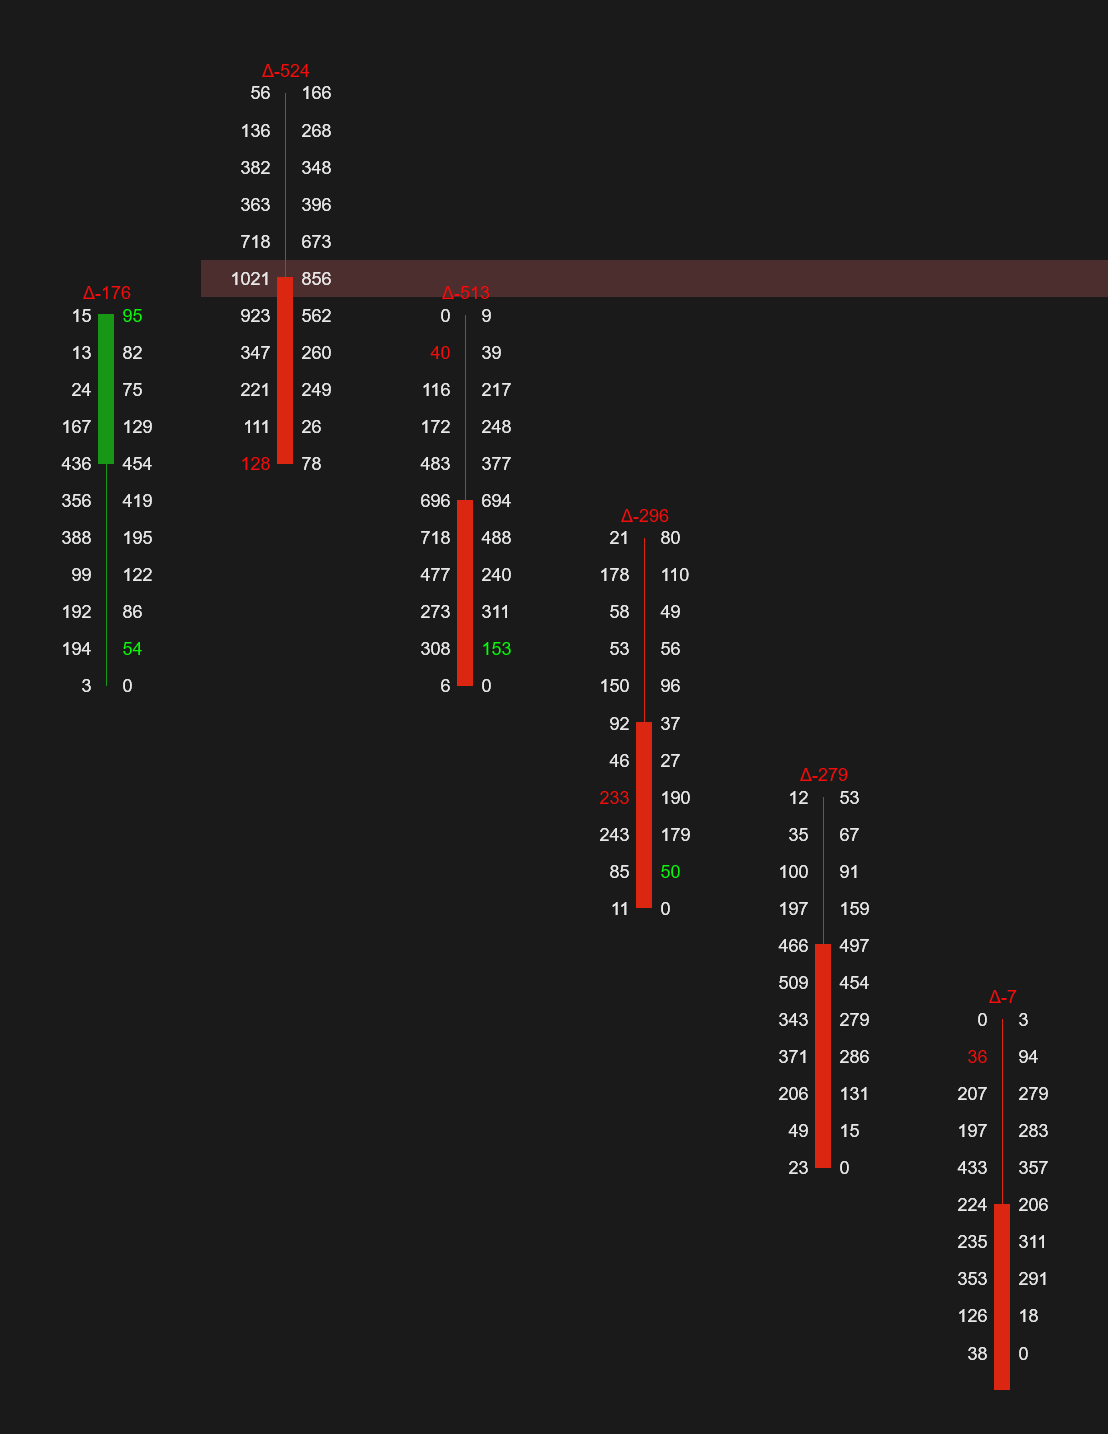
Big Delta
Big Delta highlights price levels where delta at a single price level exceeds a configurable threshold. While imbalances compare bid vs ask volume, Big Delta simply flags levels where the net delta is unusually large — meaning one side was overwhelmingly dominant at that exact price. These levels represent concentrated directional conviction at a specific price.
How to trade it: Big Delta levels show where aggressive traders committed significant capital in one direction. These levels tend to act as support (big positive delta) or resistance (big negative delta) on retests. Extend the zone forward to see when price revisits these high-conviction levels.
Settings: Delta threshold (configurable). Extension: fixed bars, until broken, or until tested.
Unfinished Business

Unfinished business (unfinished auction) occurs when a bar makes a new high and there is non-zero bid volume at that high, or makes a new low with non-zero ask volume at that low. The presence of resting orders at the new extreme means the auction was not completed — buyers (at highs) or sellers (at lows) were still active when price reversed.
Why this matters: Price often returns to "finish" these levels. High-probability targets for price to revisit.
5. POC & Value Area Signals
Above/Below POC

Above/Below POC Signals
Very powerful at new swing lows or highs. Indicate the market reached a top (or bottom) and is ready to reverse.
- Above POC (+1): Open and close both above POC — green triangle below candle
- Below POC (−1): Open and close both below POC — red triangle above candle
- Mixed (0): Open and close straddle the POC
Open & Close above/below POC
Separate, more granular signals for strategy building. Returns 1 when both open and close are above POC, or −1 when both are below.
Bullish/Bearish POC

Bullish/Bearish POC
The Bullish/Bearish POC reveals the power dynamic inside a bar by looking at where the most volume occurred relative to the close. It identifies whether the POC is at the bottom of a green bar or the top of a red bar. When the highest volume is at the extreme opposite to the close, it means aggressive traders stepped in and prevented further movement — a strong directional signal. Think of it as the market showing its hand: the most activity was at the turning point.
How to trade it: A bullish POC (high volume at the bottom of a green bar) is a strong buy signal — a large buyer absorbed all the selling at the low. Use it to confirm long entries, especially when combined with other signals like delta divergence or stopping volume.
- Bullish (+1): Green bar with POC in the lower portion (within configurable number of levels from the low, default 3). Buyers absorbed selling at the bottom.
- Bearish (−1): Red bar with POC in the upper portion (within configurable levels from the high). Sellers overwhelmed buying at the top.
- Lookback period: Optionally only shows when bar is highest/lowest over N bars
Extreme POC
Extreme POC
The Extreme POC detects bars where the highest volume occurred at the bar's high or low — the most extreme possible position. This is an unusual condition that indicates heavily one-sided activity at the bar's edge, often signaling that the market is either about to continue strongly in that direction or has reached exhaustion.
How to trade it: An extreme POC at the high often means buyers were aggressive right up to the top — continuation may follow. At the low, sellers pushed hard all the way down. Use with candle direction for context: if the bar closed against the extreme POC location, it may signal a reversal.
- 1: POC is at the bar's high or low (either extreme)
- 0: POC is not at an extreme
Consecutive POC
Consecutive POC
The Consecutive POC identifies price levels where the market finds fair value across multiple bars. When 2+ consecutive bars have their POC at the same price, the market is clearly accepting that level as an equilibrium point — the heaviest trading activity keeps gravitating to the same price.
How to trade it: Consecutive POCs reveal strong anchoring levels. These levels often become magnets for price if the market moves away. Trade breakouts from consecutive POC zones for trend entries, or fade back to the level if price extends too far. Highlighted with yellow background by default.
POC Gap

POC Gap
The POC Gap detects a dramatic shift in market value. When a bar's POC is above the previous bar's high or below its low, the market has relocated its center of gravity entirely outside the previous bar's range. This is one of the strongest directional signals in the POC family because it represents a complete rejection of the previous bar's value area.
How to trade it: POC Gaps indicate strong conviction. Trade in the direction of the gap. The gap zone often acts as a magnet for future price (similar to unfinished business). If price pulls back to the gap zone, it's often a good re-entry point in the gap direction.
POC In Wick

POC In Wick
The POC In Wick detects a subtle but important condition: the highest volume occurred in the candle's wick (shadow) rather than its body. This means the market traded most actively at a price that was ultimately rejected — the heaviest fighting happened outside the final open-close range. This is a sign of price rejection and often precedes continuation away from the wick.
How to trade it: When the POC is in the upper wick, buyers were aggressive there but lost — bearish. When in the lower wick, sellers were aggressive but price recovered — bullish. The POC-in-wick level becomes support/resistance because many positions were opened there. Available as a visual highlight and as an exportable plot for automated strategies.
POC Momentum Wave

POC Momentum Wave
Tracks whether the POC is consistently moving in one direction across consecutive bars.
- Bullish (1): POC rising across bars — volume shifting higher
- Bearish (−1): POC falling across bars — volume shifting lower
Why use it: Confirms trend direction using volume distribution rather than price alone. When the POC keeps moving higher, it means the market is accepting higher prices — even if candle direction is mixed.
Engulfing Value Area & Value Area Gap

Engulfing Value Area
The Engulfing Value Area detects when the current bar's value area completely engulfs the previous bar's — a significant expansion in where the market finds value. This often marks key turning points because it shows a dramatic change in market participation and range.
How to trade it: Engulfing value areas are expansion signals. A bullish engulfing VA (expanding to the upside) suggests strong buying interest. Use the previous bar's value area as your reference for stop placement. Separate colors for bullish/bearish.

Value Area Gap
The Value Area Gap is one of the strongest directional signals. It occurs when there is zero overlap between the current and previous bar's value areas — the market has completely shifted where it finds fair value. This means aggressive buyers or sellers entered the market with enough force to relocate the entire value area.
How to trade it: Value area gaps indicate strong momentum. Trade in the gap direction. The gap between the two value areas often acts as support on retests. If a value area gap fills (price returns to the previous value area), the move may be reversing.
6. Trapped Traders

The Trapped Traders signal identifies participants stuck in losing positions. When traders get trapped on the wrong side, they eventually need to close — creating additional momentum in the opposite direction.
Detection Rules
- Bullish Trapped Traders (+1): Green bar where most volume was at the bottom. Sellers are trapped — sold at the bottom but bar closed green. They must buy to exit, adding buying pressure.
- Bearish Trapped Traders (−1): Red bar where most volume was at the top. Buyers are trapped — bought at the top but bar closed red. They must sell to exit, adding selling pressure.
Why this matters: Trapped traders are forced to unwind their positions, creating additional momentum. The covering of trapped positions accelerates the move, making this a powerful continuation signal.
7. Bar Markers & Vertical Stripes
Every delta signal is represented by a letter code on the bar marker row. When multiple signals fire on the same bar, all letters appear together. Each signal can optionally display a colored vertical stripe behind the bar.

Delta Signal Letters & Stripes
| Letter | Signal | Default Stripe |
|---|---|---|
| S | Delta Rise | Magenta |
| O | Delta Drop | Red |
| D | Delta Divergence | Blue |
| F | Delta Flip | Yellow |
| T | Delta Tail | Orange |
| R | Delta Reversal | Light Salmon |
| A | Delta Trap | Configurable |
| C | Delta Continuous POC | Configurable |
| W | Delta Sweep | Purple |
| P | Trapped Traders | Configurable |
| I | Delta Slingshot | Configurable |
Individual Bar Marker Toggles
Every bar marker can be toggled on or off individually from the easy access dropdown menu. This gives you complete control over which signals appear on your chart. The following markers are available:
Delta Signal Markers
- Delta Divergence
- Delta Rise
- Delta Drop
- Delta Flip
- Delta Reversal
- Delta Tail
- Delta Trap
- Delta Sweep
- Delta Slingshot
- Delta Continuous POC
- Delta Close at Min/Max
- Above/Below POC
- Bullish/Bearish POC
- Trapped Traders
Other Signal Markers
- Reversal Imbalances
- Inverse Imbalances
- Stacked Imbalances
- Multiple Imbalances
- Market Sweep
- Exhaustion Print
- Thin Print
- Zero Print
- Fat Print
- Big Delta
- Stopping Volume
- Absorption
- Volume Sequencing
- Fading Momentum
Delta Signal Vertical Stripes

Each signal can show a vertical stripe behind the bar. Stripes are toggled individually from settings or the dropdown menu. All colors customizable.

5 Custom Dynamic Vertical Stripes

Define up to 5 custom vertical stripes using C# expressions. Any condition you can express in code can drive a custom stripe.
// Show stripe when volume > 10000
if (Volume >= 10000) {
  Opacity=30; BackgroundColor="Cyan";
}

// Stripe on reversal candles (red bar + positive delta)
if ((IsRedBar && Delta > 0) || (IsGreenBar && Delta < 0)) {
  Opacity=30; BackgroundColor="Cyan";
}

// Stripe when delta closes at extreme
if ((Delta < 0 && Math.Abs(Delta) >= 600
     && Math.Abs(Delta) >= Math.Abs(MinDelta) * 0.95)
  || (Delta > 0 && Math.Abs(Delta) >= 600
     && Delta >= MaxDelta * 0.95)) {
  Opacity=30; BackgroundColor="Yellow";
}
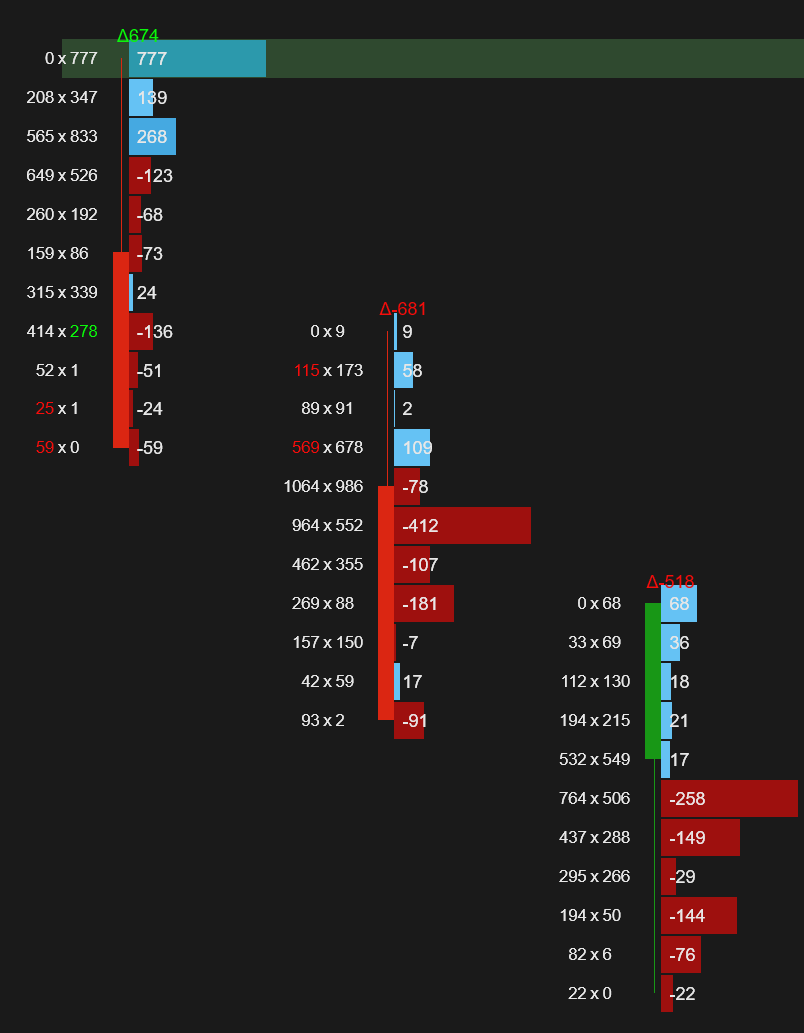
8. Delta Bars

Optional delta bars above the summary table provide a quick visual of delta percentage changes. Just look at the height of the bars to spot delta spikes or drops.
Labels beneath the bars: Delta percentage, delta value, and/or volume (all toggleable).
Settings
- Max Height: Controls the maximum bar height (default: 10)
- Show labels: Toggle delta %, delta, and volume displays
- Colors: Customizable positive and negative colors

9. Volume Bubbles

Volume Bubbles highlight price levels with unusually high volume, making it effortless to spot where big players stepped in. Instead of manually scanning every price level for high-volume activity, bubbles automatically draw your eye to the levels that matter most. These are the exact price levels where institutional-size orders were filled — the levels that will likely become strong support or resistance going forward.
How to trade it: Volume bubble levels are where large positions were opened. Those traders will defend their positions, so expect price to find support or resistance when it returns to a bubble level. Use bubble levels as targets, entry zones on pullbacks, or stop-loss reference points.
Detection Modes
Auto Detection (Statistical)
Uses statistical analysis to dynamically detect unusual volume. The system adapts to current market conditions — what counts as "big" is calculated dynamically based on recent history. Volume must exceed both a percentile threshold and a standard deviation threshold to qualify.
Fixed Threshold
Set a fixed volume threshold. Any price level where volume exceeds the threshold gets a bubble. Simple, predictable, and great when you already know what "big" means for your instrument.
Display Modes
Bubble
A circular bubble drawn at the price level. Bubble size scales with volume (logarithmic scaling, base range 6–25px). Size adjustable via a multiplier. Separate colors for buy-side (ask) and sell-side (bid) bubbles.
Text with Background
Colored background rectangle behind the volume text. More subtle than bubbles and easier to read on dense footprint charts. Separate colors, font, and strokes for buy/sell sides.
Settings Reference
| Setting | Default | Description |
|---|---|---|
| Detection Mode | Auto (Statistical) | Choose between Auto (adaptive statistical detection) or Fixed Volume Threshold (manual cutoff). |
| Sensitivity | 50 (1–100) | Master control for Auto mode. Adjusts percentile, std dev multiplier, min volume, and noise filter together. Higher = more bubbles, Lower = fewer, higher-quality bubbles. |
| Lookback | 10 bars | Number of historical bars used for Auto mode's statistical analysis. More bars = smoother baseline, fewer bars = more responsive to recent conditions. |
| Percentile Threshold | 90 | Auto mode: Volume must exceed this percentile of all recent volumes. Range: 90–99.9 (auto-adjusted by Sensitivity). |
| Std Dev Multiplier | 2.0 | Auto mode: Volume must also exceed mean + (multiplier × std dev). Range: 2.0–8.0 (auto-adjusted by Sensitivity). Higher = stricter. |
| Min Volume | 10 | Minimum volume required at a level before it can be considered. Filters out low-volume noise. Range: 5–50 (auto-adjusted by Sensitivity). |
| Temporal Weighting | On | When enabled, more recent bars are weighted higher in the statistical analysis (exponential decay). This makes the detection adapt faster to changing market conditions. |
| Noise Filter Percentile | 50 | Auto mode: Removes low-volume samples below this percentile before calculating mean/std dev. Prevents quiet levels from skewing the statistics. Range: 20–80 (auto-adjusted by Sensitivity). |
| Fixed Threshold | 40 | Fixed mode only: Volume at a price level must exceed this value to get a bubble. |
| Size Multiplier | 1.3 | Scales the bubble radius. Increase for larger, more visible bubbles; decrease for subtler markers. |
| Display Mode | Bubble | Choose Bubble (circular shape) or Text with Background (colored rectangle behind volume text). |
| Buy Bubble Color | LimeGreen (50% opacity) | Color and opacity for buy-side (ask) volume bubbles. |
| Sell Bubble Color | Red (50% opacity) | Color and opacity for sell-side (bid) volume bubbles. |
| Text Font | Arial 10pt Bold | Font for the volume text in Text display mode. |
| Buy Text Color | White | Text color for buy-side volumes in Text display mode. |
| Sell Text Color | White | Text color for sell-side volumes in Text display mode. |
| Buy Background | LimeGreen (80% opacity) | Background rectangle color for buy-side volumes in Text display mode. |
| Sell Background | Red (80% opacity) | Background rectangle color for sell-side volumes in Text display mode. |
10. Paint Bars
Paint Bars color the candle body and outline based on delta direction, adding a visual layer beyond standard candle coloring.
| Mode | What It Does | When To Use It |
|---|---|---|
| Off | Standard candle colors | Default. Use when you prefer traditional candle coloring. |
| Transparent | Transparent body with colored outline based on delta | See footprint data through the candle while still knowing delta direction from the outline. |
| On | Solid body colored by delta direction | Maximum emphasis on delta direction. Up/down colors and outlines fully customizable. |
11. Display & Filtering
Cut through the noise and focus on what matters. These settings filter out insignificant activity and highlight the most important levels.
Volume Filter (Big Trades)

Filters the footprint to only show volume from trades above a configurable size threshold. Isolates institutional orders from retail noise.
How to use: Start with 10–20 contracts on ES and adjust. The footprint will only show volume from trades ≥ your threshold — everything smaller is hidden. This reveals where the big players are actually trading.
Volume Display Filter

Hides price levels where total volume is below a threshold. Only significant levels are displayed. Useful when combining the footprint with standard candle charts.
Delta Filter

Hides cells where absolute delta is below a threshold. Useful in delta-mode views to only show levels with significant directional volume.
Other Display Settings
Volume Divider
Divides all volume numbers by 1, 10, 100, or 1000 for cleaner display on high-volume instruments.

Shorten Big Numbers
Converts 1,500 → "1.5K" and 2,000,000 → "2M" for easier reading in footprint cells.

Additional settings: Cell separator (x, |, or space), decimal places (0, 1, or 2), background direction (Left→Right or Right→Left), text alignment (Center, Inner, Left, Right), and swing filter for cleaner signal detection.
12. Customization & Color Rules
Write custom C# expressions to dynamically color bar statistics, vertical stripes, and summary table cells. Three independent rule sets give you unlimited flexibility.
Bar Statistics Dynamic Colors

Apply custom C# color expressions to bar statistics rows. Each row can have its own rule based on any available variable. Leave a rule empty to use default colors.
Vertical Stripe Dynamic Colors

Create entirely custom stripe conditions beyond the built-in signals. Up to 5 custom stripe rules with full access to bar variables, opacity control, and color names.
Footprint Summary Dynamic Colors

Define custom C# color rules for summary table cells. Highlight conditions like high delta, extreme ratios, or specific volume thresholds.
Available Variables for Custom Rules
| Variable | Type | Description |
|---|---|---|
delta / Delta
|
double | Bar delta (ask − bid) |
volume / Volume
|
double | Total bar volume |
bid / ask
|
double | Total bid/ask volume |
trades |
double | Number of trades |
maxDelta / MinDelta
|
double | Max/min delta during bar |
MaxDelta |
double | Max delta during bar |
cumulativeDelta |
double | Cumulative session delta |
deltaChange |
double | Delta change from previous bar |
DeltaPercentage |
double | Delta as % of volume |
Ratio |
double | Bid/ask ratio |
volumePerSecond |
double | Volume per second |
duration |
double | Bar duration (seconds) |
open, high, low, close
|
double | Bar OHLC prices |
poc |
double | POC price |
isGreenBar / isRedBar
|
bool | Bar direction |
Opacity |
int (0–255) | Stripe opacity (stripes only) |
BackgroundColor |
string | Color name (e.g., "Cyan", "Yellow") |
TextColor |
string | Text color name |
13. Statistics & Metrics
A comprehensive set of statistics calculated for every bar. All metrics are available in the summary table and as exportable plots for strategies.
| Metric | Description |
|---|---|
| Volume | Total volume of the bar (bid + ask) |
| Buy Volume | Total ask (buy) volume — aggressive buyers lifting the ask |
| Sell Volume | Total bid (sell) volume — aggressive sellers hitting the bid |
| Delta | Ask minus bid volume. Positive = more buying, negative = more selling |
| Delta % | Delta as a percentage of total volume. Measures how one-sided the bar was |
| Delta Change / Delta Change % | How delta changed from previous bar (absolute and percentage) |
| Delta Move | abs(MinDelta) + abs(MaxDelta). Total magnitude of delta movement in the bar |
| Delta Volume (Volume Change) | Volume change from previous bar |
| Volume Change % | Percentage change in volume from previous bar |
| Min Delta / Max Delta | Extreme delta values during bar formation |
| Min Delta Volume / Max Delta Volume | Extreme volume change values during bar formation |
| Cumulative Delta | Running cumulative delta since session open |
| Cumulative Delta Volume | Absolute value of cumulative delta. Measures magnitude regardless of direction |
| Cumulative Volume | Running cumulative volume since session open |
| Delta Std Dev / Volume Std Dev / Trades Std Dev | Standard deviation over last 14 bars. Identifies unusual activity |
| Delta Efficiency | Delta ÷ bar range (ticks). How efficiently delta moved price — higher = more efficient |
| Delta Rate | Speed of delta change per period. Period type: per Tick or per Millisecond (configurable) |
| Bid/Ask Ratio | Ratio between buy and sell volume. Near 1.0 = balanced |
| Volume/Sec | Volume per second. Higher = faster, more aggressive bars |
| Duration | Bar formation time in seconds. Short = fast moves, long = consolidation |
| Trades | Total number of individual trades |
| POC Price / POC Volume / POC Delta | Price, volume, and delta at the point of control |
| Value Area High / Value Area Low | Boundaries of the 70% value area |
| COT High / COT Low | Delta traded since bar made a new high or low |
| Current Session | Numeric identifier for the current trading session |

Page 1 — Product Overview | Page 3 — Strategies & Developer Guide