


1. A complete profitable (manual) scalping package
NOTE: This is a manual trading strategy. It's not an automated strategy
The Devils scalper trading package is a complete trading package that contains everything you need to become a profitable trader
It is designed to limit your drawdown and to pass funded trading tests. such as Leeloo, Apex, EarnToTrade, or TopStep.
In fact, we used the Devils Scalper Package ourselves to pass both the Leeloo 50k and the Leeloo 100k trading evaluation tests
The Devils scalper Trading package contains ALL the indicators, chart templates, and training video (see below) you need to become a profitable trader
It includes 8 indicators, chart templates, and workspace templates. We included videos on how to set up this package on your system, which setups we are trading, and details about our entries and exits
2. Passes the Leeloo 50K & 100K evaluation tests
2.1 Passed the Leeloo 50K evaluation test
To prove this strategy and trading package works we did the Leeloo 50K trading evaluation test and passed it using this package & strategy.
Below you can find the equity curve of our trades. The profit target for the 50K evaluation test is $3000 with a trailing drawdown of $2500. We never came close to the trailing drawdown, and by taking it easy we see a very nice equity curve that reaches the profit target after +/- 20 days.
In the videos below we go deeper into the statistics

2.2 Passed the Leeloo 100K evaluation test
And to demonstrate that this was not just pure luck, we did It again and passed the Leeloo 100k trading evaluation test as well.
Note that we reached the $6000 target for the 100k account in just 9 days. However, since Leeloo requires you to trade a min. of 10 days we had to trade 1 extra day to complete the evaluation test
Below you can find the equity curve of our trades. The profit target for the 100K evaluation test is $6000 with a trailing drawdown of $3000. We never came close to the trailing drawdown, and by taking it easy we see a very nice equity curve that eventually reached the $6000 profit target.
See the videos at the bottom of this page in which we take a deeper look into the statistics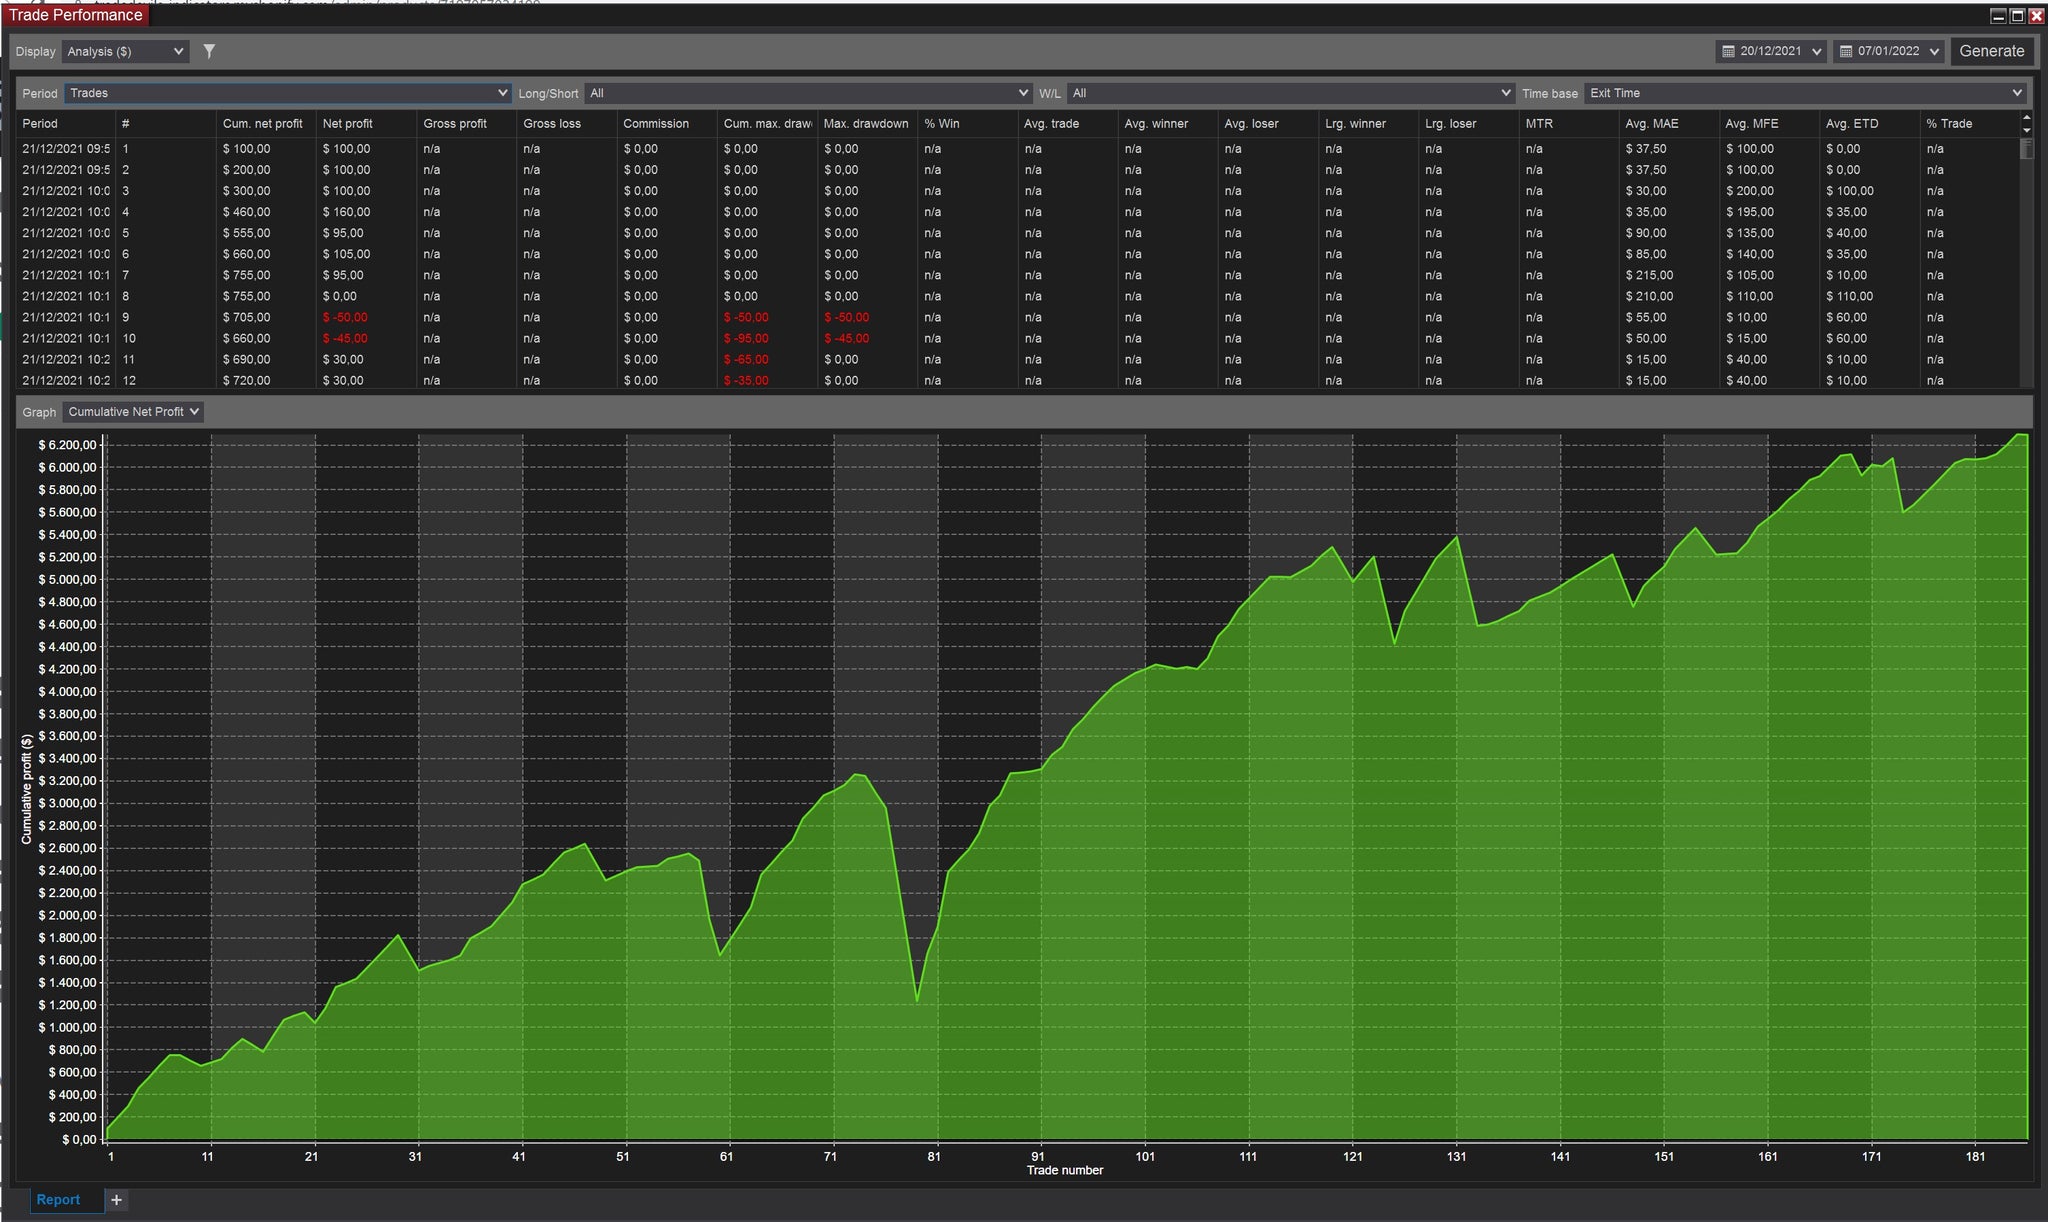
2.3 You can do it too!!
In the videos below we explain exactly what our strategy is and how we used it to pass both the 50K and 100K evaluation tests. Scroll to the bottom for all the videos
3. Included indicators
The trading package comes with all the indicators you need to pass funding tests. Below we list all the indicators which are included in this package. Be sure to visit the product page for each indicator for more details about that particular indicator
3.1 Multi-timeframe Support & Resistance Indicator ($199)

Support & resistance or supply & demand play a vital role in the financial markets. Time after time we see the market respecting previous levels of support & resistance. This makes these levels excellent areas to look for a trade.
Our indicator will plot the support/resistance (or supply/demand) levels in real-time on your chart. Both active and broken levels can be shown. Besides this, it can also show all the previous touches for all the active support & resistance levels. This gives you a clear indication of how strong a level is
You can use the current timeframe or any other timeframe for the support/resistance. For example, the indicator allows you to plot the 60min S&R levels onto a 5min chart
Click here to read more about the Support & Resistance indicator
3.2 Daily Pivots Indicator ($99)

The concepts of support and resistance are two basic aspects of day-to-day trading. These tools help traders to clearly establish the points where the price can bounce, allowing them to also determine when to enter and when to exit trades.
While it's true that mastering the concepts of support and resistance can help you build a more effective strategy, it's also true that these tools are subjective, which in many occasions can lead you to make some mistakes.
For this reason, many traders use indicators to correctly determine and draw the perfect support and resistance levels.
Pivot points or daily pivots are one of the most reliable tools for this and today, you'll understand why so many traders love them.
Pivot points are something that has been used by traders since the '80s. Calculated based on the high, low, and closing prices of previous trading sessions, the TDU Pivots indicator tracks and draws key pivot points that can be used to predict key support and resistance levels in the current or upcoming session. Since they are widely known and regularly used, we see the markets respecting these pivots on a daily basis, making them an important consideration for traders determining suitable entry and exit points, stop-loss positioning, and profit-taking zones.
You can choose between the traditional pivot points or the Jackson zones
Click here to read more about the daily pivots indicator
3.3 Initial Balance Indicator ($149)
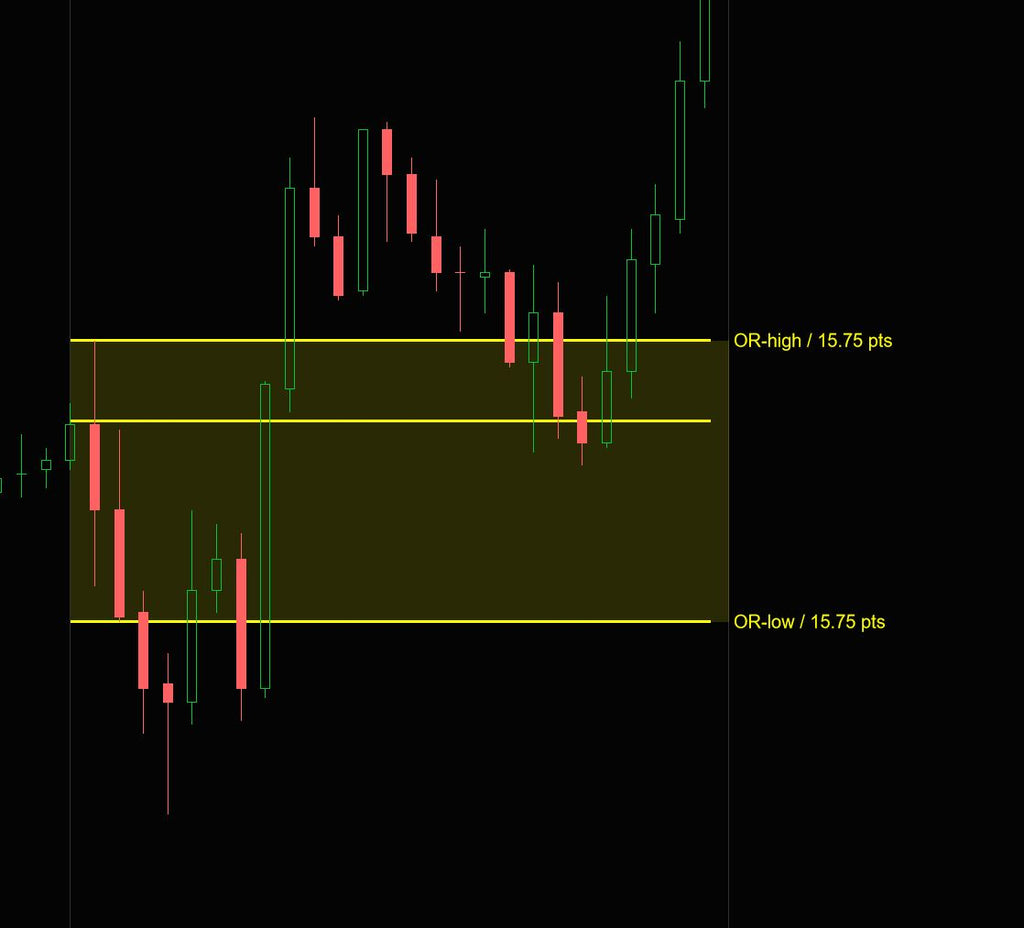
The opening range and initial balance are defined as the price range the market creates in the first 30 min and the first hour after the session open. These ranges are very important in the market and are used by traders to spot potential turning points and support and resistance levels.
Click here to read more about the initial balance and opening range indicator
3.4 News Indicator($149)

Whether you are a fundamental or technical trader news events are always important. During news events, we often see huge volatility in price. With the TDU News Indicator, you won't make the mistake of accidentally opening or being in a trade when an important news event is incoming. All news is shown in a clearly condensed table and also as vertical lines on your chart. You can choose to hide low and/or medium impact news and even filter out news events that are not important to your trading.
Click here to read more about the news indicator
3.5 Market extremes indicator ($235)

The Market extremes indicator will tell you when multiple exchanges (NYSE, Dow Jones, and Nasdaq) are overbought or oversold. When multiple markets are overbought/sold at the same time we have a very high chance of seeing a reversal or bigger retracements.
This indicator will show (and alert) you in real-time when 2 or more exchanges become overbought/sold. By combining the overbought/sold signal with other signals (e.g. RSI, MACD, or S&R levels) you get very high probability entries
Click here to read more about the market extremes indicator
3.6 Market internals indicator ($149)

The tick is used by many traders for timing their entries. TICK levels above 400 or below -400 are often a very clear indication for a (short term) reversal. Traders looking at placing a long trade will want to open their trade when the TICK is below -400 and traders looking to place a short trade will want to open their trade when the tick is above +400.
Click here to read more about the market internals indicator
3.7 Advanced toolbar ($249)
![]()

The TDU Toolbar is an advanced toolbar that not only contains all the default drawing tools but also adds some new custom drawing tools every trader needs.
Key features of the toolbar
- Custom ruler tool
- Custom risk/reward tool
- Auto range tool
- Custom Fibonacci tool
- Custom Fibonacci reversal tool
- Custom Fibonacci price projection tool
- Custom Fibonacci time projection tool
- Custom Fibonacci zigzag tool
- Volume profile tool
- Measured move tool
- Elliot Wave drawing tools
- Supply & Demand zones
- Gann Square
- Custom arrows
- Delete all drawings with a single click
Click here to read more about the advanced toolbar
3.8 Big round numbers indicator ($99)

Round numbers are price levels where the price ends with a round number. E.g. price level 15000 or price level 5000. These big round-number price levels are very important price levels in the market. Everyone major player in the market will be watching these important price levels. Since so many traders are watching these price levels we often see a nice reaction when the market (re)tests these price levels.
For example last week the NQ reached the 15000 price level, and as you can see in the following screenshot we saw a strong reaction from it. This behavior where price bounces of these major price levels can be seen time and time again
The round numbers indicator makes sure you never miss any of these important price levels. It will draw up the horizontal lines on your chart at the levels you want and in the color/styling, you like. It can even alert you when the price is hitting one of the price levels.
Click here to read more about the big fat round numbers indicator
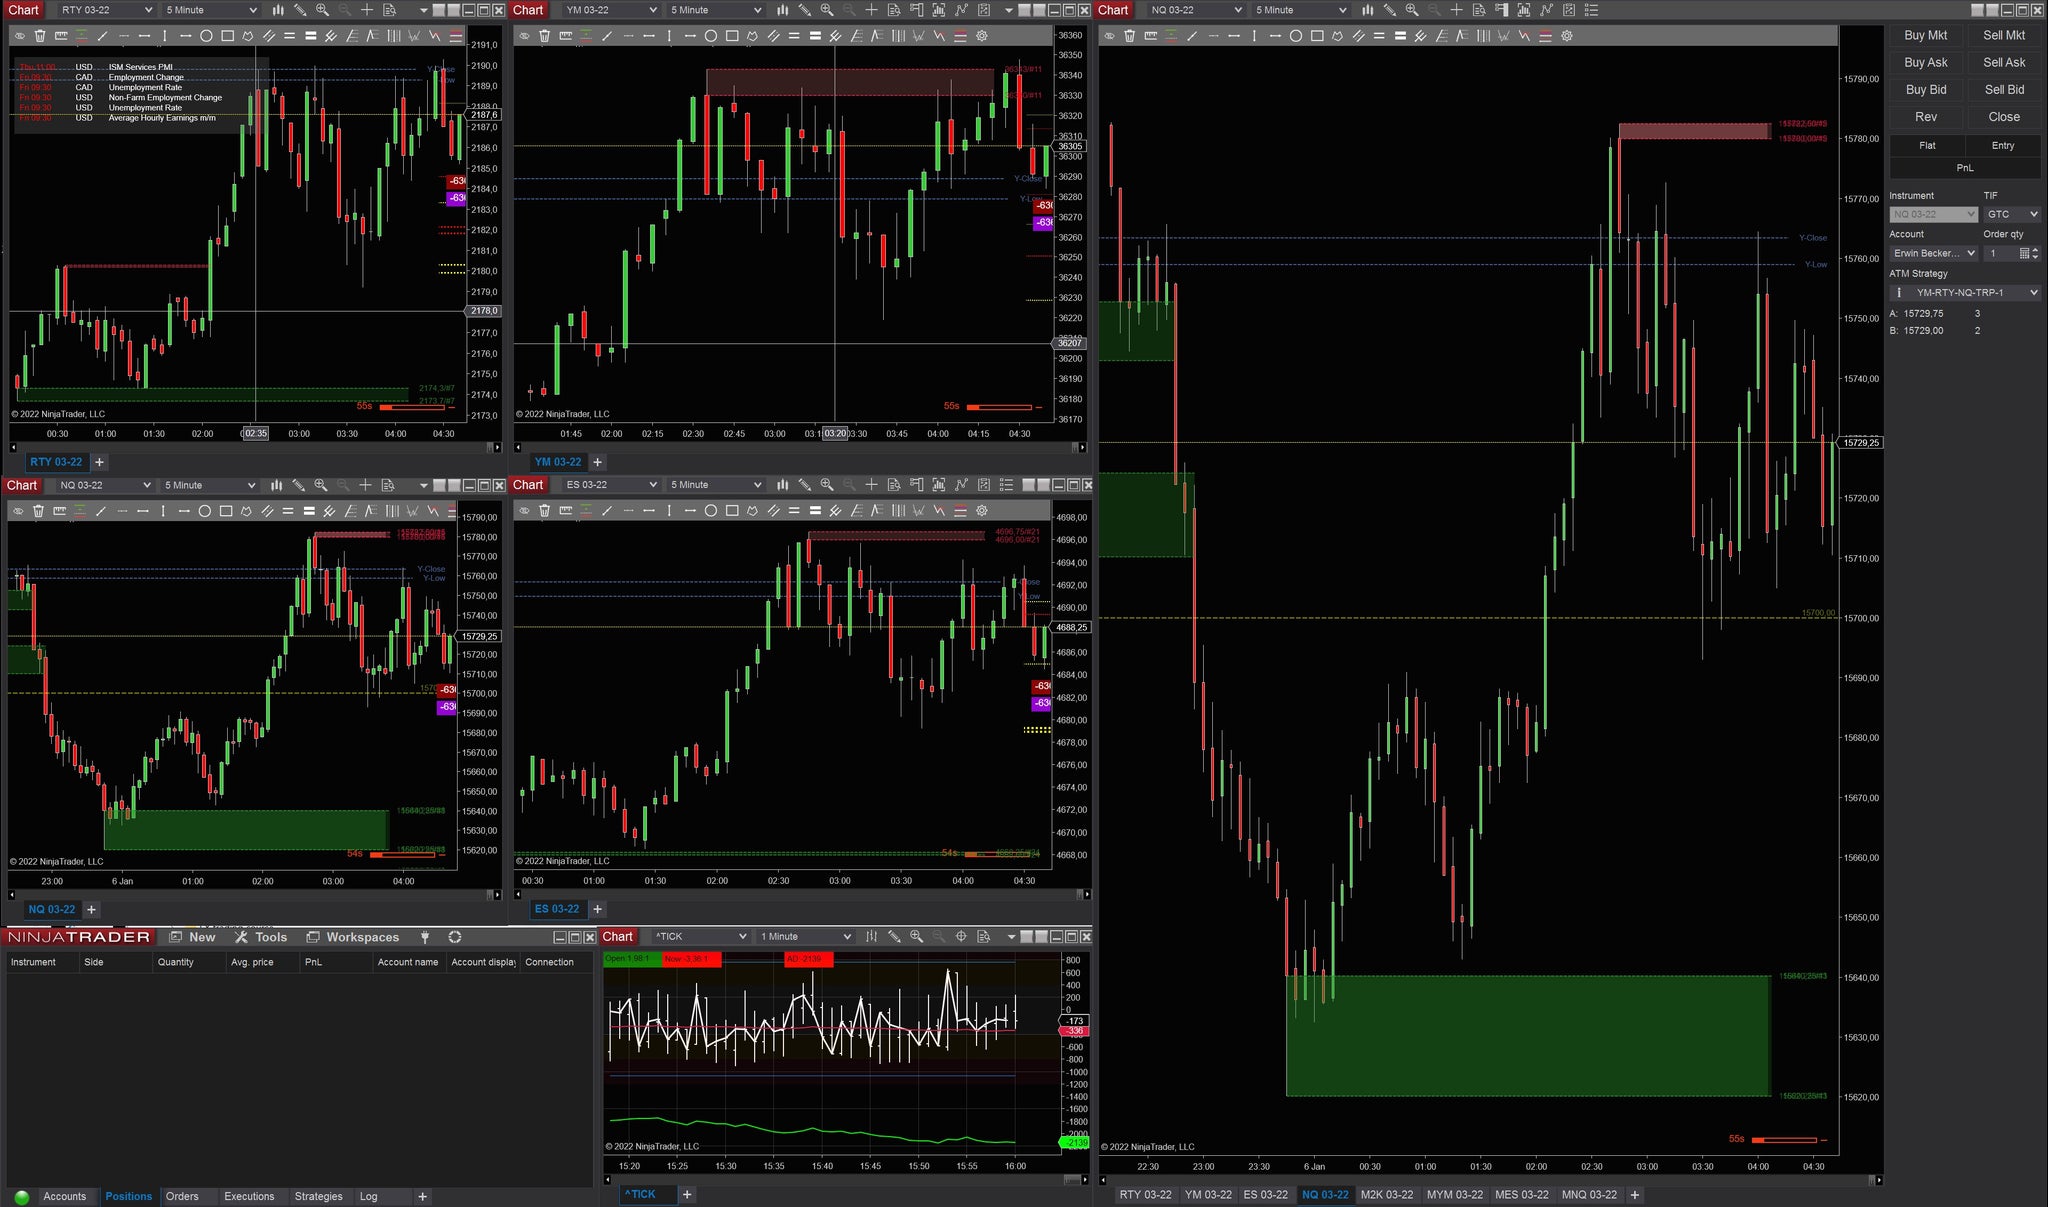
4. Features
- Complete trading package for trading the NQ, YM, ES, RTY
- Designed to help you pass funded trading tests
- Includes a video on how to set up your workspaces
- Includes a video about the 3 different trading setups
- Includes a video about entries& exits & example trades
- Includes chart templates & workspace
- Includes all indicators you need to become a profitable trader
- Proven profitable trading strategy
- Proof that we passed the Leeloo 50k and Leeloo 100k evaluation tests using this trading package
5. Changelog
5-Jan-2022 v1.0.0.0
- First released
7. Leeloo 50k evaluation test
Below are the trading statistics of our trades and which caused us to pass the LeeLoo 50K funded trading evaluation test on 19 Oct 2021 using this trading package & strategy


8. Leeloo 100k evaluation test
Below are the trading statistics of our trades and which caused us to pass the LeeLoo 100K funded trading evaluation test using this trading package & strategy


9. Training Videos:
9.1 Installation
9.2 The 3 different setups
9.3 How I passed the Leeloo 50k account
9.4 How I passed the Leeloo 100k test
9.5 Daily trade recaps