


Overview
The tick is used by many traders for timing their entries. TICK levels above 400 or below -400 are often a very clear indication for a (short term) reversal. Traders looking at placing a long trade will want to open their trade when the TICK is below -400 and traders looking to place a short trade will want to open their trade when the tick is above +400.
Another entry is when the TICK makes a new high or low for the day while simultaneously making a new high price or new low price of the day. This is often an indication that a trend reversal might happen and can be used as an early entry into the new trend.

NYSE Breadth and Advance/Decline chart

The Market internals consists of a separate 1-min TICK chart in which we can view the current TICK as well as the highest and lowest TICK of the session. The chart also shows the NYSE Breath at the open of the session. The current NYSE breath and the current Advance/decline value
- Shows current TICK
- Shows Highest/Lowest TICK of the day (so far)
- Shows NYSE Breath ratio at the open
- Shows current NYSE Breath ratio
- Shows current Advance-Decline line value
TICK in the background of your chart

The Tick Extreme indicator can display the current TICK value, in real-time, on any chart in the background as shown above. This way, no matter which chart you're looking at, you always know exactly what the current TICK value is
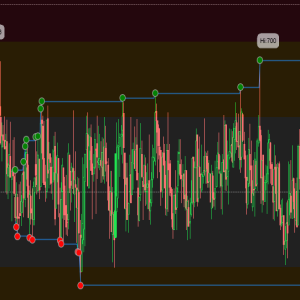
High/Low TICK of the day markers

The Tick Extreme marker also plots the highest and lowest TICK value of the day on the chart. High TICK at high prices or low TICK at low prices are often a point where the trend is likely to reverse as shown above.
ALERTS
The indicator can give alerts for High/Low ticks
Key Features
- Plots NYSE Breadth ratio from the open
- Plots current NYSE Breadth ratio
- Plots the Advance-Decline value
- Plots highest & lowest TICK of the day
- Plots High/low TICK alerts on the chart
- Plots Highest/lowest TICK markers on the chart
- Can plot all-new TICK extremes for the day, or only new TICK extremes at new price extremes
- Plots current TICK value as a background watermark on your chart
- Sound alerts when the TICK is above +400 or below -400
Changelog
12-dec-2021 v1.0.0.3
- added option to change session hi/lo dot colors
- fixed text when placing indicators on ^TQ
- fixed few bugs
13-03-2021 v1.0.0.2
- added option to show all new tick extremes or only new tick extremes at new extreme price
- added option to position the TICK in the background
12-03-2021 v1.0.0.1
- added Session high/low TICK markers on the chart
Disclaimer
Note that this indicator requires real-time ^TICK data. This is NOT included in your datafeed by default. Please consult your broker on how to get this. Without realtime ^TICK this indicator does not work!