

Key Features
A must have for all serious orderflow traders.
Our footprint indicator has all the features orderflow traders need.

Shows all the different imbalances
single, multiple, stacked, reverse, inverse, overzized, big and more

Shows all the delta signals and alerts
Divergence, Tails, Reverse, Surge, Flip, Above/Below POC and more

Table, Bid/Ask, delta styles
Fully customizable , create any possible layout you like

Session Volume Profile
Session volume profile with POC, Value area high and low

Bar POC and Value area
Shows up to 3 POC's and the value area for each bar

Bar statistics & Delta bars
Fully customizable bar statistics and Delta bars

Tick aggregation
Group multiple price levels into 1 print for high volatile instruments like NQ or crypto

Bloodhound & Strategy support
Plots for all the delta signals and important metrics
The best Footprint Indicator for NinjaTrader 8
All features
Our footprint indicator contains all the features you can think of. Imbalances, exhaustion prints, thin prints, delta signals, you name it. It has all of those and much more.
Fully customizable
You can fully customize the chart to your style of trading. Any color, font can be changed, any signal can be turned on/off and any setting can be adjusted

Best price
Let's be honest.. $399 is a steal for a footprint indicator like this. We see some competitors asking up to $5000 for something which is not even close to what we offer.
User friendly dropdown menu
This is seriously a time saver. How many times you go to the indicator settings to change a single thing and then need to wait before the chart has reloaded ? Not anymore.. with our dropdown menu you can turn anything on/off and the chart will update in real-time !!
Video Playlist
Below you will find a playlist of videos in which we explain all the features
Introduction
Delta Continuous POC
Delta SlingShot
Delta Sweep
Delta Trap
Delta Tail
Delta Drop
Delta Rise
Delta Flip
Delta Divergence
Configuration choices
Custom layouts
Trapped traders
Exhaustion Prints
Volume Sequencing
Volume Sweeps
Unfinished Business
Stopping volume
Zero Prints
Left / Right Cell Text options
You can select what you want to display for the numbers left & right of each candle .
By default we show the Bid/Ask numbers left & right of ach candle.
However you can choose between the following options for the left / right cell text
Left cell text options
Option | Description |
---|---|
None | Show nothing |
Bid | Show volume traded on the bid |
Bid/Ask | Show both bid & ask |
Volume | Show total volume traded on bid&ask |
Bid Delta | Show Horz delta (ask-bid) when bid outweighs the ask |
Total Delta | Show total horz delta (ask-bid) |
Delta/Volume % | Delta/Volume % |
Bid Diagonal Delta | Show Diag. delta when bid outweighs the ask |
Total Diagonal Delta | Show total diagonal delta |
Bid Trades | Show number of trades on the bid |
Total Trades | Show total number of trades on the bid |
Volume % | Percentage of Volume spend at the bid side price |
Right cell text options
Option | Description |
---|---|
None | Show nothing |
Ask | Show volume traded on the ask |
Bid/Ask | Show both bid & ask |
Volume | Show total volume traded on bid&ask |
Ask Delta | Show Horz delta (ask-bid) when ask outweighs the bid |
Total Delta | Show total horz delta (ask-bid) |
Delta/Volume % | Delta/Volume % |
Ask Diagonal Delta | Show Diag. delta when askoutweighs the bid |
Total Diagonal Delta | Show total diagonal delta |
Ask Trades | Show number of trades on the ask |
Total Trades | Show total number of trades on the bid |
Volume % | Percentage of Volume spend at the ask side price |

Bar alignment
The bar alignment allows you to choose how you want to align the candle + numbers inside the entire bar
This is very usefull if you are using only displaying text in the left or right cell and use the other cell to display a histogram in the background.
Center:
The candle + numbers + cell backgrounds get centered inside the entire bar.
Use this if you dont use any cell backgrounds, or when you use both left and right cell backgrounds
Left
The candle + numbers + cell backgrounds get left aligned inside the entire bar.
You might want to choose this when you are using a right cell background and no left cell background
Right
The candle + numbers + cell backgrounds get right aligned inside the entire bar.
You might want to choose this when you are using a left cell background and no right cell background
Aligned left

Aligned centered

Left / Right Cell Background options
Beside choosing what you want to show as the left/right cell text you can also select what you would like to see in the background of on the left and/or right of each candle . By default the background for the left/right cell is empty (None).
You can choose to show the volume, delta or Diagonal delta backgrounds in either the left and/or the right cell background
Left cell background options
Option | Description |
---|---|
None | Show nothing in left cell background |
Bid Volume | Show volume traded on the bid |
Total Volume | Show total volume |
Bid Delta | Show horz delta (ask-bid) when bid outweighs the ask |
Total Delta | Show total horz. delta |
Delta / Volume % | Show Delta/Volume% |
Bid Diagonal Delta | Show diagonal delta when bid outweighs the ask |
Total Diagonal Delta | Show total diagonal detla |
Bid Trades | Show trades traded on the bid |
Total Trades | Show total number of trades |
Right cell background options
Option | Description |
---|---|
None | Show nothing in right cell background |
Ask Volume | Show volume traded on the ask |
Total Volume | Show total volume |
Ask Delta | Show horz delta (ask-bid) when ask outweighs the bid |
Total Delta | Show total horz. delta |
Delta / Volume % | Show Delta/Volume% |
Ask Diagonal Delta | Show diagonal delta when ask outweighs the bid |
Total Diagonal Delta | Show total diagonal detla |
Ask Trades | Show trades traded on the ask |
Total Trades | Show total number of trades |
Left / Right Cell Background - Brick vs Histogram
You have the option to display the background of the left or right cell in either brick or histogram style. If you choose brick style, the background will cover the entire cell similar to the appearance of a brick. Conversely, if you select histogram style, the width of each price level will vary based on the chosen value, such as volume or delta. It's worth noting that you have complete freedom to customize the left cell separately from the right cell.
Brick
The entire cell background gets filled a color (which color gets determined by the options described below)
Histogram:
The background will show a histogram where the width of peach price level is based on the chosen value (see above)
E.g. if you have choosen volume then the histogram will show the volume traded at each price level
and if you have chosen horizontal delta.. then the histogram will show the horizontal delta for each price level
Brick Style background

Histogram Style background

Left / Right Cell Background - Scaling
The width and shade of the histogram are dependent on the selected scaling type. You have the option to choose between bar, chart, session, and all. If you select bar, the width and shade of the histogram will be solely based on the bar itself. However, if you choose chart, the width and shade will be based on all bars visible on the chart. In the case of session, the histogram's width and shade will be based on all bars in the current session thus far, and for all, it will be based on all loaded bars.
Bar:
The width of each price level of the histogram is based on the bar only.
Chart
The width of each price level of the histogram is based on all bars visible on your chart
Session:
The width of each price level of the histogram is based on all bars in the current session.
All
The width of each price level of the histogram is based on all bars loaded .
Scaling: Bar

Scaling: Chart

Scaling: Session

Left / Right Cell Background - Color Type
When selecting the cell background color, you can opt for a solid or gradient effect. If you choose a solid color, the background will be comprised of only two customizable colors. Conversely, if you choose a gradient, the cell background color will display a shade between the two customizable colors, with the degree of shading varying based on the value.
Solid colors

Gradient colors

Left / Right Cell Background - Color Source
The source of color determines the criteria for selecting which color to use. For instance, if the color source is set to delta, a negative delta value would result in the selection of the red color, while a positive delta value would result in the selection of blue. It's worth noting that the colors can be customized. In addition to delta, other options for color selection include trades, bid, ask, and neutral.
Delta:
The cell background color gets determined by the horizontal delta.
A positive delta will be colored with the positive color (here blue).
A negative horizontal delta will be colored with the negative color (here magenta)
Neutral:
The entire cell background will be displayed with the neutral color
Trades:
The cell background color gets determined by the number trades
When there are more trades on the ask than the offer then the cell background color will be shown in the positive color.
However if there where more trades on the bid than on the offer then the cell background will be colored with the negative color
Imbalances:
The cell background color gets determined by whether there is a buy or sell imbalance.
If there is a buy imbalance then the cell background color will be shown in the positive color.
If there is a sell imbalance then the cell background will be colored with the negative color
Color source: Delta

Color source: Neutral

Color source: Trades

Color source: Imbalances

Left / Right Cell Background - Color Direction
The color direction determines whether the cell will be shaded in a darker or lighter shade.
Opting for a Light->Dark direction will result in low values being colored with a lighter sjade and high values with a darker one.
Conversely, Dark->Light will color low values with a darker shade and high values with a lighter one
Light->Dark

Dark->Light

Left / Right Cell Background - Number of colors
The number of color options dictates the number of color shade variations displayed for each color (such as red or blue) when gradient colors are activated. A greater number of options corresponds to a higher number of shades shown
A lower number corresponds to less shades.
If you look carefully between these 2 screenshots you will see that the right image has more subtile shades then the left one
2 shades / color

10 shades/color

Entire bar background
Besides choosing a left/right cell background there is also an option to choose the background for the entire bar.
When enabled the background of the entire bar will be colored by the settings you choose.
You can base the bar background coloring on
- Total Volume
- Total Delta
- Delta / Volume %
- Total Diagonal Delta
- Total # of trades
And just like with the cell backgrounds you can choose the scaling, color type, color source, color direction, style and number of colors here too
On the right we see an example where the bar background displays the volume traded at that price level
Darker shades indicate higher volume was traded and lighter shades indicate lighter volume was traded at that price level
The bar background color (green/red) is based on delta. A green color is used to indicator positive delta and a red color for negative delta (of course these can be fully customized)
Finally we see that the right cell displays the horizontal delta as text and as histogram background
Here blue indicates positive delta and red indicates negative delta. Again you can customize everything to your liking

Tick aggregation
The tick aggregation option is a setting that determines how many price changes, or ticks, are grouped together to form a single data point. This setting is important because it affects the level of detail displayed
For example, if the tick aggregation is set to 1, each data point in the indicator represents a single tick at a specific price level. This provides a very detailed view of the trading activity but can also be overwhelming due to the large number of individual data points displayed.
On the other hand, if the tick aggregation is set to a higher number, such as 10, each data point represents the trading activity for a group of 10 ticks at a specific price level. This provides a less detailed view of the trading activity but can make it easier to identify patterns and trends in the data.
With tick aggregation (6 ticks) NQ-5min

Without tick aggregation NQ-5min


Show last traded tick
When enabled this will highlight the last price/tick traded on the current forming bar with a yellow background. It allows you to quickly spot where current price is.. You can of course change the color.
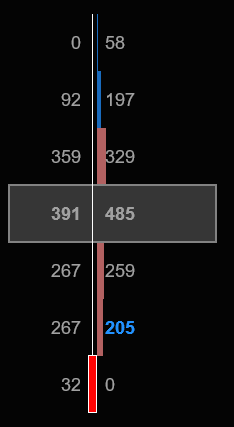
Point of Control and Value Area
The POC or point of control is the price level where most volume was traded within the bar. By default its highlighted by a grey background and a outline around the price level. The value area is where 70% of all volume was traded in the bar and by default its highlighted by a red background for red bars and green background for green bars


Up to 3 POC's
The indicator can show the top 3 POC's (Point of control) for each bar. These are the 3 levels were most most volume was traded. By default only 1 POC will be shown (the price level with the most traded volume in the bar) , but you can turn the other 2 on/off in the settings
Continuous POC's
A continuous POC happens when 2 or more candles both have their POC at exactly the same price level
This is an indication that the POC is a strong level and might act as a support & resistance level.
Continous POC's will be highlighted using a different color (yellow by
default). On the right you can see 2 bars with the same POC price


Bullish/Bearish POC
Each bar has a POC (Point of control) which is the price level where most volume in that bar was traded.
When markets are in a normal state we expect the POC to be in the middle of the bar. In up trending markets we expect them to be in the upper 3rd of the bar and in a bearish trend we want to see them in the bottom 3rd of the bar
An bullish or bearish POC is a POC that shows up at the extreme top or bottom of the bar. Its a good reversal signal which indicate that aggresive buyers/sellers stepped in and prevented the price from going lower ( or higher)
RULES:
- Green bar with POC in the lowest 3 price levels of the bar
- Red bar with POC in the upper 3 price levels of the bar
Value area
The value area is the area where 70% (can be changed) of the total volume of the bar was traded.
By default the value area for a bar will be green for an up candle and red for a down candle. But like everything else, you can fully customize all colors.
The value area can also be extended to the right for a fixed number or bars, until broken , or until tested


Engulfing Value area
An engulfing Value area appears when the value area of the current bar completely engulfs the value area of the previous bar.
On the left we see a green bar which value area gets completely engulfed by the next red bar's value area
You can assign separate colors to bullish & bearish engulfing value area's. In this example the engulfing area has a purple kind of color so its easy to recognize as an engulfing value area instead of a normal value area.
Abandoned Value area
An abanonded value area happens when price is abandoning and rejecting all the volume traded in the valuea area.
RULES:
Green bar with valuea area above the close
Red bar with a value area is below the close
When a value area is abandonded by price it will get a color opposite to the candle color.
For example, on the right we see a red bar which value area is completely below the close of the bar and in the lower wick of the candle. Price clearly rejected this value area and started trending upwards in the following bars
Although the candle is red, this is still a bullish event and that is why the value area is colored green (instead of red)

Value Area Color schemes, based on Candle Close or Candle color
The value area for a bar can use one of of the following color schemes.
- Candle color
The value area will be colored red for red bars and green for green bars,
-Candle close:
The value area will be colored based on whether the close of the candle lies inside or outside the value area.
If the close is inside the value area, the value area will be colored grey.
If the close is above the value area high it will be colored green, and if its below the value area low it will be colored red
Value area color based on Candle Close

Value area color based on Candle Color

Zero Prints
Zero prints occur when there is no volume at the bid on the low of the bar, or when there is no volume at the ask at the high of the bar
RULES
- no (0) volume at the bid at the low of the candle
- no (0) volume at the ask at the high of the candle
On the right we see an example of a bar which has no volume at the bid at the low of the bar which is a bullish sign


Thin Prints
Thin prints occur in the candle when there is aggresive seeling / buying with almost no counter-trading .
RULES
- Bearish : Aggresive sellers are selling the bid with almost no counter trading at the ask
- Bullish: Aggresive buyers are buying the ask with almost no counter trading at the bid
On the left you can see 2 bars. The first (green) bar has multiple thin prints on the bid colored in green, the 2nd (red) bar has a single thin print on the ask which is colored red since its a bearish sign
The default threshold level for the low volume is set to 1, but you can change this in the indicator settings to any value you like
Exhaustion prints
Exhaustion prints indicate weakness. In an up trend we would like to see a good amount of contracts traded at the high, while in a downtrend we would like to see a good amount of contracts traded at the low. If this is not the case and we see only a small amount of volume at the high in an uptrend, or at the low in a downtrend then this indicates weakness or exhaustion. The trend might come to an end or go into a consilidation area
RULES:
Bearish exhaustion prints:
- red candle with (almost) no volume at the ask at the high of the bar
Bullish exhaustion prints:
- green candle with (almost) no volume at the bid at the low of the bar
On the right we see price going sideways at a high printing several bars with bearish exhaustion prints. Then price suddenly drops
At the bottom again we see bearish exhaustion prints occur and 1 bar later the market reverses up again
By default the threshold for the exhaustion print is set to 10. So any cell at the high or low with a volume less of 10 will be marked as an exhaustion print.
Ofcourse you can customize the threshold, colors and you can even extend the threshold into the nex bars or until broken if you would like


Volume sequencing
Volume sequencing occurs when we have multiple price levels with increasing volume. When we see this we know the big guys are aggresively buying this market up (or selling it down)
Bullish volume sequencing is colored with a blue background and bearish volume sequencing with a magenta background. Ofcourse you can change these colors as you wish
RULES:
Bullish volume sequencing
- 5 or more price levels with increasing volume on the ask
Bearish volume sequencing
- 5 or more price levels with increasing volume on the bid
On the left we see a footprint chart in which 3 bars contain volume sequencing. A clear indication the trend is up
If we take at the first bar then we can see buyers pushed the market up from the low and bought it up with increasing volume (0, 17, 165, 181 ,573). Each price level has an increasing volume
volume sequencing can also be extended tot the right for a fixed number or bars, until broken , or until tested
Sweeps
Sweeps occur when aggresive buyers or sellers enter the market and aggresively start pushing price higher (or lower). These actions often leave small volume nodes behind which we can recognize with the sweeps
On the right we see a sweep through the bar with 4,0,0,0 volume at the ask
sweeps can also be extended tot the right for a fixed number or bars, until broken , or until tested


Unfinished business
An unfinished auction occurs when the high (or low) has both buy and sell volume. The presence of bid trades at the high (or ask trades at the low) of a bar could mean that movement has not yet been exhausted and there is a probability that price will return to that level soon to complete the process.
RULES:
- New high with numbers at bid AND ask at high of the bar
- New low with numbers at the bid AND ask at the low of the bar
Fading momentum
The fading momentum signal indicators that a trend or swing is weakening and likely to reverse or go into a consolidation phase
RULES:
Bearish:
-3 bars with positive delta , were the delta of each bar is lower then the previous bar
Bullish:
-3 bars with negative delta were the delta of each bar is higher then the previous bar
In the example on the right we can see 3 bars with negative delta going from -131 -> -52 -> -29. Clearly sellers are drying up and momentum is fading. When that happens we see the Fading momentum marker being drawn on the 3rd bar and the horizontal stripe being drawn by the indicator. After that bar the market rips higher.


Stopping Volume
Stopping volume occurs when a trend is exhausted and hits a brick wall of traders who are stopping the trend and pushing price in the other direction. We can detect this if the POC (and thus the most volume) is traded at the edge of the candle and the volume traded at the bid or ask is higher then the previous 10 candles
RULES:
- Green bar with POC at the low of the candle
- more volume traded at the bid at the lowest 2 price levels then in the last 10 candles
- Red bar with the POC at the high of the candle
- more volume traded at the ask of the highest 2 price levels then in the last 10 candles
Bar statistics
The indicator can display bar statistics above and below each candle. In the indicator settings, you can define what should be displayed in each row above and below the candle. You can show up to 4 different rows above the candle and 4 different rows below the candle

Bar statistics settings
The indicator can display bar statistics above and below each candle. In the indicator settings, you can define what should be displayed in each row above and below the candle.
You can show up to 4 different rows above the candle and up to 4 different rows below the candle
As explained in the custom color paragraph you can also define custom rules which can change the color of the volume, delta, and other statistics


Bar Ratio
The bar ratio is a number which can be found above a red bar or below a green bar.
A ratio between 0-0.7 indicates price defence or stopping volume
A ratio of 30 or higher indicate market exhaustion
RULES:
Bullish : ratio between the lowest 2 bids in the candle
Bearish : ratio between the highest 2 asks in the candle
On the left we see an example of a red bar with a ratio of 73. After the bar closed price dropped for 10 points
Bar Markers
The footprint indicator can show markers for each footprint signal above/below each bar. Bullish signals will be shown beneath the candle and Bearish signals will be shown above the candle

Bar marker settings
you can turn on/off any marker signal you like in either the indicator settings or via the dropdown menu.
On the right you can see the list of all the signals and the marker they will print on above/below the char, and the default symbols for them which you can change in the the indicator settings.
Bullish markers will be plotted under bar
Bearish markers will be plotted above the bar

Volume filter
Sometimes a footprint could be a bit overwhelming, especially if you are only interested what the BIG guys are doing. That is exactly why we developed the big trades/big orders filter. It filters out all the noise and only shows the biggest trades
By filtering out all the noise, the footprint chart becomes very easy to read. All the big trades become clearly visible so the BIG guys can't hide anymore
The filter will fiter our all price levels which have a bid or ask below the certain threshold. You can set the threshold to anything you like, depending on how much 'noise'you want to filter our.The exact value depends a bit on the market and timeframe you are looking at
As a guideine we would recommend to set the filter to a value so it shows 5-10 signals during a full trading day
For the ES 15 range chart that would be +/- 750
On the right you can see an example of an ES 15 range chart with the Big Trades/Big orders filter set to 750.
You can clearly spot these big orders. You can optionally extend them to the right since these big trades/orders often provide a pool of liquidity to form strong support/resistance levels


Volume display filter
With the volume display filter you can filter out any volume levels below a certain threshold. For example here we see 2 bars. The left bar is a normal bar without any volume display filtering. But on the right bar we set the volume display filter to 100. Any value below 100 will not be shown and filtered out
This is especially usefull when combining it with the volume filter mentioned above
Volume divider
Some markets like crypto may have very high numbers. To make these a bit more readable you can shorten the big numbers like we mention below. Another option is to divide the number by 10, 100 or more and this is what the volume divider allows you to do
- Divides volume by 1, 100 or 1000
- Choose between 0, 1 or 2 decimal places
Here we see an example of two bars. The left bar is without any volume dividing turned on. And the right bar uses a volume dividing of 10 so all numbers are divided by 10


Shorten big numbers
The indicator can optionally shorten big numbers to make the footprint chart more readable. This is very usefull since some assets like crypto show big numbers in the footprint chart. Same thing happens when you are looking at a higher timeframe.
With this feature turned on the indicator will print user friendly numbers like 10.2k or 8.1M instead of 10200 or 8100000
The big numbers will be shown in the bar statistics, the candle itself and ofcourse in the footprint summary table
Define your own dynamic color rules using c#
The indicator allows you to use C# script to define color coding rules. With these c# scripts you can create advanced rules which determine what forground and background color an item should have based on the rules you define.
You can define custom rules for:
- Bar statistics
- Vertical stripe
- Footprint summary table cells
For example lets say you want the volume displayed in the bar statistics to be the color Cyan when the volume is more then 10.000
You can do this using the following rule
if (Volume >= 10000) TextColor= "Cyan";
This simple rule will set the Text color to Cyan when the bar volume is equal or above 10.000
Let take it a bit further
if (Volume >= 10000) { TextColor= "Cyan"; BackgroundColor="White"; Opacity=30 }
This rule will still set the text color to cyan, but now it also sets the background color to a 30% white (which is more or less greyish)
Since the rules are just c# you can also use things like if, then, else, loops, Math.xxx() functions e.g.
if (Delta >= 1000) TextColor= "Cyan"; else if (Delta >= 0) TextColor = "ForestGreen"; else TextColor = "DarkRed";
This will set the Text color to cyan when Delta is equal or above 1000
If its below 1000 then it will set the textcolor to ForestGreen when the delta is above 0 and DarkRed when the dela is below 0
You have access to the complete c# language and the following variables
Properties of the current (forming) footprint bar
Volume - the total bar volume value
Delta - the bar delta value
MinDelta - the bar min delta value
MaxDelta - the bar max delta value
DeltaPercentage - the bar delta / volume% value
COTHigh - the bar COT High value
COTLow - the bar COT Low value
Open - the bar's open price
Close - the bar's close price
High - the bar high price
Low - the bar low price
CumulativeDelta - the cumulative delta value for the bar
CumulativeVolume - the cumulative volume for the bar
POC - the bar POC price
ValueAreaHigh - the bar Value Area High price
ValueAreaLow - the bar Value Area Low price
TotalAsks - the bar total ask volume
TotalBids - the bar total bid volume
Trades - the number of trades executed in the bar
IsGreenBar - true if the bar is a green candle, false otherwise
IsRedBar - true if the bar is a red candle, false otherwise
DeltaChange - the change in delta between the current and previous bar
DeltaChangePercentage - the change in delta between the current and previous bar expressed in %
DeltaRate - the rate of the delta
VolumePerSecond - volume / second
SellImbalances - List<double> Contains the prices in this bar where a sell imbalance occured
BuyImbalances - List<double> Contains the prices in this bar where a buy imbalance occured
StackedSellImbalances- List<double> Contains the prices in this bar where a stacked sell imbalance occured
StackedBuyImbalances- List<double> Contains the prices in this bar where a stacked buy imbalance
Bids - Dictionary<double,double > Contains the volume traded at each price level on the bid of the current bar
Asks - Dictionary<double,double > Contains the volume traded at each price level on the ask of the current bar
TradesBids - Dictionary<double,double > Contains the number of trades at each price level on the bid of the current bar
TradesAsk - Dictionary<double,double > Contains number of trades traded at each price level on the ask of the current bar
Other properties available:
Bars - List<FootPrintBar> - Array which contains all the footprint bars
CurrentBar - the current footprint bar number
Opacity - background color opacity (0-255)
BackgroundColor - name of the background color
TextColor - name for the text color
Bar statistics dynamic color rules
As stated above you can define your own custom rules / scripts for the bar statistics labels shown above & below the bar
On the right you can see the default rules.
If you leave one of the rules empty (like for example here the Trades colors is left empty) then the label will be shown with the default built-in colors


Vertical stripe dynamic color rules
You can also define up to 5 custom rules for rendering the vertical stripes (scroll down to read more about the vertical stripes)
For example on the left you can see a vertical stripe which gets rendered when the bar volume is > 1000 or when the delta /volume % is above 25
The rule itself is pretty simple
if (Math.Abs(DeltaPercentage) > 25 || Volume >= 10000) { Opacity=30; BackgroundColor= "Cyan"; }
You can define the vertical stripe rules in the indicator settings under section 12. Delta signals
Footprint summary dynamic color rules
Another place where you can define custom c# color rules is in the footprint summary table
(scroll down to read more about the footprint summary table)
Here you can use rules to define which cells should be highlighted and what colors it should have
For example on the right you can see that the MinDelta and MaxDelta will render with a white background when its value is <=1
The Delta% will be shown on a cyan background when the delta% is above 25:
And the volume is also rendered with a cyan background when the volume is > 10000
These are just the default rules, but you are free to customize them to your liking

Footprint summary table
The indicator can show a footprint summary table which shows all the important metrics for each candle
You can fully customize the look & feel of the table and which rows gets shown there


Customize what to show
The footprint table can show up to 10 rows. In the indicator settings you can fully customize what to show in each row
Note that you dont have to show all 10 rows. If you only like to to show 3 rows then you can simply disable the other 7 rows by setting it to none
Dynamic cell highlighting
As we shown above in the dynamic color rules using c# section you can define custom rules when a cell should be highlighted and what colors it should be shown

Custom cell highlighting rule examples
Here you will find some examples of how to use custom color rules to customize the footprint summary table to your own taste.
The examples below show the coding expression which you can fill in the indicator settings under footprint and then the correct custom color
Highlight Small MinDelta
This example will highlight the Min Delta with a white background color if its value is below 10
MinDelta custom color:
if (Math.Abs(MinDelta) < 10) BackgroundColor="White";
Highlight Small MaxDelta
This example will highlight the Max Delta with a white background color if its value is below 10
MaxDelta custom color:
if (Math.Abs(MaxDelta) < 10) BackgroundColor="White";
Highlight Delta Closing at MinDelta
This example will highlight the Min Delta with a Magenta background color if delta closes within 95% of the MinDelta
MinDelta custom color:
if (Delta < 0 && Math.Abs(Delta/MinDelta) >= 0.95) BackgroundColor="Magenta";
Highlight Delta Closing at MaxDelta
This example will highlight the Max Delta with a DodgerBlue background color if delta closes within 95% of the MaxDelta
MaxDelta custom color:
if (Delta > 0 && Math.Abs(Delta/MaxDelta) >= 0.95) BackgroundColor="DodgerBlue";
Highlight Extreme delta
This example will highlight the Delta with a cyan background color if delta is more then 1000, and Magenta if delta is less then -1000
Delta custom color:
if (Delta>1000) BackgroundColor="Cyan";
else if (Delta < -1000) BackgroundColor="Magenta";
Highlight High Delta Percentage
This example will highlight the DeltaPercentage with a cyan background color if delta percentage > 25%
DeltaPercentage custom color:
if (DeltaPercentage > 25) BackgroundColor="Cyan";
Highlight High Volume
This example will highlight the volume with a cyan background color if volume > 10000
Volume custom color:
if (Volume > 10000) BackgroundColor="Cyan";
Highlight Ratio colors
This example will show a green text color if the Ratio is < 1 and its a green bar, or a red text color if the Ratio is > 28 with a red bar
Ratio custom color:
if (IsGreenBar && Ratio < 1) TextColor="Lime";
else if (IsRedBar && Ratio > 28 ) TextColor="Red";
Delta Imbalances
The footprint order flow indicator can show
- normal imbalances
- multiple imbalances
-2nd slot imbalances
- oversized imbalances
- big imbalances
- stacked imbalances
- inverse imbalances
- reversal imbalances

Single imbalances
The indicator will highlight single delta imbalances at each price level. An imbalance occurs when the ratio between the bid/ask is more than a predefined percentage.
By default, the indicator uses a ratio of 400% which is the industry standard but this can be changed.
You can also change the minimum volume threshold for an imbalance. By default the minium volume for the imbalances is set to 1. This prevents imbalances to be shown when one of the two number (bid/ask) is a 0
So when the ratio between the bid and ask is 400% or more and both bid & ask show a 1 or more then indicator will highlight this with a red text color for the bids or blue text color for the asks.
In the screenshot left you can see sell imbalances of 611 / 203 and 107/19
and bullish imbalances of 137/42 and 168/47
Multiple imbalances
The indicator will plot a green or red border around the entire bar when the bar contains 3 or more imbalances on the ask and/or bid side.
As seen in the screenshot on the right we have 3 ask imbalances. Therefore the entire bar is surrounded by a green border.
If we would have 3 or more imbalances on the bid side then the bar would be surrounded by a red rectangle.


Oversized imbalances
The indicator can also highlight oversized imbalances. An oversized imbalance is when the ratio between the bid and ask is 1000% or more.
Again you can change this value but 1000% is more or less the industry standard. When the ratio between the bid and the ask is 1000% or more then the indicator will highlight this with both a red text color AND border for the bids, or a blue text AND border for the asks
In
On the left we see an oversized imbalance of 66/1 on the bid colored by a red text and red outline
Stacked imbalances
Stacked imbalances occur when we have 3 (or more), (this minimum can be changed in the settings) imbalances stacked on top of each other.
Again this can happen on the bid and/or the ask side
When a stacked imbalance is detected we will highlight this by coloring the background
As with all imbalances you can optionally extend them for a fixed number of bars, until tested or until broken
On the right we see that the first bar has 3 imbalances on the ask at the top. A green zone will be drawn from that point until the zone is broken or tested


Inverse imbalances
Inverse imbalances are indications of trapped traders. They occur when there are multiple buy imbalances at the top of a red bar, (or multiple sell imbalances at the bottom of a green bar).
These imbalances mean traders went a long (or short) trying to trade a breakout but prices reversed on them and now these traders are trapped in a losing position.
RULES
- red bar with multiple buy imbalances at the top of the bar
- green bar with multiple sell imbalances at the bottom of the bar
On the left you see an example where price breaks out from a consolidation area. Traders go short , trying to trade the breakout, but then the price reverses up again.
The traders who got short got trapped and are now in a losing position
As with all imbalances you can optionally extend them for a fixed number of bars, until tested or until broken
Big imbalances
The indicator can highlight big imbalances with a yellow outline around the imbalance. You can specify the minimum volume difference needed to determine a big imbalance.
For ES this would be around 1300.
Of course, you can define the level (1300 by default), and you should adjust this for the markets you are trading. Big imbalance levels should not appear often. They should occur 1-2 a day. So if you see many imbalances with yellow outlines on your chart then you will need to increase the big imbalance level for your markets.
In the screenshot, you see a big imbalance highlighted by the red text and yellow outline. As you can see 3914 contracts were traded on the bid side, and just 1139 contracts on the ask side.


Second-slot delta imbalance
A second-slot imbalance signal means buyers or sellers have failed to push the market higher or lower. On the chart, this indicated by a diamond
The rules for a 2nd-slot imbalance are
- A green candle and an imbalance on the 2nd row from the bottom of the bid
- A red candle and an imbalance on the 2nd row from the top on the ask
The idea is that buyers spent a lot of volume trying to move the market up, but in the end, the candle closed lower. Since buyers failed to push it up further and the candle closed lower price is likely to continue downwards. See screenshot to the left
Reverse Imbalances
A reverse imbalance is a candle were we see buy/sell imbalances at the edges of the bar and price closing in the opposite direction. This often indicates a posibility for a pullback/reversal
RULES:
Bullish:
- green bar with a sell imbalance at one of the lower 2 price levels
Bearish:
- red bar with a buy imbalance at one of the upper 2 price levels
On the right we see an example of a green candle with a -60 sell imbalance t the bottom of the bar

Delta Signals
The footprint order flow indicator can show several delta signals like
- Above / below POC signal
- Delta Rise
- Delta Drop
- Delta Tail
- Delta Reversal
- Delta Divergence
-Delta flip
- Delta Trap
- Delta Continous POC
- Delta Sweep
- Trapped Traders

Above / Below POC signals
The Above/below POC signals are very powerful signals when they occur at new swing lows or swing hi's. They indicate the market reached a top (or bottom) and is ready to reverse. The signal is shown on the chart with a red triangle above or green triangle below the candle
Rules:
-A green bar that opens & closes above the POC at a swing low
- a red bar that opens & closes below the POC at a swing hi
Delta Rise signal (S)
The delta rise signal is a 4-bar signal and is indicated with the letter 'S' and/or a magenta vertical stripe. The signal happens when there is a sudden increase in the delta and when the delta is getting stronger and stronger. This is often a tell that buyers (or sellers) are in control and the market is/might be starting to trend.
RULES:
-4 consecutive bars with increasing delta
EXAMPLE:
Here you can see an example of a delta rise signal. The first bar has a negative delta of -461, then in the next bars we see the delta increase to positive 119->429->620
So in 4 bars, we went from -461to +620 where each bar is getting a higher positive delta. When that happens the delta rise signal will be plotted


Delta Divergence signal (D)
The delta divergence is a trend reversal signal. Only look for these signals when they occur at (or near) a swing high/low. The Delta divergence is plotted in the footprint table with the letter 'D' and a blue vertical stripe.
RULES:
- Price makes a new low with a green candle and positive delta
- Price makes a new high with a red candle and negative delta.
You can choose between two different modes to detect new highs or lows:
Session or Candle mode
This setting lets you change how a new high or low is detected
Session:
- A new high/low is formed when price breaks the high /low of the day
Candle:
- a new high/low is formed when price breaks the previous bar low/hi price.
EXAMPLE
In the screenshot on the left we can see the trend going up and making a new high.. then just after making a new high, we get a red candle with a bearish delta divergence signal and then the trend reverses and goes down
Delta Flip signal (F)
The Delta flip signal is a 2-bar signal. It triggers when there is a sudden shift in Delta from positive <-> negative and indicates a potential reversal. Again look for these signals at important places like swing lows/hi's. The delta flip is shown in the footprint chart with the letter 'F' and a yellow vertical stripe
RULES
-The first bar closes on its min-delta and has a max-delta around 0.
-The next bar closes on its max-delta and has a min-delta around 0
Or
- the first bar closes on its max-delta and has a min-delta around 0.
-The next bar closes on its min-delta and has a max-delta around 0


Delta Tail signal (T)
A delta tail signal occurs when a bar has a negative delta at all price levels except the bottom of the bar and vice versa. It is plotted on the footprint table with the letter 'T' and an orang vertical stripe
RULES
-The bar has a negative delta at all prices except the top or
The bar has a positive delta at all price levels except the bottom
EXAMPLE
On the left you see a bar that has a negative delta at all price levels except at the top.
Delta Reversal signal (R)
The Delta Reversal signal gets plotted when a bar has an above-average max and min delta. It is plotted with the letter 'R' and a light salmon vertical stripe
RULES
- The bar has above-average max and min delta
EXAMPLE
On the right we see that the second bar has a high max and high min delta, and prices reverse.


Delta Drop signal (O)
The delta drop signal is a 4-bar signal and is indicated with the letter 'O' and/or a red vertical stripe. The signal happens when there is a sudden decrease in the delta and when the delta is getting weaker and weaker . This is often a tell that the current trend might be ending and we will go into a consolidation or reversal.
RULES:
-4 consecutive bars with decreasing delta
EXAMPLE:
Here you can see an example of a delta surge signal. The first bar has a delta of 596, then in the next bars we see the delta decrease to 13, -109 , -130 So in 4 bars, we went from +596 to -130 where each bar is getting a lower delta. When that happens the delta drop signal will be plotted
Delta trap signal(A)
The delta trap signal is a 3-bar signal.. It tries to identify trapped traders in a strong up/down trend
RULES:
In a downtrend
- a green bar with strong positive delta
- followed by 2 red bars with negative delta which together cancel out the positive delta from the green candle
- last red bar has a value area gap down
In an uptrend:
- red bar with strong negative delta
- followed by 2 green bars with positive delta which together cancel out the negative delta from the red candle
- last green bar has a value area gap up
EXAMPLE:
Here you can see an example of a uptrend.. When price pulls back some traders went short thinking the the trend switched bearish. Immediately after we see strong buying coming in again with the Delta Trap signal


Delta Continuous POC signal(C)
Uses a continuous POC as a possible trend continuation signal
RULES:
In a downtrend
- a green bar
- followed by a red bar which has the same POC price as the previous bar and negative delta
- followed by a red bar with negative delta and a value area gap
At least one of the 2 red bars needs to have strong negative delta
In an uptrend:
-a red bar
- followed by a green bar which has the same POC price as the previous bar and positive delta
- followed by a green bar with positive delta and a value area gap up
At least one of the last 2 green bars should have strong positive delta
EXAMPLE:
Here you can see an example where price printed a delta continuous POC signal. You can clearly see th continuous POC as its highlighted by the horizontal yellow rectangle. Immediately after this we see another green candle which has strong positive delta. The close of that bar confirms the signal to go long
Delta Sweep signal(W)
Indicates when a big trader enters the market to push the market forward
RULES:
For shorts
- a red bar which contains a market sweep and has strong negative delta
For longs:
- a green bar which contains a market sweep and has strong positive delta
EXAMPLE:
In the example we see market making a bottom and then a green candle gets formed with strong 1220 positive delta and a market sweep. The Delta sweep signal gets highlighted here in the background by a purple vertical stripe. You can customize the colors


Trapped Traders Signal (P)
The concept of "trapped traders" refers to those market participants who find themselves in unfavorable positions due to incorrect predictions about market movements. For instance, consider the situation on the left where a significant amount of selling activity occurs at the lowest point of a price bar, but subsequently, the bar closes green. In this case, the traders who sold at the lowest point are considered "trapped" in a short position, as the market is moving against their expectations.
To mitigate their losses, these trapped traders will need to close their short positions by placing buy orders.
This influx of buy orders can contribute to the existing upward momentum in the market, further intensifying the price increase. In summary, trapped traders are market participants who, due to their incorrect predictions, inadvertently contribute to the continuation of a price trend in the opposite direction of their initial positions.
RULES:
- A green bar in which most volume was traded in the bottom part of the candle
- A red bar in which most volume was traded at the top of the candle
EXAMPLE:
Here you can see an example where some traders got trapped into a short. (Green bar with most volume traded at the bottom)
Delta Slingshot signal(I)
Indicates a possible trend reversal when selling volume gets overrun by buying volume and market closing higher
RULES:
For shorts
- a red bar with extreme negative delta
- followed by a green bar which closes above the red bar with positive extreme delta
For longs:
- a green bar with extreme positive delta
- followed by a red bar which closes below the green bar with negative extreme delta
EXAMPLE:
In the example we see a red bar with -1321 delta
Then after a consilidation bar the next bar closes above the red bar with with +1669 delt

Delta Signal Vertical Stripes
As shown before you can have multiple ways to show the delta signals. You can show them as bar markers, you can show them in the footprint summary table , but we also give you the option to show a vertical stripe when a delta signal occurs.
The vertical stripes are very easy to recognize and make sure you never miss any delta signal.
Also note that you can define your own dynamic rule in c# to determine when a vertical stripe is shown.
Scroll up to read more about the dynamic color rules using c#

Delta Signal Stripe Settings
You can enable/disable which stripes you want to see in the indicator settings, and from our easy to use dropdown menu
Next you can assign a custom color to each vertical stripe


5 Custom Dynamic vertical stripes
You can also define up to 5 custom rules for rendering the vertical stripes
For example on the left you can see a vertical stripe which gets rendered when the bar volume is > 1000 or the delta /volume % is above 25
The rule itself is pretty simple
if (Math.Abs(DeltaPercentage) > 25 || Volume >= 10000) { Opacity=30; BackgroundColor= "Cyan"; }
You can define the vertical stripe rules in the indicator settings under section 12. Delta signals
Custom Dynamic vertical stripes examples
Below youwill find a few examples of custom vertical stripes. Please use those as a base for creating your own custom vertical stripes
Show vertical stripe when Volume of currentbar is more then 10000
if (| Volume >= 10000) { Opacity=30; BackgroundColor= "Cyan"; }
Show vertical stripe when Delta of the current bar is more then 2x the delta of the previous bar
if (Math.Abs(Bars[CurrentBar].Delta) > 2* Math.Abs(Bars[CurrentBar-1].Delta ){ Opacity=30; BackgroundColor= "Cyan"; }
Show vertical stripe when we have a Red Bar with <-600 Delta or a green bar with delta > 600
if ( (IsRedBar && Delta < -600)|| (IsGreenBar && Delta > 600)) { Opacity=30; BackgroundColor= "Cyan"; BackgroundColor= "Cyan"; }
Show a vertical stripe when we have a red bar with a ratio>30 or a green bar with a ratio < 1
if ( (IsRedBar && Ratio > 30)|| (IsGreenBar && Ratio <1 && Ratio >0)) { Opacity=30; BackgroundColor= "Cyan"; BackgroundColor= "Cyan"; }
Show a vertical stripe if we have a red bar with Delta > 0 or a green bar with Delta < 0
if ( (IsRedBar && Delta > 0)|| (IsGreenBar && Delta < 0)) { Opacity=30; BackgroundColor= "Cyan"; BackgroundColor= "Cyan"; }
Show a vertical stripe when Delta is > 600 or < -600 and closes near or at the Min/Max Delta
if ((Delta < 0 && Math.Abs(Delta) >=600 && Math.Abs(Delta) >= Math.Abs(MinDelta) *0.95) || (Delta > 0 && Math.Abs(Delta) >=600 && Delta >= MaxDelta *0.95) ) { Opacity=30;BackgroundColor="Yellow"; }
Alerts
The footprint indicator is equipped with a highly adaptable alert system. It allows you to activate as many as 10 alerts and select the corresponding signal for each alert. For instance, you can configure alert #1 to trigger when an exhaustion print emerges, while alert #2 can be set to activate when a delta trap is detected. The choice is yours.
Additionally, each alert can have its unique sound, and you can easily enable everything from the indicator settings.

Delta bars
You can (optionally) show delta bars above the footprint summary table.
The delta bars give you a quick glance if there is a a sudden delta % increase or decrease by just looking at the height of the delta bars.
Beneath the delta bars you can also show optionally show the delta percentage, delta ,and volume


Delta bar settings
In the delta bar settings you can define the maximum height for the delta bars. If you find the current delta bars to high then just lower this number a bit, and if they are too small then just increase it a bit. The default value of 10 should be ok for most users and screen sizes
Next you can choose whether you want to show the delta percentage, delta and or volume below the delta bar
And finally you can change the colors of the delta bars
Session volume profile
When trading using a footprint chart, many traders prefer to monitor today's volume profile. Traders who utilize volume profile techniques are aware of the significance of observing the Value Area High & Low and the Point of Control (POC)
To cater to this, we have integrated a volume profile into the footprint indicator, which displays the volume profile of the entire session alongside the POC, Value Area low, and Value Area high.
Please note that this is a daily-session volume profile, which is based on the trading hours template chosen in NinjaTrader.
Please take a look at our advanced volume profile if you need addition features like low & high volume nodes, weekly or custom profiles, heatmaps, profile splitting etc.

Volume profile settings
In the volume profile settings you can define if you want to show the volume profile on the left or right (or not at all)
Next you can define how wide the volume profile should be. This is measured in % of your chart. so 10% means it will fill 10% of your chart
You can also change the Value Area which is 68% by default, but some people like to use 70% so you can change it
Finally you can change the colors for the Value Area, POC and VAL H/L lines

Easy access menu
We added a quick and easy dropdown menu which allows you to quickly turn things on or off.
No more going back into the indicator settings, changing a single setting and then waiting for the chart to re-load.
Just simply select what you want to show or hide and the chart will update instantly

Create your own orderflow based strategies using
Bloodhound , NinjaScript or Strategy Builder
The footprint indicator fully supports traders and programmers to creating their own personalized orderflow-based strategies.
With over 40 plots available for export and an advanced API, you can design intricate orderflow-based strategies to suit your specific requirements.
This tool is compatible with NinjaScript, Strategy builder, and Bloodhound, allowing you to construct your own strategies seamlessly.
To explore the various possibilities, click on the button below.
Change log
23 may 2023 v1.0.1.23/span>
- new: option to extend thin prints
- new: option to extend zero prints
- new: option to extend volume sequencing
- fixed:sometimes multiple FP dropdown menu buttons appeared in the chart menu
- fixed: last tick was always using black text color
- fixed: value are behind chart when using left/right cell background
- fixed: renamed volume profile text from VAL-L / VAL-H to VAL and VAH
- fixed: bloodhound support
10 may 2023 v1.0.1.22
- new: abandoned value areas
- new: up to 10 fully configurable alerts
- new: momenum POC
- new: added option to turn bar markers on/off
- new: added delta open/close above/below POC alert
- new: added delta slingshot bar marker,stripe,alert & plots
- new: added trapped traders bar marker,stripe,alert & plots
- new: option to turn on/off POC 1,2 or 3
- new: option to specify separate text color for POC 1,2,3
- new: option to show/hide bullish/bearish POC's
- new: option to set ticks offset for bullish/bearish POC's
- new: option to show/hide consecutive POC's
- new: option to extend bullish/bearish POC
- new: fading momentum signal
- new: stopping volume signal
- update: improved default settings
- update: included chart templates
- fixed: gradient colors to dark
- fixed: Delta / Volume always showed 0 in bar statistics
- fixed: Volume profile labels not visible when docked to right side of the chart
19-april-2023 v1.0.1.21
- new: Use Imbalances as color source for left/right cell background
- new: option to left/right/center bar
- new: option to show a vertical spacing for entire bar
- new: option to show histogram or brick for entire bar
- new: option to show a vertical spacing for left/right cell
- new: option to show legend of footprint summary table on left or right side
- new: Delta close at min delta plot & Delta close at max delta plot
- new: use footprint indicator from strategy builder
- new: option to set outline color for consecutive POC's
- new: indicator now works without tick replay (but is a little less accurate then with tick replay)
- new: full support for bloodhound (turn off tick replay)
- new: option to specify separate text colors for left/right cell
- new: option to specify separate background colors for left/right cell
- new: option to increase font size for left and/or right cell
- fixed bug: all custom stripes alerts used same sound file
- fixed bug: cell background not visible when value was 0 and using brick mode
- fixed bug: bullish exhaustion prints printed on both left/right cell side when extending 0 bars
- fixed bug: POC outlines not visible when using brick mode for cell background
1-april-2023 v1.0.1.20
- new: set bid/ask separator to x, | or space
- new: added volume % as cell text
- new: added volume % as bar background
- new: option to detect delta divergence by candle color vs delta
- fixed bug: bar background was only drawn on half the bar when cell text was set to bid/ask
- fixed bug: incorrect background color was used when using trades as color source
- fixed bug: cum. delta session start time
29-march-2023 v1.0.1.19
- new: auto font scaling
- new: option turn on/off multiple imbalances from dropdown menu
- new: option turn on/off oversized imbalances from dropdown menu
- new: option turn on/off big imbalances from dropdown menu
- new: option turn align cell text center or inner
- Small bug fixes
27-feb-2023 v1.0.1.16
- new: left/right cell background style (brick or histogram)
- new: left/right cell histogram color source (delta, volume, trades)
- new: left/right cell option to shade histograms from light->dark or dark->light
- new: bar background option to shade histograms from light->dark or dark->light
- new: bar background color source (delta, volume, trades)
- new: separate text color setting for the last traded tick
- new: footprint summary table: gradient color shading for cumulative delta & cumulative delta %
- new: stripe for bar close at min/max delta
- new: color direction for summary table
- new: color direction for volume in summary table
- new: Choose between horizontal or diagonal delta method for calculating imbalances
- fixed: footprint summary table cell boundaries when left cell or right cell is set to none
- fixed: center bar markers & statistics when left cell or right cell is set to none
- fixed: left/right cell histogram color was reversed when choosing totaldelta as background
- fixed: chart flickering
- fixed: custom stripe alerts not working
- fixed: delta change % in footprint table
- fixed: script error when indexing Bars[x]
- fixed: footprint chart not visible when turning off the summary table
- fixed: delta bars has a slight horizontal offset
27-jan-2023 v1.0.1.14
- fixed: chart flickering
26-jan-2023 v1.0.1.13
- new: added min. delta filter
- new: option to scale cell background based on all or session
- new: option to scale bar background based on all or session
- new: option to footprint summary table cell color scaling based on chart, all or session
- fixed: Bar background shading for instruments like CL
19-jan-2023 v1.0.1.11
- new: added auto font / text scaling
- new: option to use gradient or solid colors for the cell histogram background
- new: option to select None as left/right cell text, which turns it into a 'normal' candle chart, but with all the footprint signals, exhaustion prints, stack imbalances etc
- new: Show: Bid/Ask as right cell text
- new: added option to display the Delta Volume, Delta Volume % , Min Delta Volume and Max Delta Volume for both bar stats and footprint summary table
- new: custom color expression for Delta Rate
- new: custom color expression for Volume/Sec
- improved: Total Delta & Total Diagonal Delta histogram now use buy/sell colors
- improved: the width left/right histogram is now based on all visible bars instead of just current bar
- improved: you can now choose between gradient and solid colors for the footprint summary table
- fixed: delta sweep plot
- fixed: footprint chart disappearing after a while
- fixed: black background behind footprint summary table
- fixed: footprint chart does not hang anymore when entering invalid code for custom rules
7-jan-2023 v1.0.1.10
- new: you can now extend the VAL-H/VAL-L, POC of the volume profile to right edge of the chart
- new: custom marker symbols: You can now define your own bar markers for all signals
- new: you can now define separate colors for the bar statistics
- new: added Show Delta/Volume Percentage as cell text and/or cell histogram
- new: delta sweep signal & stripe & alert
- new: delta rate in bar statistics & footprint summary table
- new: volume per second in bar statistics & footprint summary table
- new: bar duration in bar statistics & footprint summary table
- new: you can now use the dropdown menu to define what you want to show in the footprint summary table
- new: you can now use the dropdown menu to define what you want to show in the bar statistics
- new: you can now define up to 5 different custom stripes & alerts
- new: the indicator now exposes the internal footprint bars so strategy builders can use them in their strategies
- new: you can now specify a different value area % for the bars and the volume profile
- new plot for market sweep count
- new plot for bar duration
- new plot for thin print count
- new plot for zero countv
- new plot for delta trap
- new plot for delta sweep
- new plot for continuous poc
- new: plot for ratio
- new: plot for delta rate
- new: plot for volume/sec
- new: plot for imbalance reversals
- new: plot for inverse imbalances
- improved : Made more properties available to use for custom colors
- improved : make FP candle little bit smaller
- cleaned up indicator settings
- fixed: custom stripe alert not working
- fixed: some instruments like GC printed an extra price level
29-dec-2022 v1.0.1.9
- new: delta trap signal
- new: delta continuous POC signal
- new: show bid+ask as left cell text and volume/trades/... as right cell text
- new: volume display filter
- new: volume divider + decimal places
- new: Delta Close at Min/Max Delta Marker
- new: Multiple Imbalances Marker
- new: show trades per price level as cell text
- new: added delta change and delta change % for bar statistics and footprint table
- new: volume sequencing plot (for bloodhound & strategies)
- new: trades plot(for bloodhound & strategies)
- new: bullish / bearish exhaustion print plots (for bloodhound & strategies)
- improved: custom color coding rules can now access previous bars
- improved: volume sequencing
18-dec-2022 v1.0.1.8
- cleaned up indicator settings
16-dec-2022 v1.0.1.7
- added cell background option and removed footprint styles
- added zero prints
- added sweeps
- added bar markers
- added engulfing value area
- added option to extend value area
- added option to extend until tested
- added y-offset for footprint table
- performance improvements
- fixed bug in delta calculation
- renamed prominent POC to continuous POC
9-dec-2022 v1.0.1.6
- added new Ratio metric for display in bar statistics or footprint table
- several bugfixes
7-dec-2022 v1.0.1.5
- added exhaustion prints
- added delta drop signal
- added color schemes for the value area (based on candle close or candle color)
- added volume sequencing
- added option to color the POC based on candle cl ose and/or close in upper/lower third of the bar
- added option to short big numbers
3-dec-2022 v1.0.1.4
- added option to set the bar width
- added option to program custom vertical stripe color
- added option to program the colors shown in the bar statistics
- added option to program while cells to highlight in the summary table
- added continuous POC's
- added big traders/order filter
- small UI improvements
25-nov-2022 v1.0.1.3
- added reversal imbalances / trapped traders
- paint bars now render bars on top, but behind the footprint summary
- added a separate setting to turn on/off Stacked Imbalances
- added option to place the volume profile on the left or right of the chart
- added COT High & COT Low
- added plotting the bar value area
- added option to show the last traded tick
- improved volume profile so it now shows it correctly for previous days
- added zero prints
- stacked imbalances will now stay on the chart until broken
- extreme colors are now also used in the bar statistics
- added option to specify what you want to show above & below each bar
- added option to set minimum volume needed for an imbalance
- improved performance of loading time
- small UI improvements
14-nov-2022 v1.0.1.2
- added session volume profile
- added new bullish signals: a green bar where the open + close of the candle are above POC
- added new bearish signals: a red bar where the open + close of the candle are below POC
- added option to specify a separate font for imbalances
- added new options to the dropdown menu
- added delta extreme
- added delta volume extreme
- added delta% extreme
- added small Min Delta / Max Delta
- grouping ticks for Instruments like NQ or crypto
09-nov-2022 v1.0.1.1
- added option to show vertical stripes for each delta signal, each which its own color
- added option to highlight cells in the footprint summary which have a high (used-defined) delta percentage
- added option to highlight cells in the footprint summary which have a high (used-defined) volume
- added alerts for all delta signals
06-nov-2022 v1.0.0.9
- added a setting to specify the min. of imbalances needed to trigger a 'multiple imbalances signal' which is displayed by the red/green border around the candle
01-nov-2022 v1.0.0.8
- added a setting to specify the min. of consecutive imbalances needed for a stack imbalance
- added 2nd slot imbalance plots for use in strategies
- added support for up/down tick volume and tick count
- added delta bars
- added dropdown menu for easy access to most common settings
15-Jan-2022 v1.0.0.7
- fixed bug where footprint was showing wrong bid/ask numbers
- some small cosmetic fixes
22-July-2021 v1.0.0.5
- fixed issue on GC which had bars containing only zeroes (0)
22-July-2021 v1.0.0.5
- added plots for all signals and values
- added support for bloodhound/blackbird
3-June-2021 v1.0.0.4
- changed delta signal diamonds to letters
- fixed small layout issues
3-June-2021 v1.0.0.3
- added option to highlight the largest 3 POC's
- fixed small layout issues
1-June-2021 v1.0.0.2
- added context menu
- fixed small layout issues
31-may-2021 v1.0.0.1
- improved default color scheme
- added more signals
- fixed small bugs and layout issues
27-may-2021 v1.0.0.0
- the first version is released
For traders, by traders
We are just like you. We like trading the markets every day.
And every day, the market teaches us something new. Besides this, we also get a lot of feedback from our customers. We take all this information and ideas to further continue to develop our indicators. And if you bought it before.. then ALL future updates will be free. How's that for a change ?
39 Updates
So far.. we added 39 new features since the first release in may 2021
5 star rating
We received a 5 star rating from our customers
350+ traders
Hundreds of traders are using our footprint indicator everyday
Join us on discord
Want to chat with us and other traders? Got questions on our indicators ? Or want to know more about our products? Then join us on discord for just $1 a year
