
Find The Market’S Magnets And Slippery Patches. Identify Where Price Will Stall And Where It Will Explode Before The Move Happens
You're Trading Price, But The Market Moves On Volume.
Most traders fail because they are blind to the actual mechanics of the market. They draw arbitrary support lines based on naked price wicks, completely ignoring where institutional capital was actually deployed.
You enter a trade at a perceived "key level." The market slices right through it as if it wasn't there. Why? Because price is just an advertisement. Volume is the actual transaction. Without volume data mapping the true historical distribution, you are trading in the dark, constantly falling victim to invisible liquidity vacuums.
The Volume Profile indicator is engineered specifically for this vulnerability. It exposes the exact price levels where heavy institutional trading occurs, rendering high-probability support and resistance zones directly on your chart. Not lagging averages. Not subjective drawings. The actual historical transaction weight, mathematically verified.
Every High Volume Node (HVN) and Point of Control (POC) acts as a magnetic force on the chart. What you see is verified market acceptance. No guessing where buyers stepped in, no hoping a moving average holds—just raw, undeniable transactional data.
You're Trading Illusions.
We Map The Invisible Liquidity.
Retail traders rely on empty price bars. Institutional algorithms rely on volume distribution. Stop trading blind and move to mathematical certainty.
Blind To The Order Flow
You base entries on naked price action, completely unaware if real institutional volume is backing the move or if it's a hollow retail push designed to trap you.
Getting Sliced In The Void
You buy a bounce at a previous low, only to watch price crash through instantly because you entered in a Low Volume Node (LVN)—a frictionless vacuum where no historical buyers exist to defend the level.
X-Ray Market Structure
Volume Profile maps the exact transactional weight at every price level. You see precisely where the market finds "Fair Value" and where aggressive participants take control, eliminating the guesswork.
See Where The Market Actually Trades.

Raw Output: Institutional Fair Value and Frictionless Nodes Exposed Live.
The Architecture Of The Indicator
Everything you need to automate your structural analysis, packed into one zero-lag C# tool.
Pinpoint Institutional Fair Value
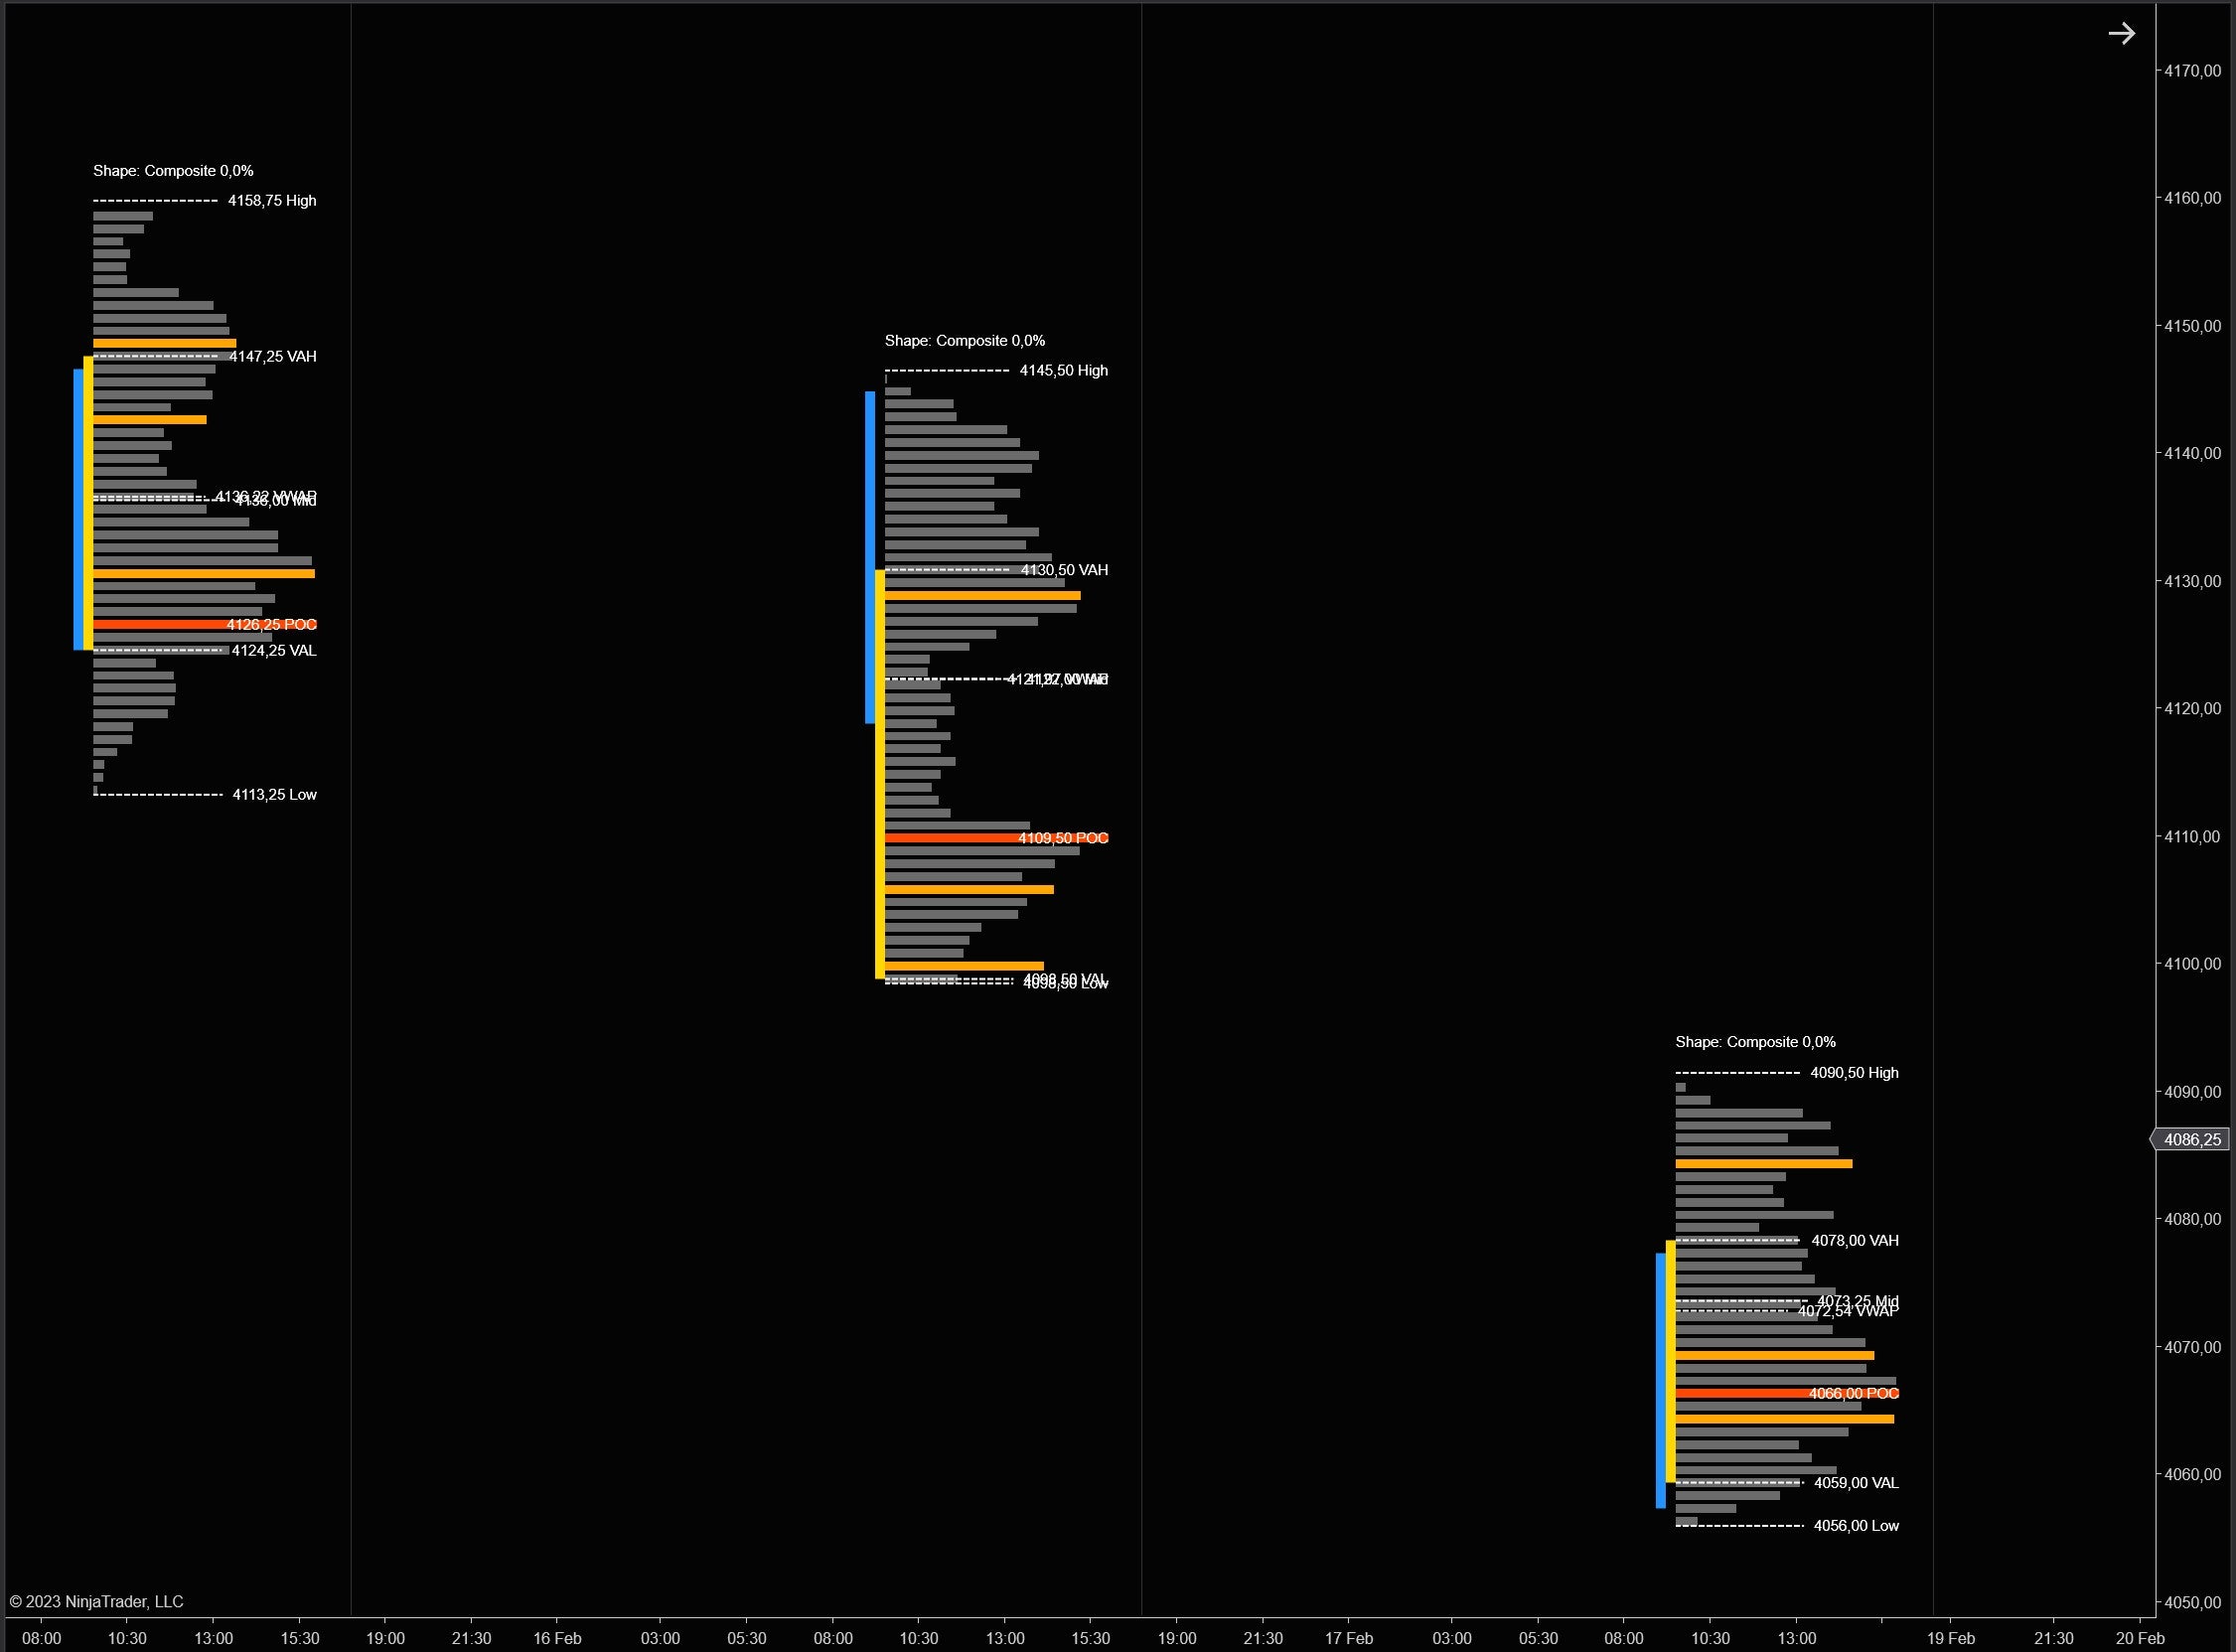
The indicator tracks the Point of Control (POC) and Value Areas (VAH/VAL) instantly, allowing you to identify exact fair value zones so that you stop buying at premium prices and trade alongside institutional capital.
Expose Buyer/Seller Dominance
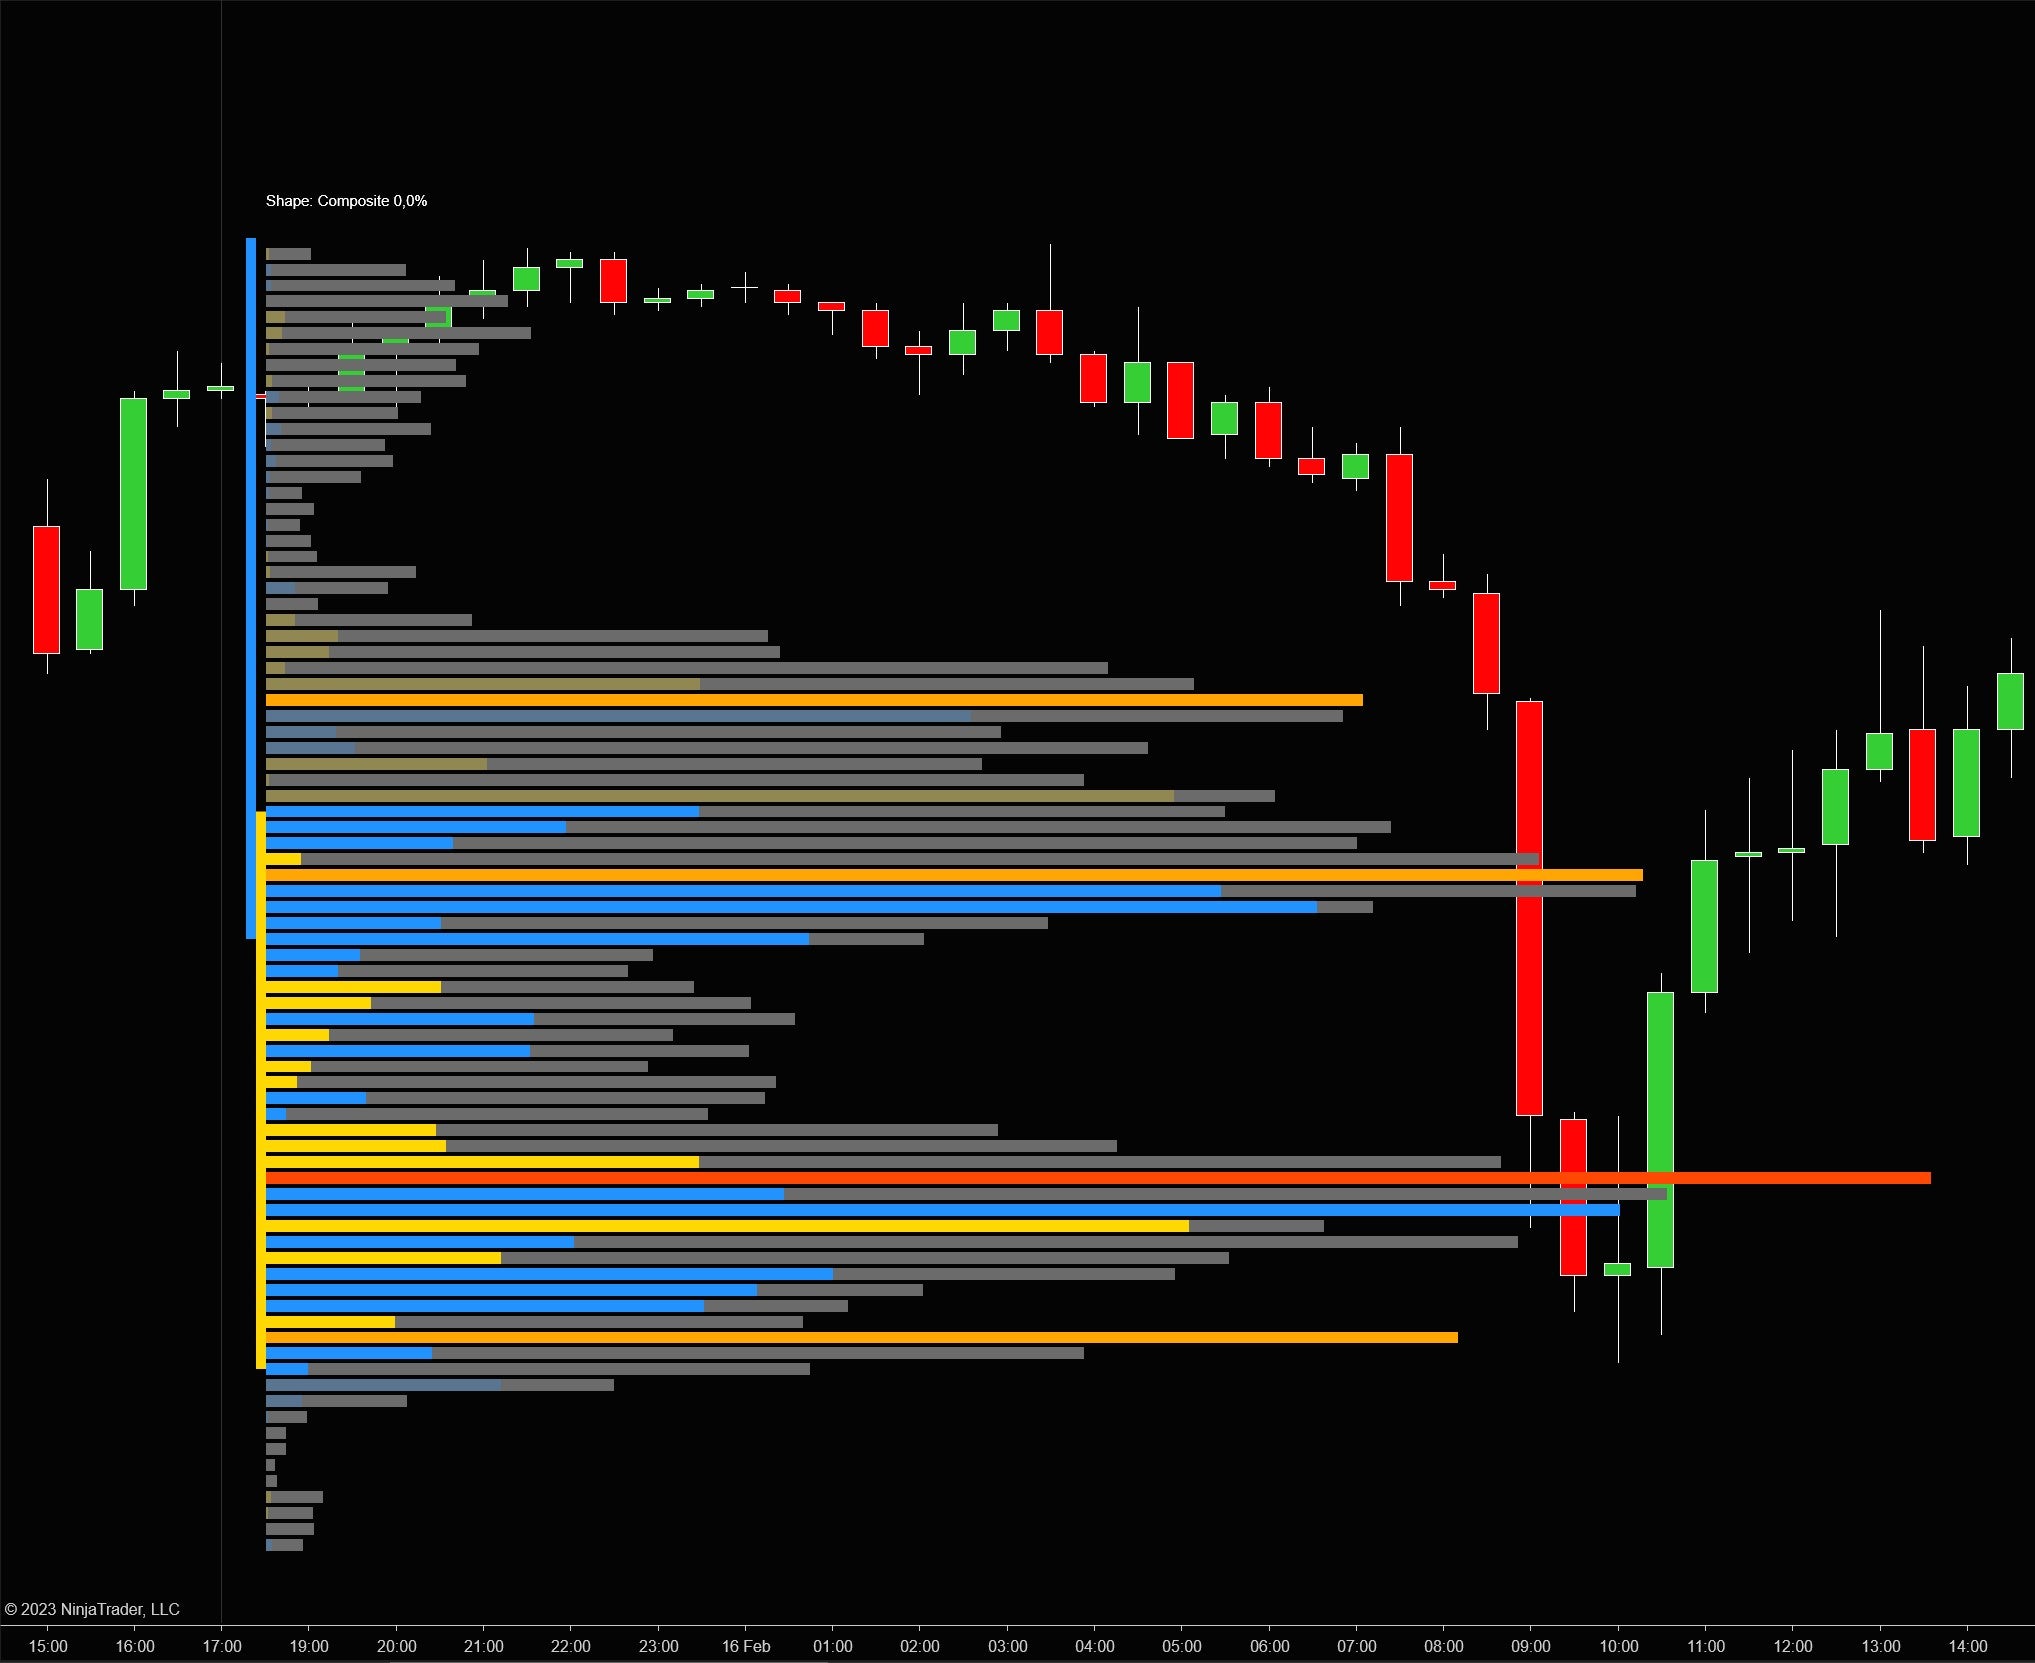
Use Delta color modes to dissect the volume of every single bar, allowing you to see whether aggressive buyers or sellers are winning the battle at specific levels, so that you never trade against dominant momentum.
Navigate Frictionless Zones
Automatically detect sticky High Volume Nodes (HVNs) and frictionless Low Volume Nodes (LVNs), allowing you to anticipate exactly where price will stall or accelerate rapidly, so that you can place pinpoint targets and perfectly protected stops.
Automate Your Edge
Export 28 real-time volume data points (current profile, previous profile, developing trace, and Initial Balance levels) directly into Bloodhound or custom NinjaScript strategies, allowing you to remove emotion completely and let your automated systems capitalize on volume imbalances 24/7.
Dictate Multi-Session Context.
Whether you trade the US open, the overnight session, or a full macro week, you must analyze the correct volume window. Generate 10 distinct profile types instantly, so you can predict where price will stall based on the exact timezone that matters to your strategy.
- Define up to 5 custom time windows (like the London or NY open).
- Analyze Daily, Weekly, Monthly, or strictly Visible Range data.
- Stop treating overnight volume the same as RTH core volume.
Demand Precision Filtering.
Markets change moods rapidly. A quiet morning can be obliterated by a news-driven afternoon, skewing standard volume profiles. The indicator automatically detects regime changes and splits the profile into sub-distributions, ensuring your Fair Value levels stay ruthlessly accurate during volatile, multi-phase days.
- Automatically separate daily volume into distinct trading regimes.
- Filter out structural noise using Tick Aggregation for readability.
- Ensure POCs and Value Areas adapt instantly to breaking news momentum.
Execute On Verified Delta.
Coloring isn't just for aesthetics—it's raw data. Switch between 5 dedicated coloring modes to split every volume bar into buyer vs seller initiation. This X-ray vision reveals the net strength of the market, letting you spot precisely where buyers are exhausted and sellers are mounting a violent takeover.
- Deploy 'Heatmap' mode to visually highlight intense trading zones.
- Use 'Delta' to read the net difference in aggressive market orders.
- Align your entries strictly with the dominant institutional force.
Capitalize On Historic Nodes.
Stop manually redrawing yesterday's levels. The indicator automatically projects the most critical historic levels (POC, VAH, VAL, Session Highs/Lows) forward into today's session, and dynamically removes them once price has tested the zone, leaving you with a perfectly clean, historically accurate roadmap.
- Never miss a bounce off a naked, untested Point of Control.
- Maintain chart hygiene by auto-deleting exhausted structural levels.
- Identify High Volume Nodes (speed bumps) vs Low Volume Nodes (vacuums).


Dominate With Instant Control.
In fast-moving markets, opening complex properties menus will cost you ticks and money. The integrated visual toolbar sits right on your chart, allowing you to instantly toggle levels, change delta colors, or switch profile regimes on the fly without breaking your execution flow.
- Modify every major analytical setting with a single click.
- Toggle TPO overlays instantly when deeper time-based analysis is needed.
- Keep your focus strictly on price action, not software menus.
One Indicator. Every Auction-Theory Tool. Half The Price.
Other vendors split features across half a dozen separate products, charge institutional prices, or force you off NinjaTrader entirely. This is everything the pros use, in one indicator — built for NT8, with day-type classification, naked POC tracking, IB extensions, and 28 NinjaScript plots that nobody else ships in a single SKU at this price.
| Feature | TDU Volume Profile | MZpackmzVolumeProfile | Acme / Rancho DineroVP Pack | ATASbuilt-in MP/TPO | DeepChartsDeep Profile | ninZa.coMarket Profile |
|---|---|---|---|---|---|---|
| Platform & Pricing | ||||||
| NinjaTrader 8 plugin | ✓ | ✓ | ✓ | — separate platform | — web / Win desktop | ✓ |
| Lifetime / one-off price | $399 | up to €369 | $59–$206 per product | €999–€1,999 | — subscription only | $192–$296 per product |
| Subscription price | $55 / mo | from €149 (6 mo) | — one-off only | €20–€90 / mo | $74–$99 / mo | — one-off only |
| Free trial | 7-day full | 14-day | demo only | free START tier | free signup | 15-day |
| Core Volume Profile | ||||||
| POC, VAH, VAL | ✓ | ✓ | ✓ | ✓ | ✓ POC | ✓ |
| VWAP overlay on profile | ✓ | ✓ + std-dev bands | ✓ | platform-level | multi-period | ✓ + TWAP |
| HVN / LVN auto-detection | ✓ | — | — | — | ✓ peaks & valleys | — |
| Buy/Sell volume split per level | ✓ | ✓ | ✓ | ✓ | ✓ | ✓ |
| Delta-colored profile mode | ✓ | ✓ | in some products | ✓ | ✓ | ✓ |
| Heatmap profile mode | ✓ | — | — | — | heatmap chart | — |
| Profile Modes / Periods | ||||||
| Daily / Weekly / Monthly sessions | ✓ | ✓ + Quarterly / Yearly | ✓ | ✓ | ? | ✓ Daily |
| Custom date-range composite | ✓ | ✓ | ✓ Composite | ✓ user range | ✓ Composite | ✓ Composite |
| Rolling N-day profile | ✓ NEW | via composite | via composite | ? | ? | via composite |
| Every-N-bars / fixed-interval | ✓ both | ✓ both | Intraday only | ? | — | ? |
| Visible-range profile | ✓ | ? | ? | ✓ | ✓ Visible | ✓ Flexible |
| Auction-Theory Tools | ||||||
| Naked POC tracking + display modes | ✓ All / Naked / Hide | ✓ naked levels | ✓ + naked VA | ? | ? | ? |
| Initial Balance auto-detection | ✓ | ✓ IB high/low | ✓ | ✓ dedicated | ? | ? |
| IB 1× / 2× / 3× extensions | ✓ visited-only | ? | ✓ auto extensions | ? | ? | ? |
| Single Prints detection | ✓ | ? | ✓ Session TPO | ✓ | ? | ? |
| Poor High / Poor Low detection | ✓ | ? | ✓ weak highs | ? | ? | ? |
| Day-Type classification (auto) | ✓ 7 types | — | — | — | — | — |
| Floating stats card per profile | ✓ NEW | — | VP Metrics product | — | — | — |
| Migrating POC step-line | ✓ NEW | — | VPOC extension | — | — | — |
| TPO & Structure | ||||||
| TPO overlay (separate POC + VA) | ✓ | ✓ VP over TPO | ✓ dedicated | ✓ classic TPO | ? | ✓ |
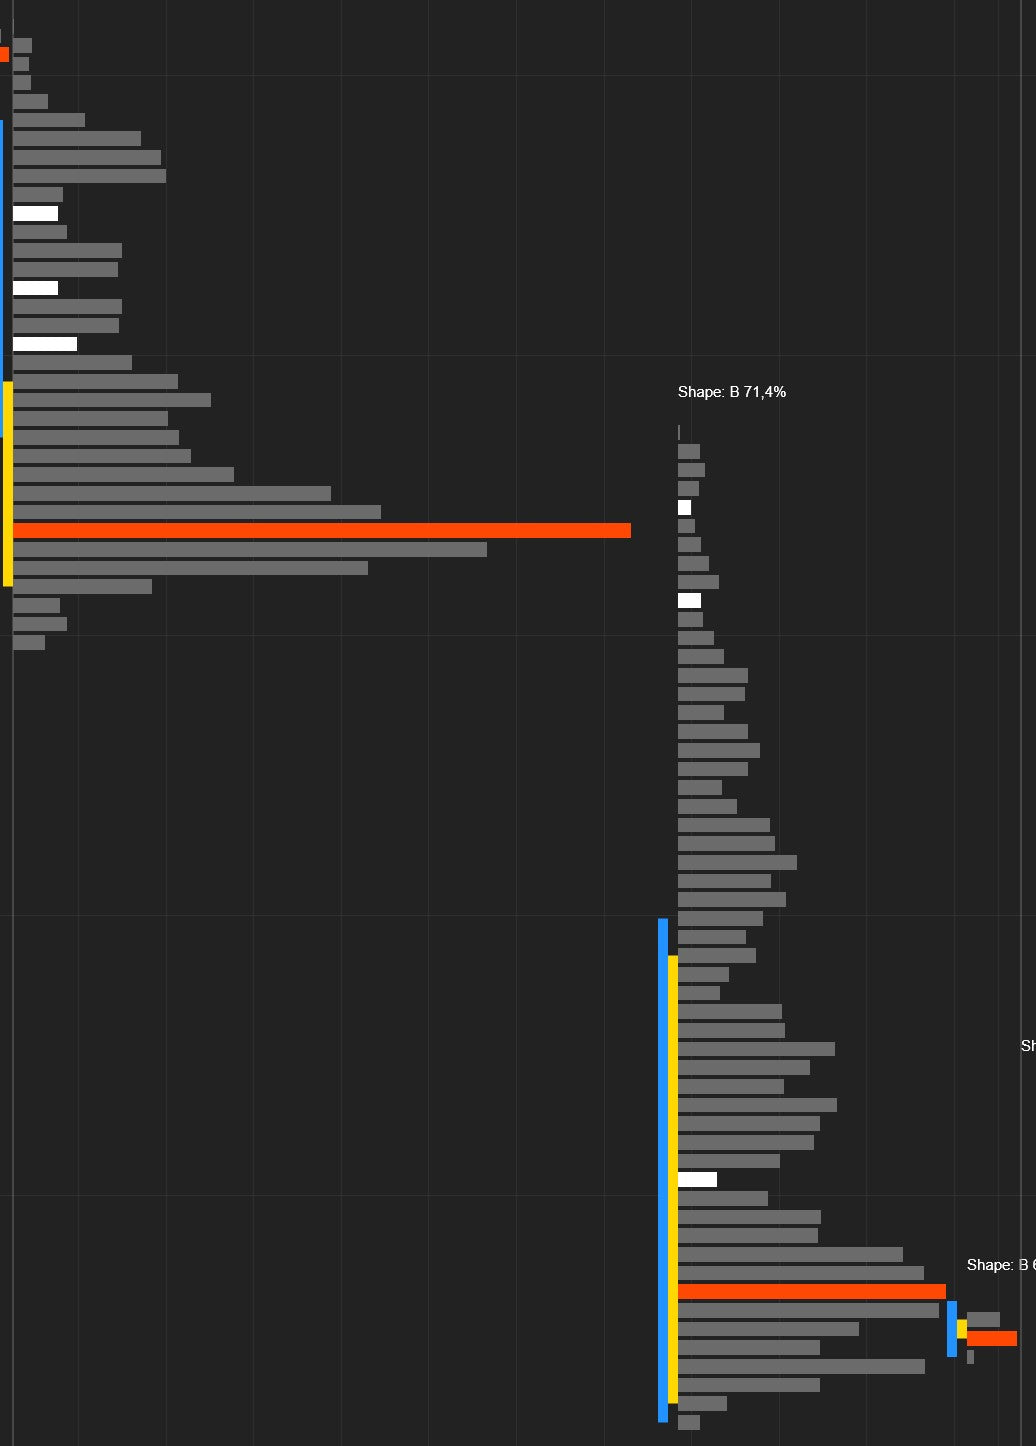
| Auto profile splitting (B/P/D shapes) | ✓ shape detect | ✓ split / merge | ✓ smart-split | ? | — | — |
| Profile smoothing (configurable period) | ✓ default 8 | ? | ? | ? | ? | ? |
| Smart line extension (Until Broken / Until Tested) | ✓ all 3 modes | ? | extension only | ? | ? | ? |
| Alerts & Automation | ||||||
| Audio alert: POC / VAH / VAL touch | ✓ all 3 | custom-level alerts | ✓ VPOC shifts | platform-level | ? | ? |
| Audio alert: HVN / LVN approach (ticks) | ✓ configurable | ? | ? | ? | ? | ? |
| Audio alert: Naked POC test | ✓ | ? | ? | ? | ? | ? |
| Audio alert: IB break | ✓ | ? | ? | ? | ? | ? |
| Strategy / API | ||||||
| NinjaScript plot exposure | ✓ 28 plots | ? | ✓ VP Metrics | — | — | levels printed |
| Developing trace plots (POC/VAH/VAL/VWAP) | ✓ NEW | developing POC visual | ? | — | developing POC visual | ? |
| IB High / IB Low as plots | ✓ NEW | ? | ✓ via Metrics | — | — | ? |
| Market Analyzer column support | ✓ all 28 plots | ? | ✓ Metrics | — | — | ? |
| Interactive on-chart toolbar | ✓ | ✓ on-the-fly | right-click menu | ✓ platform UI | ✓ platform UI | right-click menu |
Comparison based on the information publicly available on each vendor's product pages as of May 2026. Features and pricing may have changed since.
The Nerd Vault
Daily, Weekly, Monthly, Custom Session, Fixed Interval, Visible Range, Every X Bars, All Bars, plus Composite Date Range and Rolling N Days mapping.
Mono, Heatmap intensity, Buy/Sell side-by-side, Delta net strength, and Delta & Volume composites.
Automatically tracks and projects POC, VAH, VAL, VWAP, and Session High/Mid/Low pivots, with auto-stagger labels and migrating-POC step line.
Algorithmic highlighting of High Volume Nodes (HVNs) and Low Volume Nodes (LVNs), with smart Forever / Until Broken / Until Tested extension modes.
Overlay Time Price Opportunity data directly alongside pure Volume Profile metrics, with separate POC and Value Area for each.
On-chart interactive toolbar with dynamic per-mode sub-panels, inline color pickers, and mouse-wheel scrollers — no settings dialog needed.
Everything the floor traders use, automated. The volume profile no longer just shows volume distribution — it interprets it.
Auto-tagged: Trend Day, Norm Var, Normal, Neutral, Neutral Ext, Double Dist, Non-Trend. Combines IB-ratio, POC drift over the developing trace, both-side IB break, and a peak/trough scan of the volume distribution.
Glassmorphism card anchored above each profile's high — Volume, signed Delta with %, Range/VA Width/IB in ticks, Above-/Below-POC Balance, and the Day-Type pill.
Every previous-session POC carries an IsBroken flag. Display modes: All, Naked Only, or Hide. Untested POCs are statistical magnets.
The first N minutes of each session, auto-detected. Extensions only render after price has actually visited them — no historical chart litter from untested levels.
The classic auction-theory unfinished business signals — areas the market raced through, or extremes printed without rotation. Auto-detected and marked.
Step-function line connecting each session's POC. Reveals climbing / dropping staircases, balance zones, and institutional fair-value drift at a glance.
POC / VAH / VAL touch, HVN / LVN approach (configurable ticks), Naked POC test, IB break — each with its own toggle and global cooldown.
Composite-shape detection (B / P / D / Composite) auto-splits multi-distribution sessions into sub-profiles, each with its own POC and VA.
For advanced quantitative traders, this indicator exports 28 raw volume data points directly as NinjaScript plot series — ready to be digested by AlgoStudio Pro strategies, Bloodhound logic trees, Market Analyzer columns, or any custom NinjaScript indicator.
VP Value Area High / Low, VP POC, LVN Price, HVN Price, LVN/HVN Distance (ticks), TPO Value Area High / Low, TPO POC, VWAP.
The same 11 series for the previous session — programmatic access to yesterday's POC, VAH, VAL, VWAP, node prices, and TPO levels.
Developing POC / VAH / VAL / VWAP — the live levels as they migrate through the developing session. Read directional bias of the auction in real time.
Initial Balance High and Low as plot series. Combine with price comparisons to alert or auto-enter on IB breaks; or use them as adaptive levels.
- may-2026 (v1.0.1.29) - Major release combining auction-theory features, premium visual redesign, and reliability fixes. Auction-theory feature drop: Naked POC tracking (All / Naked Only / Hide), Initial Balance with 1× / 2× / 3× extensions (visited-only), Single Prints + Poor High / Poor Low detection, 7 audio alert types, Migrating POC line (step-function rendering), Composite Date Range and Rolling N Days profile modes, Day-Type classification (rewritten to use IB-ratio + POC drift + peak/trough scan; labels in Title Case), floating Stats Card. Plot series expanded with developing trace + IB high/low. Visual polish: DeepCharts-inspired palette as the new default — electric blue buy / violet sell / cyan POC / soft pink VAH / mint VAL / indigo VWAP. Premium glassmorphism floating stats card. Dominant 3 px solid POC and ExtendCurrentLines on by default. Auto-stagger for POC / VAH / VAL / VWAP / High / Low labels with thin angled connectors. Outside-VA opacity 25 % → 15 %. Hairline session dividers. Smart sigma suppression on partial sessions. Reliability fixes: Buy/sell volume bias corrected (off-by-one in up/down tick classifier). BarCount=1 fixed in Every-X-Bars mode. Previous-profile lines now extend correctly when ExtendUntil = Forever. Leftmost / partial composite no longer fails to render.
Frequently Asked Questions
Everything you need to know about licensing, platform architecture, and trials.
General Info & Trials
Licensing & Billing
Platforms & Technical
Tools & Automation
Hardware & Specs
Ready to Automate Your Edges?
Stop drawing. Start executing.