
Stop Trading Retail Illusions: Automate Your Market Structure And Follow The Smart Money With Absolute Certainty.
You Are The Liquidity.
Most retail traders fail because they are actively trading against the invisible flow of institutional capital. You aren't just getting stopped out—your stop loss is the exact target banks use to fill their massive positions.
You spot a breakout. You buy the push. Then price violently reverses, sweeping your stop before continuing aggressively in your original direction. In hindsight, the trap was obvious: you bought directly into a massive institutional Supply Zone that your standard indicators couldn't see.
The TDU Market Structure suite is engineered to solve this terminal flaw. It acts as an X-ray for institutional order flow, automatically mapping the Break of Structure (BOS), Change of Character (ChoCh), Order Blocks, and Fair Value Gaps directly onto your chart. It shows you exactly where the "Smart Money" left their footprints.
Stop trading the retail illusions. Follow the true mathematical geometry of the big banks. What you see is mathematically verified institutional structure—no subjective guessing, no lagging averages, just pure algorithmic truth.
You're Trading Blind.
We X-Ray Institutional Flow.
Retail traders rely on lagging oscillators. Institutional algorithms rely on supply, demand, and structural imbalances. Stop guessing where the money is.
Trading Against The Machine
You enter perfectly good setups, only to get bulldozed by sudden price spikes. You are trading standard patterns in zones where banks have already positioned massive counter-orders. Your capital is their entry liquidity.
The Fakeout Fatigue
You buy the breakout, but price instantly drops back into consolidation. You get stopped out, suffering death by a thousand cuts while the market makers absorb retail volume before the *real* move happens without you.
Algorithmic Front-Running
TDU Market Structure eliminates retail traps. It autonomously scans the tape to reveal hidden Order Blocks and structural shifts, empowering you to execute your entries exactly where the banks are defending their positions.
Watch Once & Stop Being The Liquidity.
The Architecture Of The Edge
Everything you need to automate Smart Money Concepts, packed into one zero-lag C# framework.
Map True Market Geometry
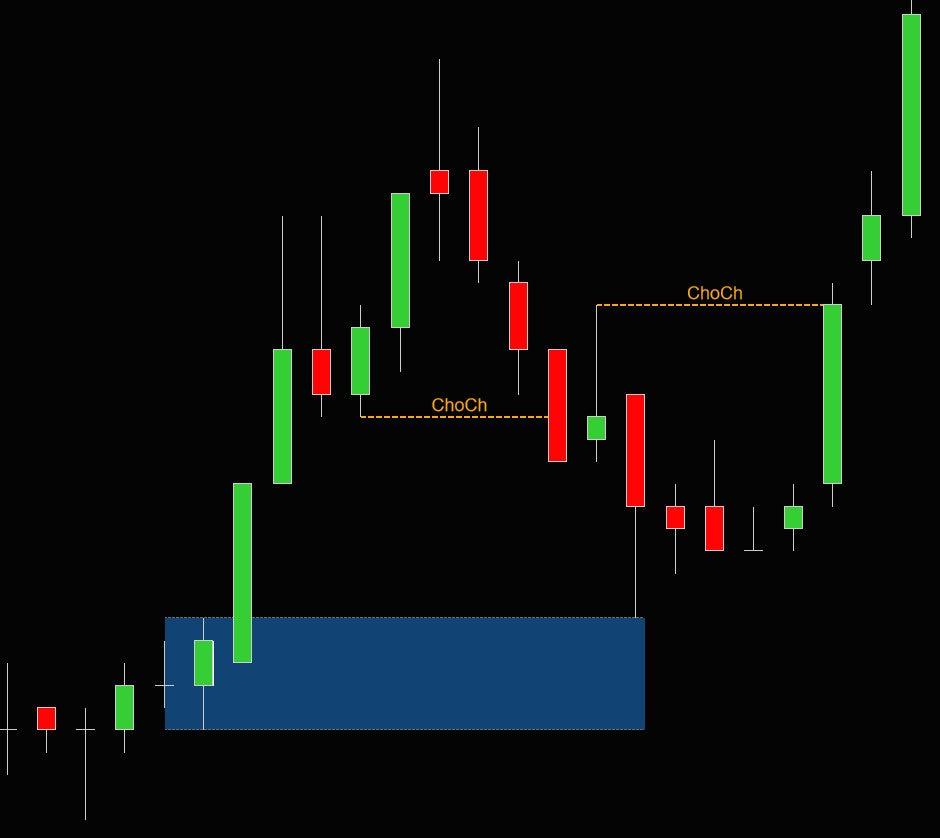
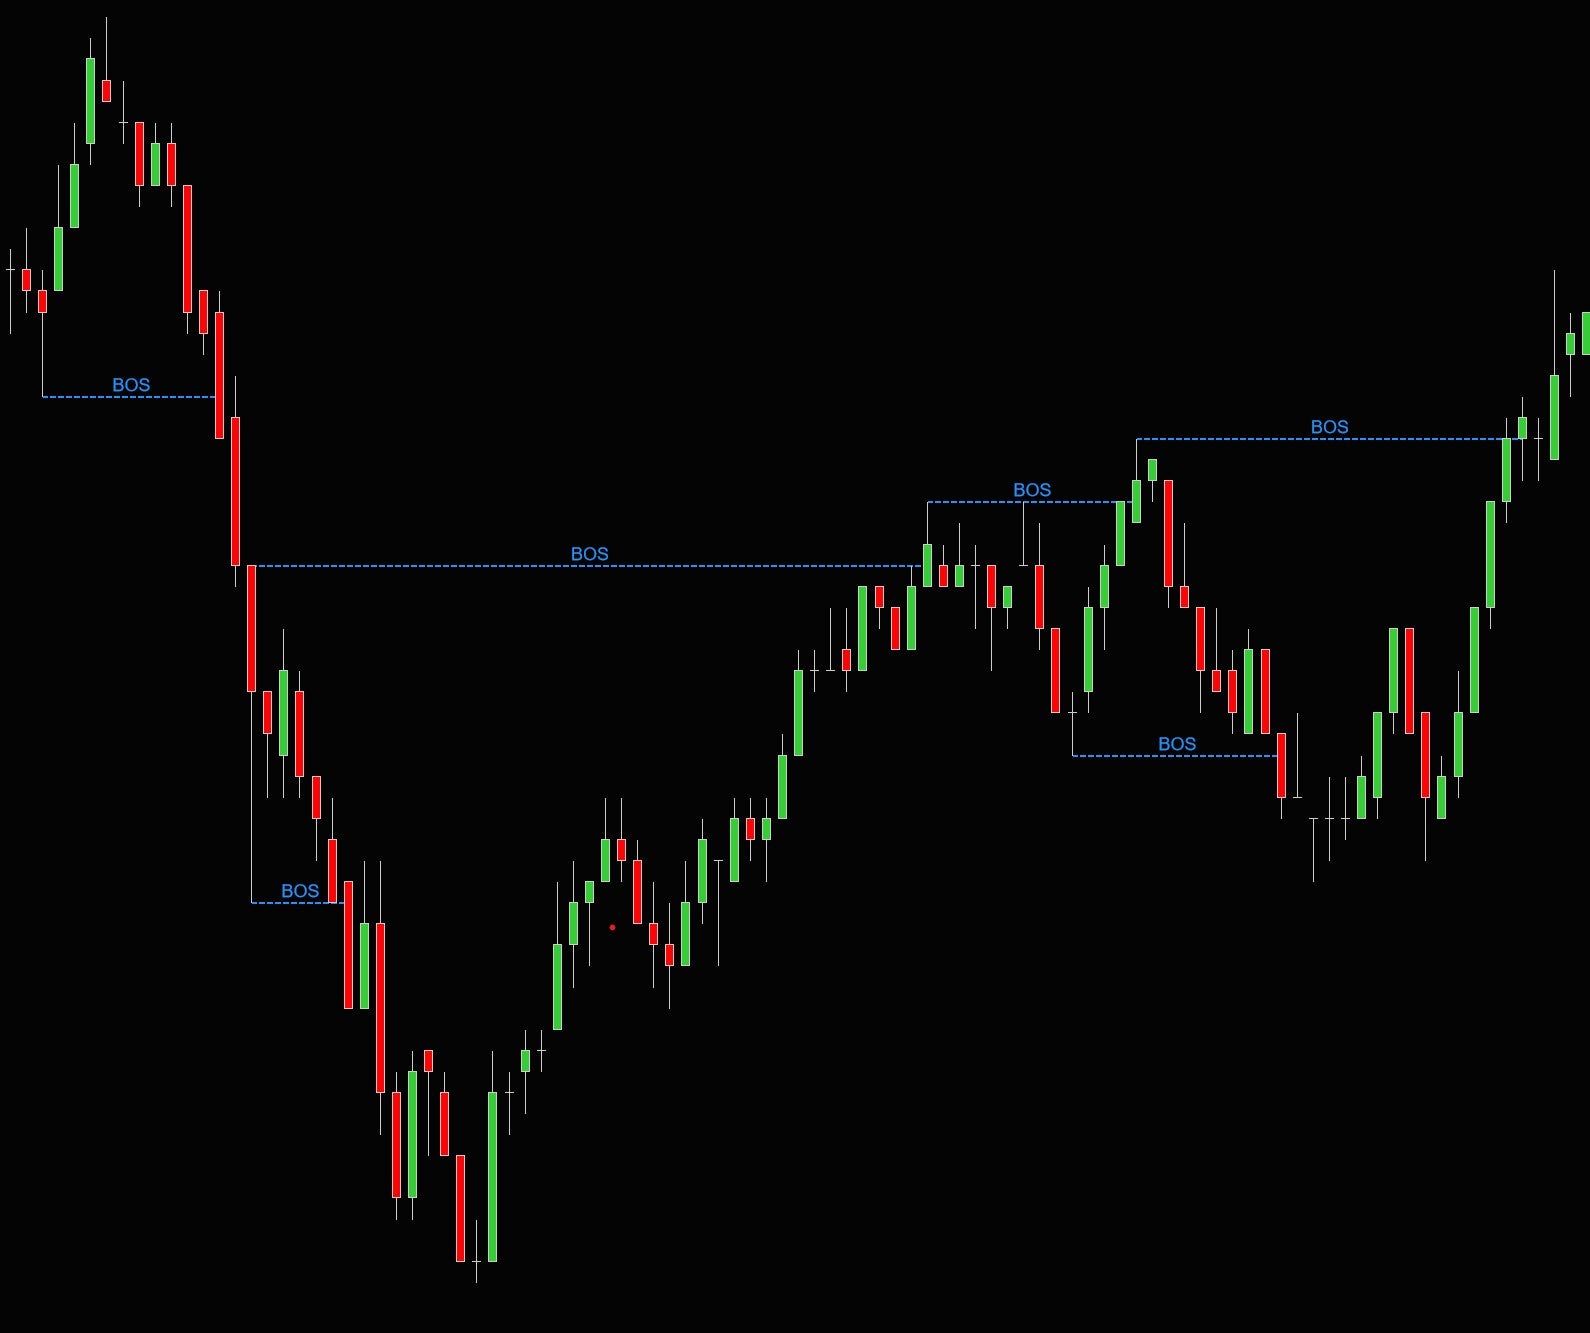
The software autonomously detects valid Break of Structure (BOS) and Change of Character (ChoCh) patterns in real-time, so you can verify the true direction of institutional momentum and instantly validate your setups.
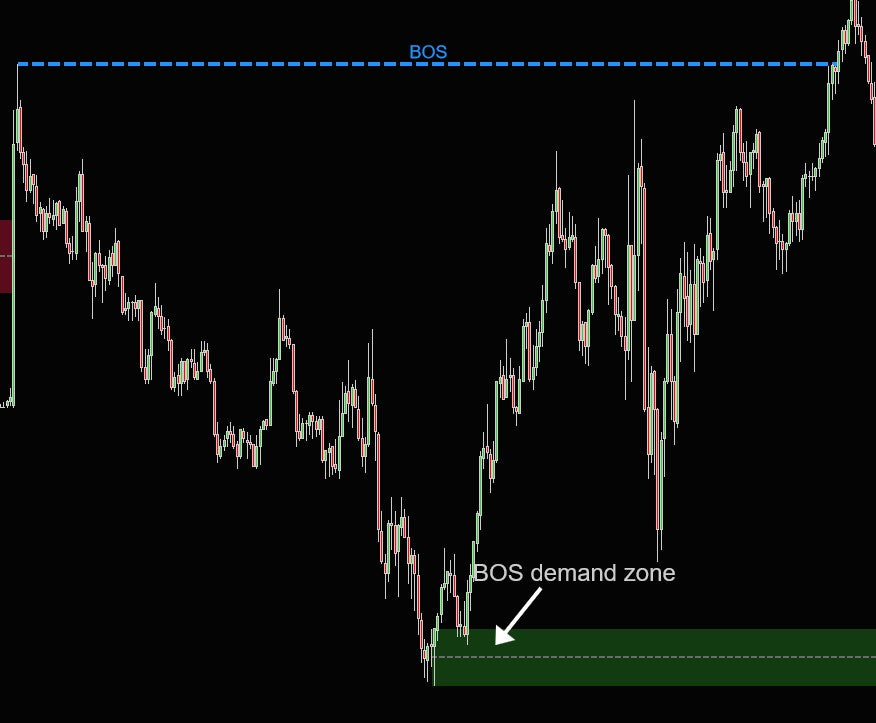
Exploit Supply & Demand
Dynamically plot high-value Order Blocks where big money accumulated positions, allowing you to front-run retail liquidity and place your trades precisely where major algorithmic intervention is mathematically guaranteed to happen.
Capitalize On Imbalances
Instantly reveal Fair Value Gaps (FVG) left by violent, one-sided institutional execution, giving you crystal clear magnetic targets for your profit-taking before price snaps back to fill the empty volume voids.
Automate The Edge
Output all structural shifts, zones, and fibs via 16 dedicated strategy plots for NinjaScript or Bloodhound, empowering quantitative traders to build fully automated execution models based entirely on institutional X-ray logic.
Command Market Structure.
Stop fighting the tape. A Break of Structure (BOS) confirms the big players are still aggressively in control, while a Change of Character (ChoCh) gives you an early warning that momentum is flipping, ensuring you never hold a position blindly into an institutional reversal again.
- Pinpoint accurate BOS/ChoCh shifts dynamically.
- Toggle between strict Fractal or Price-Action logic.
- Receive instant audio alerts when structure breaks.
Hunt Within Order Blocks.
Retail sees a random wick. You see the footprint. The indicator isolates exact consolidation ranges where massive block orders were accumulated, giving you the exact high-probability strike zones to place your limit orders with mathematically tight risk.
- Automatically render massive Supply and Demand clusters.
- Track "Breaker Blocks" when support flips to resistance.
- Fade retail breakouts perfectly inside institutional zones.

Exploit Fair Value Gaps.
When price drops so aggressively that it leaves empty space on the tape, it creates a vacuum. The algorithm maps these Fair Value Gaps instantly, providing you with high-precision magnetic targets where price is highly probable to retrace before continuing its trend.
- Visualize unfilled volume voids effortlessly.
- Set precise take-profit targets based on gap fills.
- Combine FVG targets with Order Block entries.
Dictate Timeframe Alignment.
Trading on a 5-minute chart? Stop flipping screens. Our Multi-Timeframe (MTF) engine securely pipes 1-hour or 4-hour structural data natively into your active execution chart, so you can scalp intraday volatility while maintaining perfect alignment with the macro institutional trend.
- Overlay higher timeframe data seamlessly.
- Filter out micro-noise to find the macro play.
- Execute lower-timeframe entries inside higher-timeframe zones.

Execute With Volume Precision.
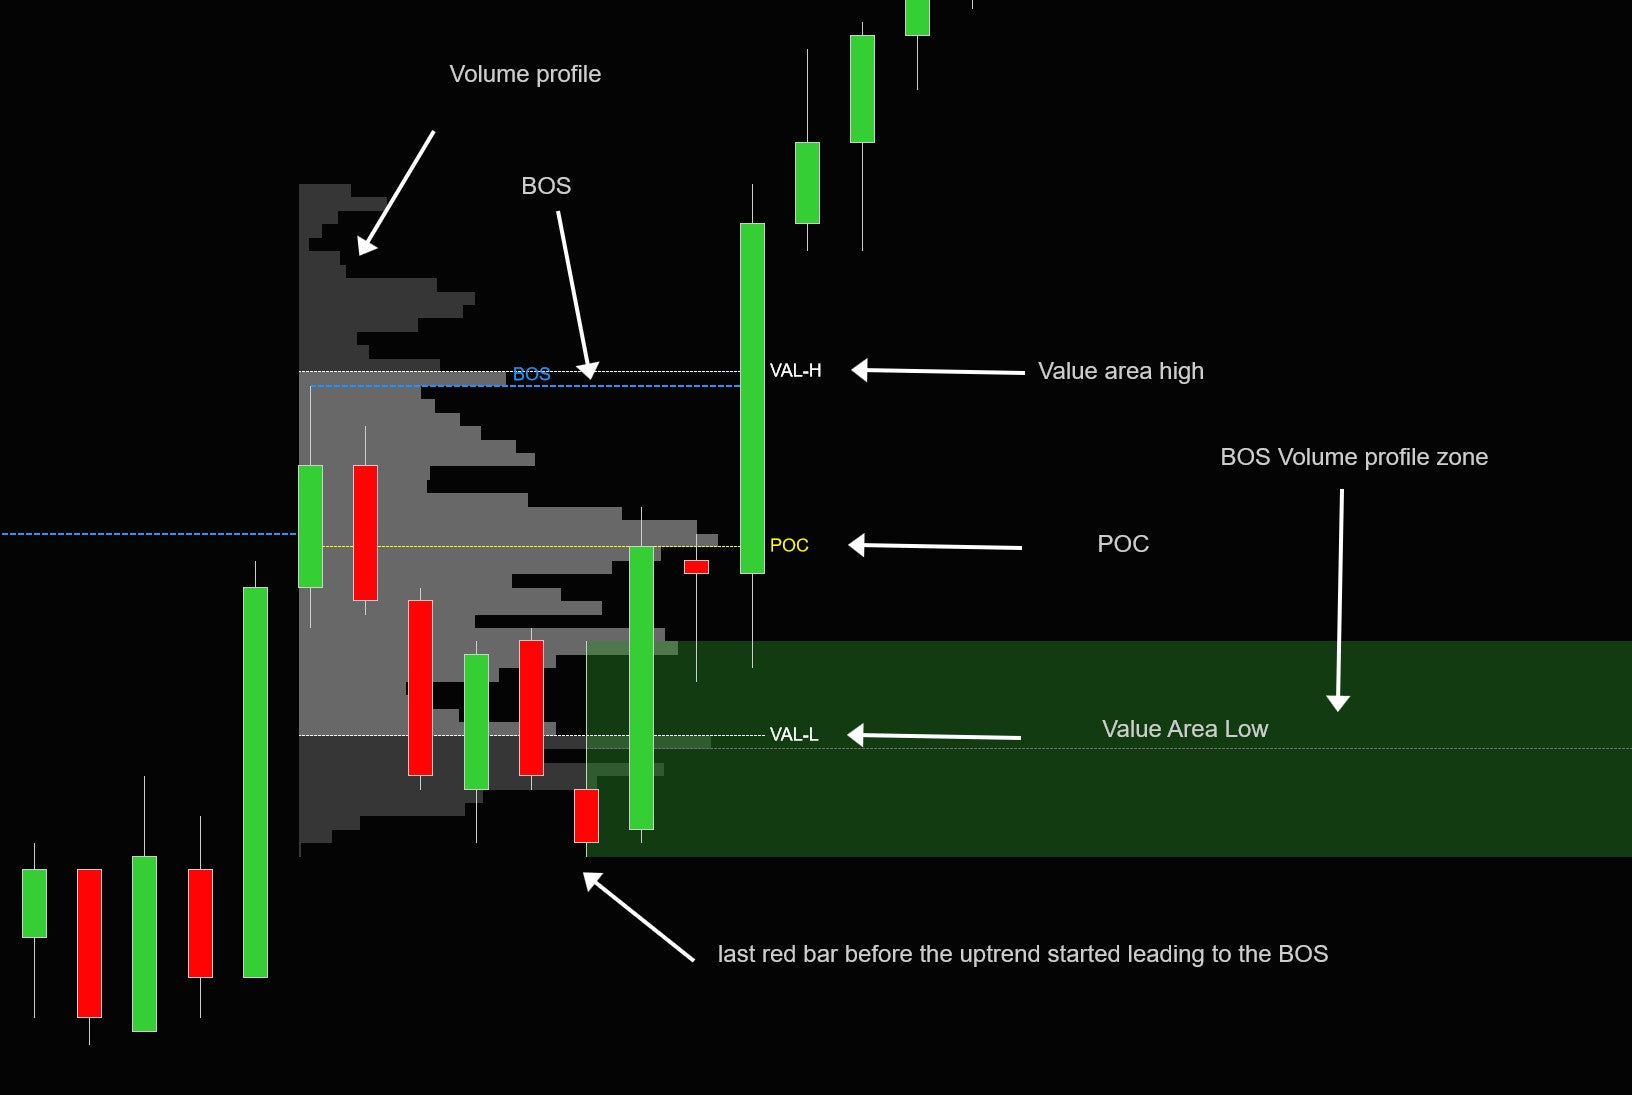
Stop wondering where the heavy volume occurred. The tool integrates natively with Volume Profile for every single structural move, highlighting the exact Point of Control (POC), so you can demand volume-confirmed evidence before committing capital to any structural support.
- See volume distribution injected directly into the trend move.
- Pinpoint the exact POC where maximum liquidity sits.
- Consolidate 5 disjointed indicators into one master toolkit.
The Nerd Vault
Native algorithmic detection of Break of Structure and Change of Character.
Choose between deep "Fractal" calculation or ATR-based "Price Action" algorithms.
Dynamic highlighting of Institutional footprints, imbalances, and Breaker blocks.
Identifies Equal Highs/Lows and Trendline liquidity meant for retail stop hunts.
Pull and process Higher Timeframe data instantly onto any lower execution chart.
Tracks actual transactional volume across the specific range of the structural push.
For advanced quantitative traders, this indicator outputs 16 dedicated strategy plots directly into memory, rendering it instantly compatible with AlgoStudio Pro, Bloodhound, or proprietary NinjaScript algorithms.
- Trend Direction Matrix: Outputs immediate +1/-1 logic denoting current institutional momentum bias.
- Order Block Nodes: Exports coordinates for the nearest active Supply, Demand, or Breaker blocks.
- FVG Data Links: Feeds the raw pricing data for active Fair Value Gap vacuums.
- Fibonacci Extraction: Delivers all 6 automated Fibonacci retracement tier levels directly to your execution scripts.
- Current (v1.0.1.15+) - Added fractal detection mode, breaker blocks, trendline liquidity, equal highs/lows, micro structure.
- 17-May-2023 (v1.0.1.12) - Fixed dropdown menu rendering post-workspace load.
- 09-May-2023 (v1.0.1.11) - Enhanced volume profile stability and rendering sequence.
- 20-Mar-2023 (v1.0.1.8) - Added dedicated plots for FVGs and Order Blocks, plus expanded Fibonacci depth logic.
- 07-Aug-2022 (v1.0.0.7) - Introduced Fair Value Gaps, Order Blocks, and trend change metrics.
- 31-Mar-2022 (v1.0.0.1) - Initial core architectural release.
Frequently Asked Questions
Everything you need to know about licensing, platform architecture, and trials.
General Info & Trials
Licensing & Billing
Platforms & Technical
Tools & Automation
Hardware & Specs
Ready to Automate Your Edges?
Stop drawing. Start executing.