Overview
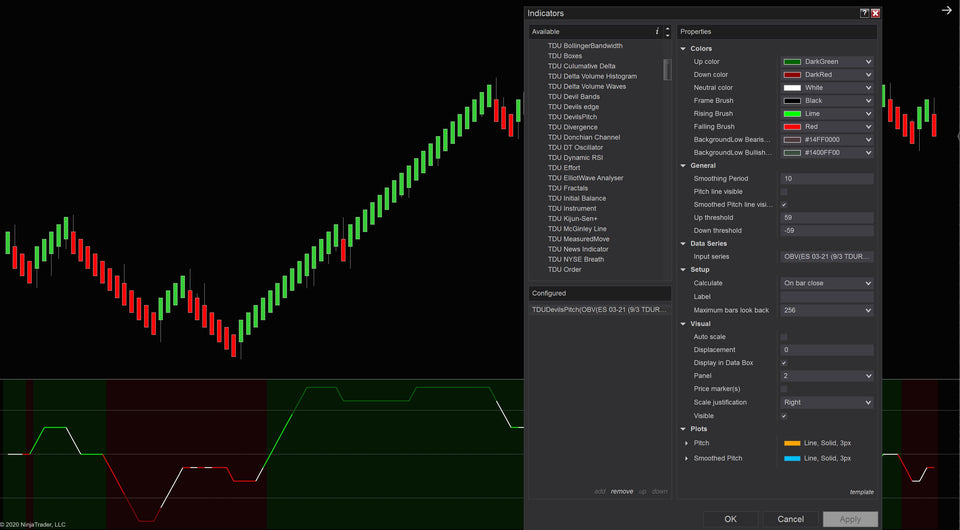
The TDU Devil's Pitch is a one-of-a-kind tool that allows you to show the slope/angle of any indicator. Most indicators simply show you a line (e.g. a moving average) on or below the chart, however, a simple line is not very helpful in many cases since by the time our human eyes see the line angle changing the trend has already started (or ended). Instead of a simple line, the Devil's Pitch shows the angle of the line so you can quickly see if the indicator line is starting to rise or flattening out.
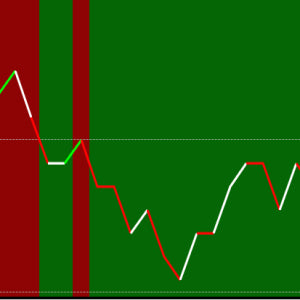
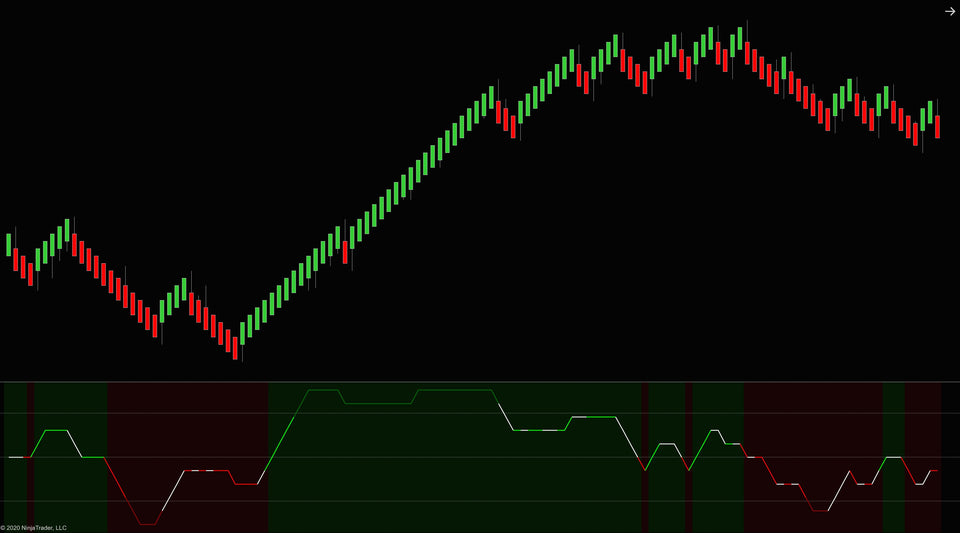
Measuring the angle of the line of any indicator, the Devil's Pitch shows you the angle (-90 degrees to +90 degrees) as a line below the chart. Using this information you can clearly see if the line is rising or flattening off. When it's starting to rise we might be in the early stages of a new trend. A steep rising line is a clear indication of a strong trend, and a flattening line means the trend might be over soon.
Besides that our unique color scheming tells you what to look for. A green background means we're only looking for longs, a red background means we're only looking for short. The angle line itself is colored too:
- Deep red or green when the angle is very steep and we can expect it to flatten out soon
- Red or green when the angle is rising/falling nicely
- White if we are in a transition between green and red
Key Features
- See the slope/angle of any indicator in real-time
- A color scheme designed to provide a clear indication of whether you are looking for long or short positions
- Can be used alongside any indicator
- not compatible with bloodhound, algostudio pro or any other strategy
-
Works on any instrument
- Works on any timeframe


