
Visualize Market Momentum With Easy-To-Read Delta Candles For Absolute Trading Clarity.
You're Trading Blind to the Actual Order Flow.
Most traders don't fail because of bad patterns. They fail because traditional candlestick charts hide the brutal reality of who is actually controlling the market at any given second.
You see a massive green breakout candle and hit buy. Then price immediately drops, trapping you at the high. What you couldn't see was the massive institutional sell limit order absorbing all that buying pressure. You got played by invisible liquidity.
The Orderflow Footprint Delta Candles indicator is built specifically to expose this hidden battlefield. It translates complex footprint data into simple, intuitive delta candles directly below your price chart. No more staring at dizzying data tables or guessing momentum. Right below the price action, where your eye already is.
Every candle reveals the net difference between aggressive buyers and sellers. What you see is mathematically verified buying or selling pressure—no subjective wicks, no hidden exhaustion, just raw institutional intent mapped tick by tick.
You're Trading Illusions.
We Map The Order Flow Reality.
Retail traders rely on empty price bars. Institutional algorithms rely on verifiable delta momentum. Stop guessing who is in control.
Reading Empty Candles
You waste time analyzing traditional candlesticks that show price but hide volume dynamics. Two identical green candles can have completely different internal buying pressure, destroying your edge.
Buying Into Exhaustion
You buy into a strong trend just as the actual buying volume dries up. You get caught in the reversal because your chart didn't warn you that aggressive sellers were quietly taking control.
Verified Market Momentum
The Delta Candles eliminate the guesswork by plotting exact net volume differences. Instantly spot divergence, absorption, and momentum extremes so you only trade when the true order flow aligns with price.
Watch Once & NEVER Trade Blind Again.

Raw Output: Objective Delta Divergence & Volume Traps Identified Live.
The Architecture Of The Indicator
Everything you need to automate your order flow analysis, packed into one zero-lag C# tool.
Expose Hidden Exhaustion
Translate complex volume tables into clear, color-coded delta candles, so you can instantly identify when buyers or sellers are running out of steam before the price reverses.
Spot Institutional Absorption
Visually detect when massive market orders hit a wall of limit orders during a stalemate, so you can avoid breakout traps and trade the inevitable violent mean-reversion move.
Catch True Divergence
Automatically mark exact moments where price moves up but volume moves down, ensuring you never buy the top of a fakeout rally fueled by weak underlying volume.
Automate The Edge
Export real-time Delta, MinDelta, and MaxDelta plots directly into Bloodhound or custom NinjaScript strategies, allowing you to remove emotion completely and let your systems capitalize on your edge automatically.

Decode Institutional Absorption.
When the market is in a stalemate, you will see very small delta candles. Watch for a sudden "flare-up" or increase in candle size. This is your visual cue that one side has taken control and a move is about to begin, allowing you to fade the retail crowd.
- Identify early signals before major price breakouts.
- Spot zones where limit orders absorb market orders.
- Never guess who won the battle at key levels.
Anticipate Trend Reversals.
In a strong trend, you might see massive delta candles. If subsequent candles rapidly shrink and change color, it signals total exhaustion. This gives you the mathematical green light to exit early or flip your bias before the reversal becomes obvious on the main chart.
- Catch early clues that a trend is running out of steam.
- Avoid entering late into exhausted moves.
- Lock in profits before massive counter-trend drops.

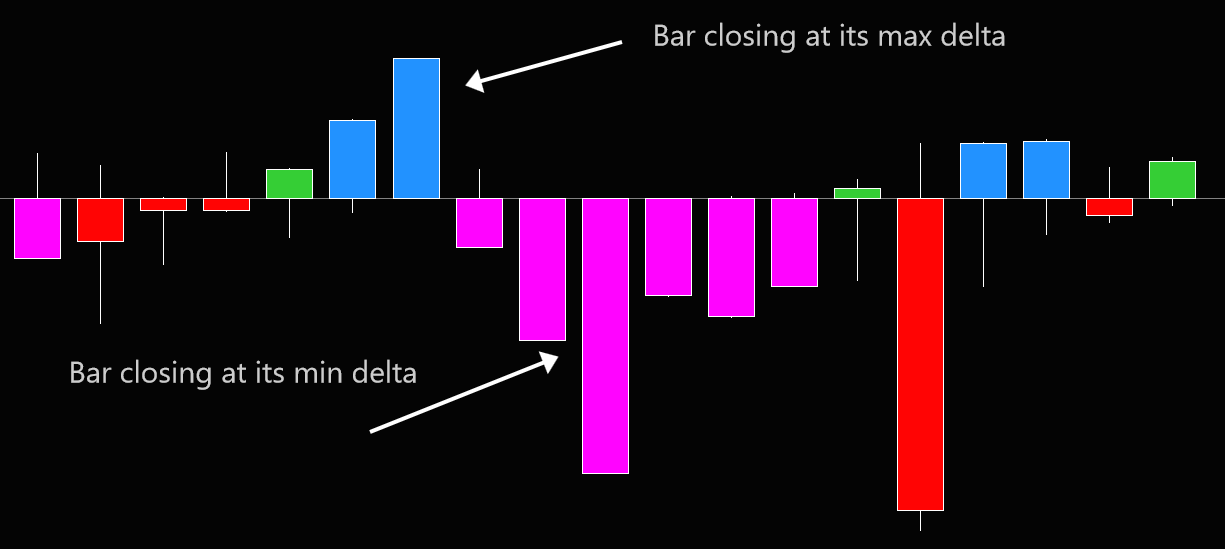
Exploit Extreme Momentum.
This feature highlights periods of extreme market conviction. A "Max Delta" close means buyers were aggressive until the very last second of the bar. Ride the wave alongside massive institutional momentum without getting shaken out prematurely.
- Identify absolute conviction from aggressive buyers/sellers.
- Filter out weak momentum pulses.
- Hold runners confidently during extreme delta pushes.
Execute On Pure Divergence.
The indicator automatically spots when price and volume disagree, placing clear circle markers on your chart. If the price bar is green but buying volume is negative, you receive an instant warning that the upward move is a trap, allowing you to execute high-probability counter-trend trades.
- Instantly identify bearish and bullish divergence.
- Avoid false breakouts fueled by weak volume.
- Execute precision entries against the retail crowd.
The Nerd Vault
Visualizes Delta, Min Delta, and Max Delta precisely as a dedicated sub-chart indicator.
Native algorithms automatically plot Bullish and Bearish Divergence circles directly on the interface.
Full control over colors for trend exhaustion, wicks, and momentum extremes.
Visualizes market data for any chart type. It does NOT require a separate "Footprint" chart indicator to function.
Requires "Tick Replay" to be enabled within NinjaTrader 8 for complete historical accuracy.
100% compatible with Bloodhound and fully automated custom NinjaScript systems.
For advanced quantitative traders, this indicator exports raw order flow plot data directly into memory, ready to be digested by NinjaScript strategies or Bloodhound logic trees.
- Delta Plot: Continuously tracks the net difference between aggressive buyers and sellers.
- MinDelta Plot: Outputs the lowest recorded delta value achieved during the bar's formation.
- MaxDelta Plot: Outputs the highest recorded delta value achieved during the bar's formation.
- Important Note: Bloodhound does not natively support Tick Replay. Because this indicator requires Tick Replay for historical accuracy, Bloodhound usage is recommended for real-time trading environments only.
- 26-may-2023 (v1.0.0.2) - Added separate color rendering for candle wicks. Fixed issue with candles not rendering when 'show delta divergence' was turned off.
- 19-may-2023 (v1.0.0.0) - Initial core release of the Orderflow Footprint Delta Candles architecture.
Frequently Asked Questions
Everything you need to know about licensing, platform architecture, and trials.
General Info & Trials
Licensing & Billing
Platforms & Technical
Tools & Automation
Hardware & Specs
Ready to Automate Your Edges?
Stop guessing. Start executing.