
Automate Multi-Timeframe Levels For Big-Picture Clarity And High-Precision Entries.
You Aren't Trading the Market. You're Trading Micro-Noise.
Retail traders get chopped up every single day for one brutal reason: they are trading in a vacuum. You stare at a 5-minute chart, hunting for breakouts, completely blind to the 60-minute institutional supply zone lurking just a few ticks above your entry.
You take the long, price hits an invisible ceiling, and you get stopped out in a violent reversal. It wasn't bad luck. It was poor structural awareness. Institutional algorithms execute at major macro levels, yet most retail traders refuse to map them because drawing and updating boxes across multiple timeframes is tedious and subjective.
The Multi Timeframe Support/Resistance Indicator eliminates this "context blindness." It acts as your macro radar, mathematically projecting higher timeframe supply and demand zones directly onto your lower timeframe execution charts in real-time. No more guessing where the massive walls of liquidity are sitting.
You'll see exactly where big money is positioned before price ever reaches it. Stop trading the micro-noise. Start executing with total omniscience over the broader market geometry.
You're Trading Blind.
We Reveal the Institutional Grid.
Quit guessing where the market will turn. Overlay the exact levels where institutions are forced to show their hand.
The Timeframe Trap
Executing purely off a fast intraday chart isolates you from the actual trend. You miss critical higher-timeframe boundaries, leading you to buy directly into heavy macro resistance that you literally cannot see.
The "Invisible" Reversal
There is nothing more frustrating than a perfect setup failing instantly for no apparent reason. You get stopped out, only to check a Daily chart later and realize you traded straight into a massive supply wall.
Multi-Timeframe Omniscience
This tool automatically projects 60-min, Daily, or Weekly zones directly onto your 5-minute execution chart. You see the macro "traffic jams" before price hits them, keeping your capital safe and your entries precise.
See Every Zone. Miss Nothing.
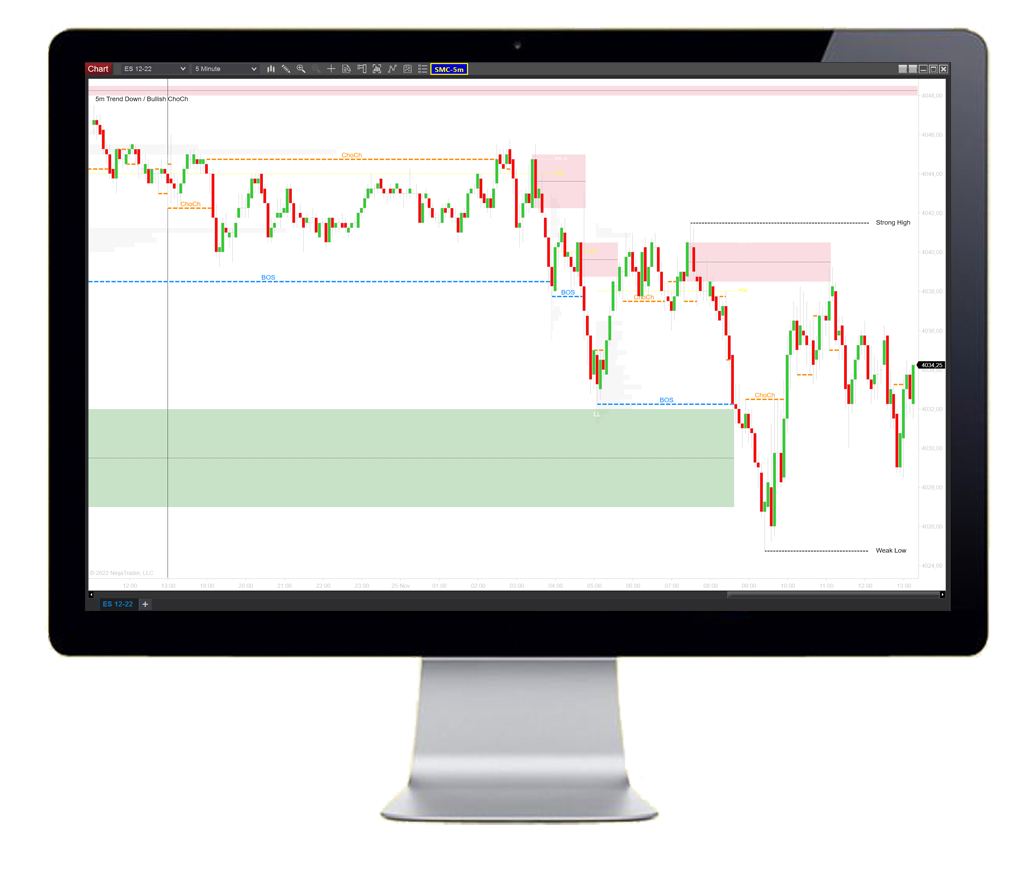
Raw Output: Objective MTF Supply & Demand Zones Verified Live.
The Architecture Of The Indicator
Everything you need to automate your multi-timeframe structural analysis, packed into one zero-lag C# tool.
Overlay Macro Context
Plot 60-minute, Daily, or Weekly supply and demand zones directly onto your fast intraday charts, so you can stop manually drawing boxes and instantly see where heavy institutional liquidity resides.
Validate Zone Strength
The software automatically counts and tracks historical touches for every single level, allowing you to easily differentiate between weak temporary zones and battle-tested "concrete" walls of support.
Execute With Confluence
Integrates a dynamic Karthik RSI directly into the structural logic, so you can mathematically verify if price is legitimately "overbought or oversold" when hitting a zone before taking the reversal trade.
Automate The Edge
Exports 6 distinct strategy-ready data plots (SupportPrice, ResistancePrice, SignalLong, etc.) directly into Bloodhound, giving quantitative traders the ability to build headless algorithms that trade multi-timeframe bounces 24/7.
Command The Big Picture.
Stop missing trades because your charts are zoomed in too far. The Multi Timeframe Engine projects higher timeframe architecture down to the tick level, ensuring your scalps and intraday setups are always aligned with the dominant institutional order flow.
- Display 60-min or Daily levels on a 1-minute chart.
- Visually map active and "broken" traffic jams in price.
- Free up mental bandwidth by eliminating manual chart drawing.
Dominate The Retest.
When price retraces back to a verified zone, it usually reacts violently. By automatically tracking the "touch count" and RSI confluence of these levels, you can spot high-probability bounce setups early and secure massive risk-to-reward entries with incredibly tight stops.
- Catch knife-edge bounces at exact structural boundaries.
- Avoid catching falling knives at weak, untested zones.
- Leverage the built-in Karthik RSI to confirm exhaustion.


Exploit Structural Breakouts.
Old resistance often becomes new support. When price decisively fractures a heavy multi-timeframe zone, the indicator marks the flip. This gives you a crystal clear roadmap to trade the pullback, entering precisely where trapped shorts are forced to cover their positions.
- Visually distinguish active zones from broken ones.
- Define zone breaks strictly by "Price Cross" or "Price Close".
- Know exactly where to place your protective stop-loss.
Dictate Zone Calculations.
No two markets behave identically. Take total control over how structural zones are generated by toggling the core mathematical inputs, allowing you to tailor the indicator to fit your specific asset class volatility and personal trading style perfectly.
- Line: Snap to exact absolute highs or lows.
- Close: Filter noise by mapping only session closes.
- Wick: Capture extreme liquidity tail grabs.
- Average: Find the exact median of the price action.
The Nerd Vault
Plot native 60min, Daily, Weekly, or custom higher timeframe zones accurately on your fast execution charts.
Includes a built-in Karthik RSI integration to mathematically validate if a zone is in an overbought/oversold state.
Automatically tallies historical touches for every zone to objectively grade the strength of support/resistance.
Customize zone calculation logic utilizing High/Low Lines, Candle Closes, Wicks, or Price Averages.
Configure what constitutes a broken zone: choose between aggressive "Price Crosses" or conservative "Price Closes".
Full control over aesthetics, with adjustable colors for active vs. broken zones and custom text labeling parameters.
For quantitative engineers, the indicator exposes 6 specific data plots directly into memory, optimized for Bloodhound logic trees and custom NinjaScript Builder strategies.
- SupportPrice Plot: Outputs the exact Y-axis coordinate of the nearest validated MTF support zone.
- ResistancePrice Plot: Outputs the exact Y-axis coordinate of the nearest validated MTF resistance zone.
- SignalLong Plot: Emits a +1 integer when structural bounce/breakout criteria align for a long setup.
- SignalShort Plot: Emits a -1 integer when structural bounce/breakout criteria align for a short setup.
- TouchCounter Plot: Exposes the raw touch count integer for the current active zone.
- RSIState Plot: Outputs the internal Karthik RSI state for confluence filtering.
- 11-Oct-2024 (v1.0.2.0) - Improved performance and core algorithm optimization.
- 05-Mar-2024 (v1.0.1.9) - Added extra exposed plots for enhanced strategies and Bloodhound integration.
- 02-Jun-2022 (v1.0.1.5) - Added option to show overbought/sold levels based on dynamic Karthik RSI.
- 06-Sep-2021 (v1.0.0.6) - Fixed coloring of broken zones. New option: Define broken zones by "Price Cross" or "Price Close". Displays touches occurring after zone start.
Frequently Asked Questions
Everything you need to know about licensing, platform architecture, and trials.
General Info & Trials
Licensing & Billing
Platforms & Technical
Tools & Automation
Hardware & Specs
Ready to Automate Your Edges?
Stop trading in the dark. Map the macro grid.