
Spot Precise Reversals With Lag-Free Volatility Bands For Total Trading Confidence.
Your Moving Averages Are Always Late. Here's Why.
Most traders don't fail because they misidentify the trend. They fail because their baseline indicators are calculating static historical averages while the live market is ripping at an entirely different speed.
You see price touch the bottom band. You hit buy. Instantly, the bottom drops out. Why? Because standard moving averages and fixed envelopes don't account for real-time velocity or volatility expansion. By the time your traditional MA realizes momentum has fundamentally shifted, you're already caught in the chop or stopped out entirely.
The Devils Bands are engineered specifically to fix this lag. Built on a kinematic McGinley centerline logic and adaptive ATR (Average True Range) channels, this indicator actually speeds up in fast markets and smooths out in slow markets. It mathematically anchors to the live flow of institutional volume.
Instead of statically guessing where a bounce *should* happen based on the last 14 candles, the algorithm maps dynamic volatility barriers live. When price stretches to the outer boundary of a Devils Band, it is mathematical exhaustion—giving you high-probability reversal entries without the lethal lag.
You're Trading The Past.
We Map Live Market Speed.
Retail traders rely on lagging 14-period EMAs that guarantee late entries. Institutional algorithms rely on volatility-adaptive structures. Stop reacting to old data.
The Moving Average Trap
Traditional moving averages fail completely because they can't adapt. They inevitably lag in fast-moving, aggressive markets, and they wildly whipsaw you to death in tight, slow ranges.
Late Entries & False Breakouts
You enter off a standard band crossover, only to realize the "trend" is already over. Worse, fixed-width bands get completely blown out the second real volatility enters the market, destroying your stops.
Dynamic Volatility Mapping
Devils Bands use ATR-based expansion tied to a self-adjusting centerline. The bands expand precisely when volatility spikes, and contract when it dies—framing exhaustion zones with pinpoint accuracy.
Track Speed. Execute On Exhaustion.

Raw Output: Kinematic Centerline & Volatility-Adjusted Reversal Bands.
The Architecture Of The Indicator
A complete suite for capturing high-probability trend entries and aggressive mean-reversion setups.
Adapt To Market Speed
The core utilizes a McGinley Line base that acts as a self-adjusting moving average. It sticks closer to price in fast markets and smooths out the chop in slow markets, giving you a mathematically accurate centerline that doesn't lag behind real-time momentum.
Spot Institutional Exhaustion
The outer envelopes are built on True Average Range (ATR), meaning they dynamically expand and contract based on live volatility, so you immediately see when price has mathematically stretched too far and is primed for a massive mean-reversion snapback.
Filter Out The Chop
Integrated visual cues like Slope Color Changes and an optional "No Trade Zone" help you instantly identify flat, untradable consolidation, ensuring you preserve your capital during garbage chop and only fire bullets when a true trend establishes.
Automate Your Execution
Fully loaded with native plot data for algorithmic traders. Connect seamlessly to Bloodhound, BlackBird, or your own custom NinjaScript strategies, allowing you to build headless, emotion-free bots that execute perfectly on band touches and mid-line crosses 24/7.

Eliminate Indicator Lag.
Stop missing the move because your EMA was too slow to react. Devils Bands anchor their geometry to market speed, maintaining a relentless grip on current price action, so you can enter trend continuations with minimal drawdown and ultimate confidence.
- McGinley base calculates real-time speed variations automatically.
- Stays impossibly tight during volatile breakouts.
- Smooths out perfectly when volume dries up.
Catch Extreme Volatility Reversals.
Fixed-width channels are a death trap in volatile markets. Devils Bands utilize ATR to push the outer envelopes outward precisely when the market turns violent, preventing premature entries and letting you catch the true exhaustion "snapback" where institutional players fade the move.
- Adjust the ATR Multiplier to match your target asset's personality.
- Visually confirm when the market is mathematically overextended.
- Take highly probable mean-reversion trades with perfectly defined risk.

Dictate Your Own Logic.
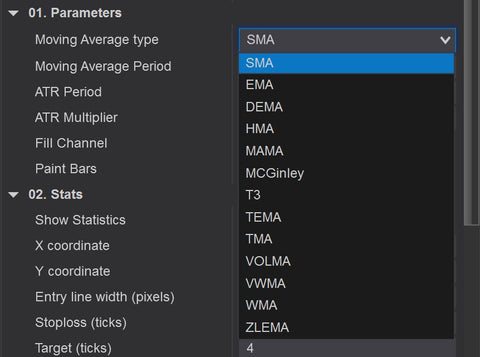
You aren't locked into a single rigid formula. Select from 14 distinctive moving average types—from standard EMAs to advanced McGinley formulas—giving you total control to sculpt the exact trend channel behavior that fits your unique trading timeframe and asset class.
- Instantly swap core calculation logic on the fly.
- Fine-tune period length and channel sensitivity.
- Works perfectly across Time, Tick, Range, and Renko charts.
Filter Out The Chop.
Protect your account from range-bound meat grinders. Toggle the "No Trade Zone" visual overlay and rely on aggressive slope color changes to read trend health instantly, allowing you to sit out the garbage action and protect your mental capital for when real edge appears.
- Receive instant alerts when price closes outside the bands.
- Centerline colors shift dynamically to indicate trend strength.
- Avoid executing when the channel compresses into a flatline.

The Nerd Vault
Engineered to ride long-standing trends via the centerline, or aggressively catch the "snap back" reversals off the outer bands.
Select from 14 distinct mathematical formulas, including EMA, SMA, and the highly advanced McGinley Kinematic algorithm.
Zero-lag performance guaranteed across Futures, Forex, Crypto, and Stocks, seamlessly integrating into Time, Tick, or Renko charting.
Channel boundaries expand and contract intrinsically using True Average Range multipliers, removing fixed-width constraints.
Identify flat conditions with the optional 'No Trade Zone' and dynamic slope color rendering.
Configure custom audio alarms whenever the closing price fully breaches the outer band envelope.
Ready to automate? This indicator includes specific C# data plots that export directly into system memory, allowing instant connection to Bloodhound, BlackBird, or custom NinjaTrader quantitative models.
- Band Touches: Explicit boolean triggers when price impacts the Lower or Upper volatility bands.
- Mid-Band Crosses: Emits a directional signal (+1/-1) the moment price structurally fractures the centerline.
- Entry Signals: Pre-filtered Long and Short entry conditions piped directly into your execution engine.
- 01-jun-2022 (v1.0.0.4) - Added option to render a "No Trade Zone." Added audio/visual alerts when price closes completely outside the Devils Bands.
- 12-dec-2021 (v1.0.0.3) - Integrated 14 unique types of moving averages into the core logic. Added dedicated Long/Short Bloodhound signal plots.
- 08-mar-2021 (v1.0.0.2) - Hotfix: Resolved layering issue where background gridlines disappeared upon indicator initialization.
Frequently Asked Questions
Everything you need to know about licensing, platform architecture, and trials.
General Info & Trials
Licensing & Billing
Platforms & Technical
Tools & Automation
Hardware & Specs
Ready to Automate Your Edges?
Stop drawing. Start executing.