
Master Every Market Reversal With Absolute Precision Using Real-Time, Automated Fibonacci Clusters That Instantly Reveal Institutional-Grade Support And Resistance Zones.
Your Fib Levels Aren't Wrong. Your Timing Is.
Most traders understand that Fibonacci retracements (like the 50%, 61.8%, and 65%) act as gravitational magnets for price action. The math works. The execution is where you fail.
You spend precious minutes manually zooming out, dragging anchors from swing high to swing low, trying to find the exact pivot point. By the time your lines are drawn, the market has already reacted to the zone. You are left chasing the move, completely blind to the real-time structural shifts.
The Auto Fibs Indicator destroys manual drawing fatigue. It systematically identifies high-probability swing points and dynamically plots the true Fibonacci math directly onto your chart, updating tick-by-tick. Professional traders like Sam from TradeDevils, Tim from EminiMind, and David Halsey from EminiAddict base entire strategies around these exact mathematical zones.
Stop second-guessing your anchor points. Stop cluttering your screen with broken levels. What you get is instant, automated precision—highlighting only the zones that matter right now, so you can focus entirely on your trigger.
You're Drowning in Lines.
We Map The Institutional Math.
Retail traders waste time drawing static levels that break. Professional systems react to dynamic flow. Step out of the noise.
Manual Drawing is Dead
You lose your edge the moment you start fumbling with chart tools. Trying to subjectively pick the "right" swing high and low leaves you frustrated, inconsistent, and late to the trade.
Chart Paralysis
You draw so many retracements and extensions that your screen looks like a spiderweb. With too many obsolete, broken levels staring back at you, identifying the true institutional defense zone becomes impossible.
Algorithmic Precision
The Auto Fibs tool mathematically identifies verified swings and instantly plots the high-probability zones. It auto-hides broken levels and organizes data into clean clusters so your chart remains pristine.
Watch Once & NEVER Guess A Turning Point.
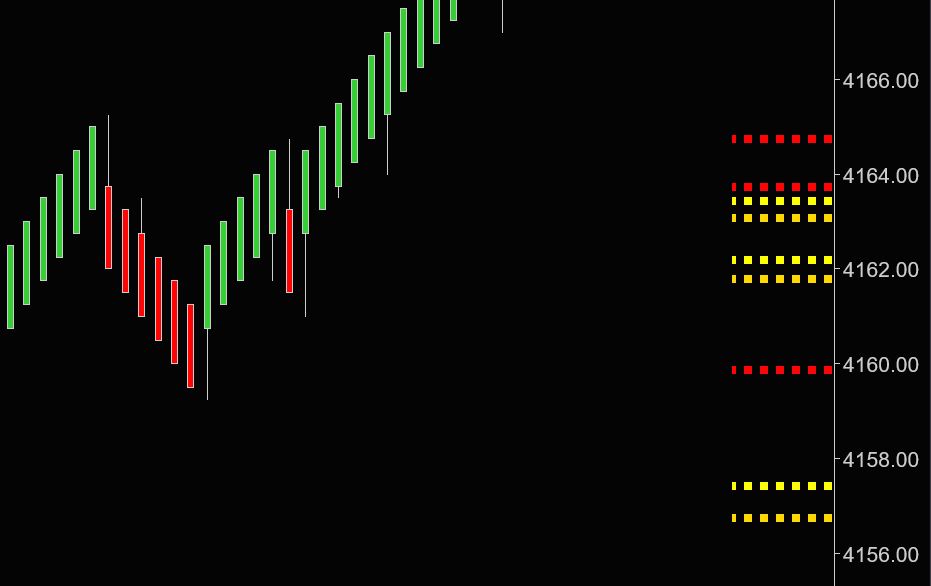
Raw Output: Dynamic Fibonacci Clusters Keeping the Price Action Clean.
The Architecture Of The Indicator
Everything you need to automate your retracements, packed into one zero-lag C# tool.
Eliminate Drawing Fatigue
Stop manually dragging anchor points. The algorithms instantly scan previous price action and plot the exact high-probability zones, so you can stop playing charting technician and start executing like a trader.
Keep Charts Pristine
Deploy the "Smart-Hide" engine. The indicator automatically deletes levels that have been broken and invalidated by the market, so you only see the mathematically relevant defense lines blocking your immediate path.
React To Market Flow
Levels adjust on a tick-by-tick basis. As the market forms new structure, the Fib zones immediately adapt, ensuring you never accidentally trade off stale data from an old, invalidated swing point.
Professional Clustering
Collapse horizontal lines into organized data clusters on the right side of your chart. Thicker lines equal heavier confluence, giving you a split-second visual cue of institutional weight without overlapping your raw price action.

Automate Your Anchor Points.
Stop hunting for the perfect swing high or low. The indicator mathematically scans the entire trend and automatically snaps to the most significant pivots, so you can trust your 50% and 61.8% levels reflect true market geometry, completely removing subjective human bias.
- Plots both standard retracements and forward extensions.
- Calculates the most mathematically pure swing pivots instantly.
- Eliminates time-wasting manual tool selection during fast moves.
Eradicate Screen Clutter.
A chart with too many lines is worthless. Our smart logic automatically tracks price interaction and instantly hides Fibonacci levels once they are decisively broken, ensuring you don't get trapped taking a setup off a level that the institutional algorithms have already destroyed.
- Focus purely on the immediate levels closest to current price.
- Never hesitate staring at a "spiderweb" of old retracements.
- Customize exactly which standard and custom levels remain visible.

Institutional-Grade Clarity.
Free up your price action entirely. The exclusive Cluster Mode consolidates all critical Fib zones into a streamlined heat-map on the right margin of your chart. When multiple levels converge, the cluster thickens—giving you an immediate visual command of massive support and resistance zones before price gets there.
- Read deep confluence without drawing a single line over candles.
- Visually gauge the mathematical "weight" of an upcoming level.
- Maintain absolute chart cleanliness for order flow reading.
The Nerd Vault
Algorithms continuously scan and plot retracements/extensions without lag.
Broken or invalidated Fibonacci levels are automatically hidden to preserve chart clarity.
Consolidates overlapping levels into dynamic visual clusters on the chart edge.
Fully functional across Stocks, Futures, Forex, and Crypto pairs.
Adapts flawlessly to Renko, Tick, Range, Volume, or standard Time-based charts.
Filter logic allows you to strictly display levels closest to the current trading price.
For advanced quantitative traders, this indicator exports critical geometric coordinates directly into memory, allowing your automated systems to trade standard Fibonacci pulls natively.
- Dynamic Level Values: Outputs the exact Y-axis price data of active 50%, 61.8%, 65%, and -23.6% levels.
- Broken State Validation: Access the internal logic state to verify whether a specific retracement level has been breached.
- Cluster Confluence: Native arrays pass data to custom C# or Bloodhound systems to measure "weight" based on level overlap.
- 10-Jan-2024 (v2.1.0.0) - Enhanced clustering logic to prevent visual overlap on ultra-fast tick charts.
- 15-Mar-2023 (v2.0.0.0) - Major overhaul introducing the "Smart-Hide" engine for broken levels.
- 01-Aug-2021 (v1.0.0.0) - Initial core release of the Auto Fibs Indicator architecture.
Frequently Asked Questions
Everything you need to know about licensing, platform architecture, and trials.
Installation & Setup
2) Ensure you are running Sierra Chart version 2555 or higher to support our advanced logic.
3) Once granted access, go to Studies -> Click on Add Custom Study -> Add the "TDU AutoFibs" to your chart.
General Info & Trials
Licensing & Billing
Hardware & Specs
Ready to Automate Your Edges?
Stop drawing. Start executing.