
Automate Fibonacci Levels For Precise Reversal Timing And Total Market Clarity.
You're Missing The Reversal Because Your Fibs Are A Mess.
Most traders know that institutions defend the "Golden Zones"—the 50% and 61.8% retracement levels. So why are you still getting stopped out when trying to trade them?
Because you are anchoring your Fibonacci tools manually. In the heat of live volatility, your eyes get tricked. You drag from a subjective swing high to a subjective swing low. Two ticks off at the anchor point means you are entirely blind to where the actual algorithmic liquidity lies.
Worse, your chart quickly becomes a graveyard of old, broken lines. A spiderweb of obsolete retracements clutters your screen, causing paralysis by analysis right when you need absolute clarity.
The Auto Fibonacci Indicator solves this permanently. It identifies the true mathematical swing points, plots the precise retracements and extensions tick-by-tick, and automatically deletes lines the moment they are broken. You get institutional-grade mapping without the manual guesswork.
Stop Guessing Swings.
Trade Algorithmic Clusters.
Elite pros base their strategies on precise mathematical geometry. It's time to stop drawing by hand and let the code do the heavy lifting.
Subjective Anchors
You drag your Fibonacci tool across the chart based on gut feeling. This inconsistency means you're trading off levels that the broader market simply doesn't recognize.
Paralysis By Clutter
After an hour of trading, your screen is covered in conflicting diagonal and horizontal lines. You can't tell which extensions are fresh and which were invalidated 30 minutes ago.
Tick-By-Tick Geometry
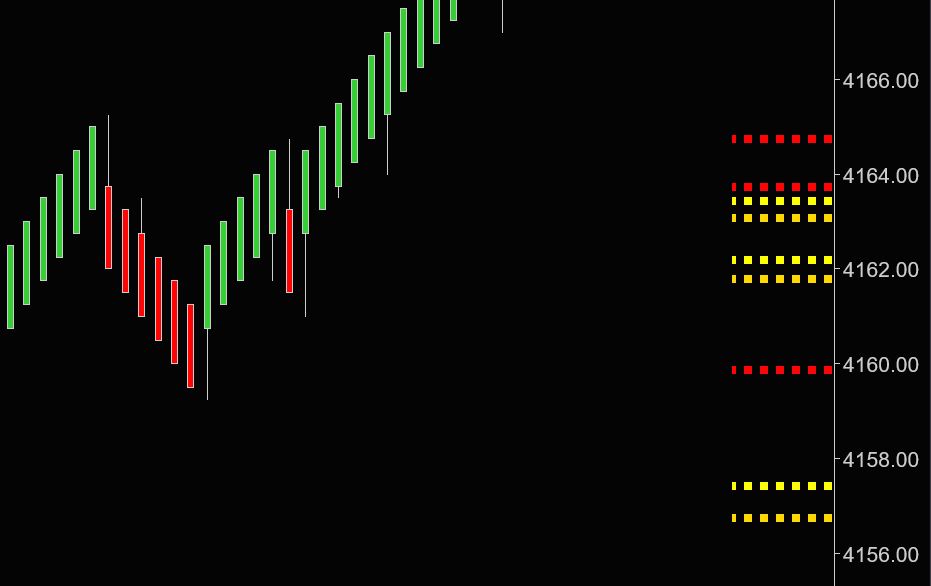
The software maps perfect retracements dynamically, hides invalidated levels instantly, and exposes heavy Fibonacci 'Clusters' on the right-hand margin for extreme clarity.
Watch Once & NEVER Draw A Fib Again.
Raw Output: Mathematical Fibonacci Clusters & Clean Chart Geometry.
The Architecture Of The Indicator
Everything you need to automate your structural geometry, packed into one zero-lag C# tool.
Auto-Plot Retracements
The algorithm identifies structural swing points and draws key retracements and extensions instantly, so you can completely eliminate manual drawing fatigue and trade with objective precision.
Dynamic Chart Clean-Up
The system tracks price tick-by-tick and automatically hides Fibonacci levels the moment they are broken or invalidated, ensuring your charts remain crystal clear so you never execute on obsolete data.
Fibonacci Cluster Technology
Push messy lines off the chart and view dense price confluences grouped neatly on the right margin, allowing you to visually identify the strongest reversal zones at a single glance.
Proximity Support & Resistance
Goes beyond standard Fibs to plot critical, active S&R zones directly around the current price action, giving you immediate targets to manage entries, scale-outs, and trailing stops efficiently.
Trade High-Value Confluences.
When multiple Fibonacci extensions and retracements overlap, they create a magnetic reversal zone. The "Cluster" view groups these directly on your Y-axis margin. The thicker the line, the stronger the institutional confluence, so you can stop guessing and only deploy capital at the market's heaviest structural boundaries.
- Remove on-chart line clutter entirely.
- Line thickness dictates mathematical level strength.
- Identify overlapping macro and micro extensions instantly.
Catch The Deep Retracements.
Elite traders rely heavily on the 50% and 61.8% pullbacks. The Auto Fib constantly hunts for these golden zones based on dynamic market swings. This gives you the ultimate framework to anticipate high-probability pullbacks in a trending market without spending a second drawing a line.
- Levels update and adapt tick-by-tick.
- Broken levels are deleted to prevent bias.
- Works flawlessly on tick, renko, and time-based charts.

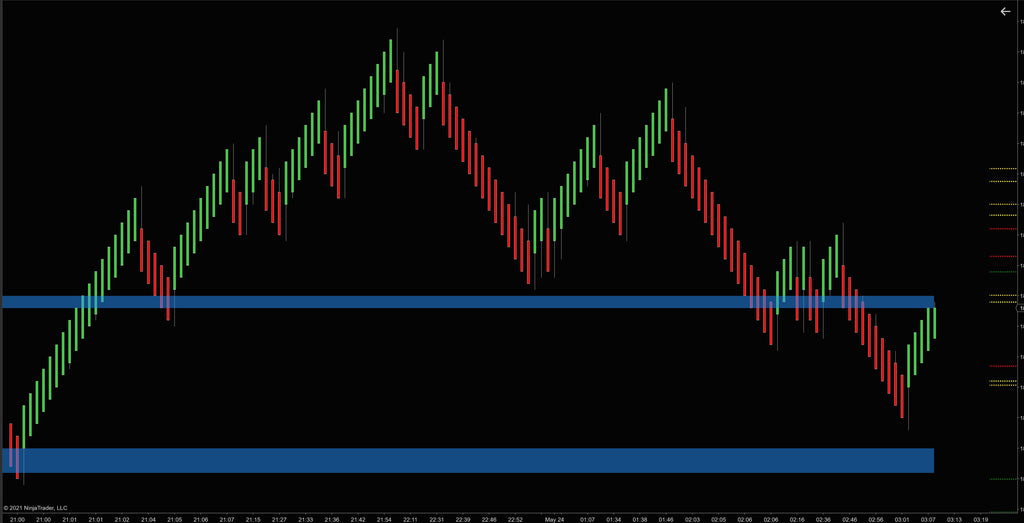
Anticipate Dynamic Resistance.
In addition to raw Fib levels, the system identifies structural Support & Resistance. To keep your focus razor-sharp, the indicator only renders the 3 closest zones above and below the current price action, allowing you to manage your immediate trade risk without staring at historical levels from three days ago.
- Focus only on immediate actionable zones.
- Perfect for trailing stops behind validated walls.
- Dynamic proximity adjustments as price moves.
Command Your Charts With Hotkeys.
Speed is your edge. We built native hotkeys directly into the indicator. Tap `ALT+F` to toggle standard extensions, or `ALT+C` to instantly summon the Cluster view, giving you the ability to check the macro structure and clear your view in a fraction of a second before hitting the buy button.
- ALT+F: Show/Hide standard retracements.
- ALT+C: Show/Hide Fib Cluster margins.
- Never click through clunky settings menus again.

The Nerd Vault
Automatic detection of Fibonacci retracements and extensions based on algorithmic swings.
Instantly deletes "broken" or invalidated levels to keep the UI perfectly clean.
Unique right-margin plotting to avoid line clutter, scaling thickness based on confluence.
Only renders S&R levels immediately near the current price action (configurable up to 3 above/below).
Works flawlessly across any instrument (Stocks, Futures, Forex) and bar type (Tick, Renko, Minute).
ALT+F (Toggle standard lines) and ALT+C (Toggle clusters) for instant workspace control.
For advanced quantitative traders, the Auto Fib Indicator exposes underlying structured data to the platform, ready to be digested by custom NinjaScript logic or Bloodhound systems.
- Golden Zone Arrays: Exposes the exact Y-axis price values of major structural levels (38.2%, 50%, 61.8%).
- Cluster Strength Tracking: Programmatically identify when price action enters a "thick" confluence margin.
- Real-Time Invalidation: Levels emit a null/broken state instantly to your strategy once breached, preventing automated systems from firing off outdated levels.
- 12-may-2024 (v1.0.1.2) - Performance updates to tick-by-tick clustering algorithm for high-volatility environments.
- 14-mar-2023 (v1.0.0.5) - Introduced ALT+F and ALT+C hotkey rendering for rapid visibility toggling.
- 21-may-2021 (v1.0.0.0) - Initial core release of the Auto Fibonacci and Cluster structural framework.
Frequently Asked Questions
Everything you need to know about licensing, platform architecture, and trials.
General Info & Trials
Licensing & Billing
Platforms & Technical
Tools & Automation
Hardware & Specs
Ready to Automate Your Edges?
Stop drawing. Start executing.