
Master Market Momentum With Color-Coded Precision For Total Entry Confidence.
You Aren't Catching Trends. You're Chasing Them.
Most traders get chopped up because their momentum indicators are inherently flawed. They rely on smoothed, heavily lagging moving averages that tell you what happened ten bars ago instead of what is happening right now.
You see the MACD cross. You enter the trade. Then the market immediately stalls, and you realize you just bought the absolute top. The "momentum" you saw was just the echo of a move that has already exhausted itself.
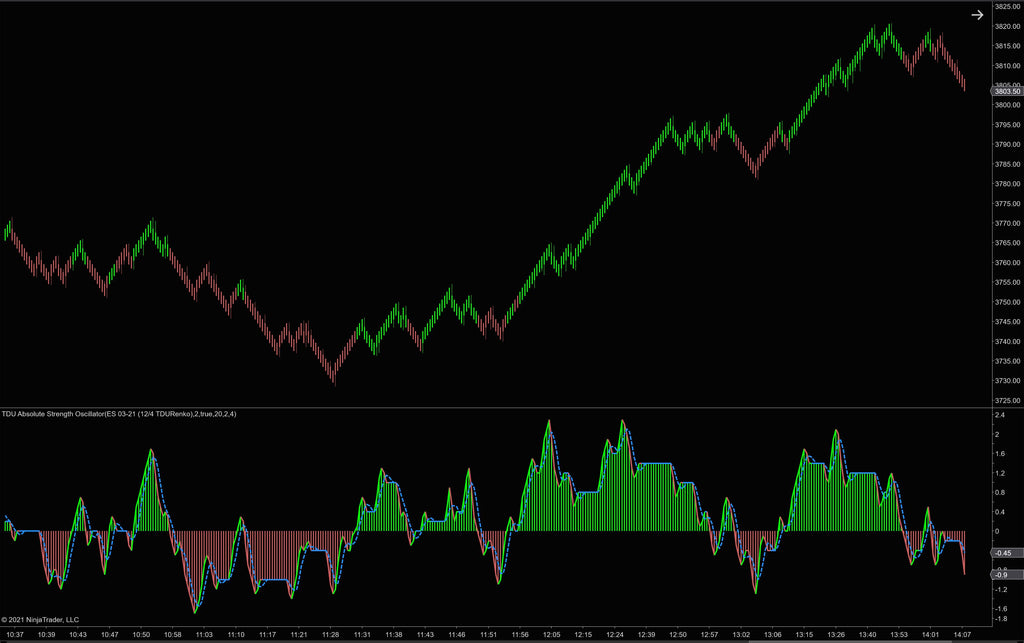
The Absolute Strength Oscillator solves this by measuring raw, unadulterated price aggressiveness in real-time. It strips away the lag and compares immediate price action against recent history to show you the true "engine" of the market.
When the histogram fires, you aren't guessing if the trend has gas left. You see exactly how much institutional pressure is behind the move right now, allowing you to enter with conviction or stay out of weak, fakeout breakouts.
You're Trading Echoes.
We Measure True Institutional Force.
Standard oscillators average out the data so heavily that by the time you get a signal, the smart money is already taking profit. Stop being the last one to the party.
Relying on Lagging Math
You rely on secondary data points that look backward instead of forward. When your typical indicator finally confirms a trend, the actual momentum of the move has already dissipated.
Buying Exhausted Breakouts
You pull the trigger right as the trend runs out of gas. You watch in frustration as price reverses immediately, trapping you in a position that had no real momentum behind it to begin with.
Real-Time Strength Verification
The Absolute Strength Oscillator measures pure, aggressive price momentum. It clearly displays exactly when a trend is accelerating or dying, so you only trade high-probability thrusts.
See The Pulse of the Market.

Raw Output: Objective Trend Strength & Reversal Exhaustion Identified Live.
The Architecture Of The Indicator
Everything you need to automate your momentum analysis, packed into one zero-lag C# tool.
Spot Institutional Pressure
Stop guessing if a breakout is real. The histogram visually separates low-volume retail noise from true institutional buying pressure, so that you only commit capital to moves with actual momentum.
Keep Eyes on Price Action
Don't lose focus by staring at sub-panels. Integrated Paint Bars automatically color-code your main chart's candles based on oscillator strength, so that you instantly recognize momentum shifts without looking away from price.
Trade Any Instrument
Stop buying different tools for different markets. The algorithms dynamically adapt to Futures, Crypto, Stocks, or Forex, so that you can apply the exact same edge across any asset class or timeframe.
Automate The Edge
Built for quants. Export real-time strength data directly into Bloodhound or custom NinjaScript strategies for headless algorithmic execution, allowing you to remove emotion completely and let your systems capitalize on your edge automatically, 24/7.
Measure The Market's Pulse.
Stop relying on intuition. The oscillator measures raw price aggressiveness by combining a proprietary histogram with a responsive moving average, so you know exactly how much "gas" the current trend has left.
- See exactly when a trend is gaining momentum or losing steam.
- Filter out weak chops and consolidation zones.
- Avoid entering trades too late in the move.
React Instantly With Paint Bars.
Stop checking multiple sub-charts. The indicator directly alters the color of your main price candles to reflect underlying strength, ensuring you process momentum shifts visually the millisecond they happen.
- Keep your focus entirely on the main price action.
- Visually sync your chart with the oscillator's hidden signals.
- Execute faster when the bar color verifies a momentum shift.

Dominate Non-Standard Charts.
Break free from time-based noise. The underlying math perfectly scales to Tick, Volume, Range, and even Renko charts, allowing you to strip out the chop and track pure structural momentum in any trading environment.
- Auto-scales automatically when you switch timeframes.
- Compatible across Futures, Crypto, Stocks, and Forex.
- Find high-probability setups outside of standard minute bars.
Avoid Reversal Traps.
Protect your capital from sudden changes in direction. The visual histogram makes it blatantly obvious when strength is waning, giving you the exact signals you need to tighten stops and exit before the market rolls over.
- Identify momentum divergence before price reacts.
- Lock in profits when the engine runs out of gas.
- Anticipate major reversals with mathematical certainty.

The Nerd Vault
Quickly see the intensity of the current market move directly below your main chart.
Focuses entirely on raw price aggression rather than lagging secondary data smoothing.
Visually syncs your main chart's candles with the oscillator signals to eliminate split-attention.
Operates flawlessly on Futures, Forex, Crypto, Stocks, and Options markets.
Fully compatible with standard Time bars as well as Tick, Volume, Range, and Renko bars.
Automatically adjusts its core calculations whenever you switch asset classes or timeframes.
For advanced quantitative traders, this indicator exports raw plot data directly into memory, ready to be digested by NinjaScript strategies or Bloodhound logic trees.
- Raw Oscillator Value: Outputs the exact numeric integer of the histogram strength at the close of every tick or bar.
- Moving Average Signal: Continuously tracks the overlay moving average to determine if the trend is accelerating or decelerating.
- PaintBar Color State: Emits a signal (+1 for bullish strength, -1 for bearish strength) allowing auto-execution precisely when the candle changes color.
- 26-feb-2025 (v1.0.0.3) - Added extra raw data plots for enhanced integration into automated strategies and Bloodhound.
- 05-nov-2024 (v1.0.0.0) - Initial core release of the Absolute Strength Oscillator architecture.
Frequently Asked Questions
Everything you need to know about licensing, platform architecture, and trials.
General Info & Trials
Licensing & Billing
Platforms & Technical
Tools & Automation
Hardware & Specs
Ready to Automate Your Edges?
Stop guessing. Start executing.