
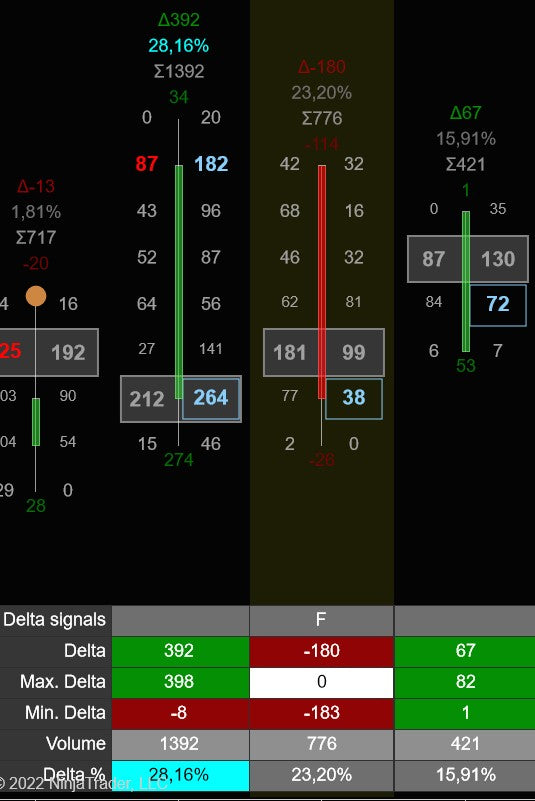
Auto Orderflow Footprint Trader
The most powerful automated orderflow trading strategy for NinjaTrader 8. Toggle from 21 built-in footprint signals, click together custom strategies in the visual signal designer, or write your own in C# — then let the strategy trade for you.

“This is the best footprint software trader out there. Period. I love it. It was just what I needed.”
1. What Is This?
Imagine never missing another orderflow setup. The Auto Orderflow Footprint Trader is a fully automated NinjaTrader 8 strategy that reads real-time orderflow data — delta, volume at price, POC, value area, imbalances — and places trades the moment your conditions are met. No more staring at charts all day. No more missed entries because you looked away for 30 seconds.
You tell it exactly what setups to look for. You configure your risk. You arm it. Then you go live your life while it watches every single bar for you — and pulls the trigger when the market shows you what you've been waiting for.
For Discretionary Traders
You already know your setups — delta traps, stacked imbalances, exhaustion prints at swing highs. But you can't watch every bar of every session. Toggle on the signals you trade, add a volume or delta filter, set your stop loss and targets, and the strategy does the rest. Start with the 21 built-in signals — they're ready to trade out of the box. Fine-tune with filters. Or go grab a coffee and let it run.
For Strategy Builders
You want to test ideas systematically — and you want access to real orderflow data, not just price and volume. The visual signal designer lets you build multi-condition entry rules without code: combine any of 120+ orderflow data points with AND/OR logic, time filters, swing levels, and bar patterns. If you know C#, go wild — you get full programmatic access to every metric. Then backtest it all in NinjaTrader's Strategy Analyzer.
“Excellent way to use with combinations. I love that I can manual trade and if I need to step out for a few minutes I will turn this on. Plus you can also test your skills with it.”
2. Built-in Trading Signals
The fastest way to get started — and honestly, most traders never need anything beyond these. The strategy ships with 21 battle-tested orderflow signals that you can toggle on or off with a single click. No configuration, no learning curve. Just pick the ones that match how you read the market.
Each signal detects a specific orderflow pattern — delta divergences, trapped traders, exhaustion at extremes, institutional sweeps, and more. Enable one signal for a focused strategy. Enable five and combine them for multi-confirmation entries. The choice is yours.
Delta Signals

Delta Rise
A 4-bar signal that detects a sudden increase in delta where each successive bar has stronger delta than the previous. Buyers (or sellers) are gaining control and the market may be starting to trend.
Detection Rules
- 4 consecutive bars with increasing delta
- Bullish: e.g. delta −461, +119, +429, +620
- Bearish: 4 bars with increasingly negative delta

Delta Drop
The opposite of Delta Rise. A 4-bar signal detecting decreasing delta — each bar has weaker delta than the last. The current trend is losing steam.
Detection Rules
- 4 consecutive bars with decreasing delta
- Example: delta +596, +13, −109, −130

Delta Divergence
A reversal signal. Detects when price direction and delta direction disagree. Only triggers when the bar is the highest or lowest within the configured lookback period.
Three Modes
- Candle Color vs Delta: Red bar + positive delta (bearish), green bar + negative delta (bullish)
- Candle High/Low vs Delta: New high with negative delta & red bar, or new low with positive delta & green bar
- Session High/Low vs Delta: Same as above but compares against session extremes

Delta Price Divergence
Compares delta direction against price direction within the same bar. When they move in opposite directions, the visible price action isn't supported by underlying order flow.
Detection Rules
- Bullish: Negative delta but price closed higher — hidden buying
- Bearish: Positive delta but price closed lower — hidden selling
Delta Flip
Captures a sudden, complete shift in market sentiment across two bars. One bar is dominated by one side, the next by the other — a clean handoff of control.
Detection Rules
- Bullish: First bar closes at min-delta, next bar closes at max-delta
- Bearish: First bar at max-delta, next at min-delta

Delta Tail
Reveals absorption at the bar's extreme. Diagonal delta is one-directional at all levels except one — a "tail" of opposite delta at the edge where price reversed. Shows exactly where a buyer or seller stepped in.
Detection Rules
- Bullish: Positive diagonal delta at the low, negative at all other prices
- Bearish: Negative diagonal delta at the high, positive at all other prices

Delta Reversal
Identifies high-energy bars where both buyers and sellers fought aggressively — extreme intrabar delta swings in both directions. A genuine tug-of-war that often marks turning points.
Detection Rules
- Bar's max delta exceeds the running average of previous bars' max deltas
- Bar's min delta (absolute) exceeds the running average of previous bars' min deltas
- Both must be true simultaneously

Delta Trap
Catches a classic market trick: a pullback that lures counter-trend traders in, then reverses to continue the original trend. Trapped traders are forced to cover, adding fuel to the move.
Detection Rules
- Bullish 3-bar: Red bar with strong negative delta → 2 green bars that outweigh it → value area gap up
- Bearish 3-bar: Green bar → 2 red bars → value area gap down
- 4-bar variant: Adds a "pause" bar between initial and confirmation

Delta Sweep
Detects aggressive institutional entries that clear multiple price levels in a single bar. A large trader sweeps through thin areas of the order book with heavy delta.
Detection Rules
- Bullish: Green bar with a market sweep and strong positive delta
- Bearish: Red bar with a market sweep and strong negative delta

Delta Slingshot
Captures dramatic momentum reversals. Price stretches in one direction with extreme delta, then snaps back with even stronger force. Detected in 2-bar, 3-bar, and 4-bar variants.
Detection Rules
- Bullish (2-bar): Red bar with extreme negative delta → green bar closes above the red bar's high
- 3/4-bar: Adds intermediate bars before the snap-back
- Bearish: Mirror of the above
POC & Value Area Signals

Above / Below POC
Very powerful at new swing lows or highs. When both Open and Close sit on the same side of the POC, the dominant side is clearly in control.
Detection Rules
- Bullish: Open and Close both above POC
- Bearish: Open and Close both below POC

Bullish / Bearish POC
Reveals the power dynamic inside a bar. When the most volume is at the extreme opposite to the close, aggressive traders stepped in and prevented further movement.
Detection Rules
- Bullish: Green bar with POC in the lower portion (configurable levels from low, default 3)
- Bearish: Red bar with POC in the upper portion
- Optional lookback period filter

Continuous POC
Identifies price levels where the market finds fair value across multiple bars. When 2+ consecutive bars have their POC at the same price, the market is accepting that level as an equilibrium point.
Detection Rules
- 2+ consecutive bars with POC at the same price level

Value Area Gap
One of the strongest directional signals. Zero overlap between current and previous bar's value areas — the market completely shifted where it finds fair value.
Detection Rules
- Bullish: Current value area entirely above previous
- Bearish: Current value area entirely below previous
Imbalance & Volume Signals

Stacked Imbalances
3 or more consecutive price levels with imbalances in the same direction. Indicates concentrated institutional activity in a narrow range, often forming strong support/resistance.
Detection Rules
- 3+ consecutive levels with buy or sell imbalances
- Configurable minimum stack size (default: 3)
- Location filter: all, top, or bottom of bar

Exhaustion Prints
Detects when a move is running out of steam at its extreme. One of the most reliable reversal signals in order flow trading.
Detection Rules
- Bearish: Red candle with almost no ask volume at the high — buying exhausted
- Bullish: Green candle with almost no bid volume at the low — selling exhausted

Volume Sequencing
Reveals institutional accumulation in real time. Ask or bid volume at each successive price level is increasing — a staircase pattern showing large players aggressively building a position.
Detection Rules
- Bullish: Ask volume at each higher price is increasing (e.g., 100, 150, 200, 250)
- Bearish: Bid volume at each lower price is increasing

Trapped Traders
Identifies participants stuck on the wrong side. When they eventually close, they create additional momentum in the opposite direction.
Detection Rules
- Bullish: Green bar where most volume was at the bottom — sellers trapped
- Bearish: Red bar where most volume was at the top — buyers trapped

Thin Prints
Levels where very little volume was traded (below a configurable threshold). Price moved through quickly — these "weak" levels often get revisited later.
OFT7 Advanced Signals

POC Momentum Wave
Tracks whether the POC is consistently moving in one direction across consecutive bars. A 3-bar pattern that confirms trend direction using volume distribution rather than price alone.
Detection Rules
- Bullish: POC dips then recovers — volume shifting higher
- Bearish: POC pops then drops — volume shifting lower

Bid/Ask Fade
Detects when volume on one side diminishes across consecutive price levels at the bar's extreme — the losing side is withdrawing.
Detection Rules
- Bullish: Green bar where bid volume at the bottom 3 levels is declining — selling fading
- Bearish: Red bar where ask volume at the top 3 levels is declining — buying fading

Passive Absorption
Above-average volume at the bar's extreme that tapers inward. Passive limit orders are absorbing aggressive market orders — a large player is defending a price level.
Detection Rules
- Bullish: High bid volume at the low, strictly decreasing upward
- Bearish: High ask volume at the high, strictly decreasing downward
- Configurable min levels (default: 4) and min edge volume
“It certainly helps to reduce the stress as it simply takes the trade you tell it to take.”
3. Control Panel — Your Mission Control
Everything you need to control the strategy lives in one place. No digging through property menus, no restarting, no guesswork. The control panel gives you instant access to every setting that matters — and every change takes effect immediately, in real time, while the strategy is running.
Think of it as the cockpit for your trading. You can enable and disable signals with a single click. You can switch from trend-following to mean-reversion mode in half a second. You can tighten your filters, flatten all positions, or adjust your stop loss — all without ever touching the NinjaTrader properties dialog.

Where It Lives
Chart Trader (Default)
The control panel docks right inside NinjaTrader's built-in Chart Trader panel — the same panel you're already used to. Open it via right-click → Chart Trader (or Ctrl+T). The auto trader controls appear below the standard order entry buttons. Everything in one place, right next to your chart.
Separate Window
Prefer a standalone panel? Set the Order Panel property to “Separate” and the control panel opens as its own resizable, draggable window. Put it on a second monitor, dock it next to your chart, or keep it wherever works best for your workflow.
The Workflow: Enable → Combine → Filter → Trade
Here's how everything fits together. Understanding this workflow is key to getting the most out of the strategy:
1. Enable Signals
Pick which orderflow patterns to watch for. Toggle any combination of the 21 built-in signals and 16 custom slots.
2. Combine Them
Choose how signals work together: Any, Many, or All must fire before a trade triggers.
3. Filter
Add volume, delta, time, and bar-age filters to remove weak signals and only trade high-conviction setups.
4. Trade
Arm the strategy. It watches every bar and executes the moment all your conditions line up.
Every single step in this pipeline is configurable from the control panel — no restarts, no property dialogs. You can go from “I want to try Delta Trap + Exhaustion Prints with minimum 500 delta” to a live running strategy in about 10 seconds.
Quick Action Buttons
The top row of the panel gives you instant control over the strategy's core behavior:
Run / Pause
The most important button. Cycles through three states: Paused (gray — strategy is watching but not trading), OneShot (takes exactly one trade, then auto-pauses — great for testing), and Continuous (green — full autopilot, trades every valid signal). You can pause and resume anytime without losing your configuration.
Market Type
Switches between Trending (orange) and Ranging mode. In Trending mode, bullish signals go long and bearish signals go short — as you'd expect. In Ranging mode, all signal directions are inverted: bullish signals go short, bearish go long. This turns your trend-following setup into a mean-reversion strategy with one click. Powerful for choppy, sideways markets.
Long / Short Toggles
Two independent buttons that control trade direction. Want to only take longs during an uptrend? Disable the Short button. Want to be short-only into a selloff? Disable Long. Both green = trade both directions. Gray = disabled. Simple, instant, no restart needed.
Signal Combination Mode
Controls how your enabled signals work together. Cycles through: Any (at least one signal fires → trade), Many (a configurable minimum number of signals must fire simultaneously), All (every single enabled signal must fire on the same bar). “All” mode with 3-4 signals enabled creates incredibly precise, multi-confirmation entries.
Break Even
Emergency button. One click immediately moves every open trade's stop loss to its entry price. Useful when you see something on the chart you don't like and want to protect your capital right now, without waiting for the automatic break-even trigger.
Close All
The nuclear option. Cancels every pending order and submits market exit orders for all open positions. Flattens everything instantly. Useful before news events, end-of-session, or any time you want to step away with zero risk.
ATM Settings Editor
Opens a popup window with every trade management setting you might want to adjust on the fly — position sizing, stop loss type and distance, break-even trigger, take-profit target, trailing stop type and trigger, daily profit/loss limits, session filter, weekday filter. All editable in real time. All without opening the NinjaTrader properties dialog. This is the same settings you configure when first adding the strategy, but accessible anytime from the panel for quick adjustments.
Signal Filter Inputs — Fine-Tune Your Edge
Enabling signals is step one. But the real power comes from filtering. These editable fields sit right on the control panel and let you eliminate weak signals in real time. Every filter applies on top of your signal selection — a signal must fire AND pass all active filters before the strategy will trade.
Min. Bars (Signal Age)
Sets how recent a signal must be. If you set this to 3, the signal must have fired within the last 3 bars. A delta trap that happened 10 bars ago? Ignored. This keeps your entries timely and prevents the strategy from acting on stale signals that are no longer relevant to current price action. Lower values = more selective. Higher values = more flexible.
Min. Delta (Absolute)
The minimum absolute delta required on the signal bar before the strategy will act. Delta is the difference between aggressive buying and selling volume. A bar with only 50 delta might be noise. A bar with 400+ delta shows real conviction. Set this to filter out weak, indecisive bars and only trade when there's genuine directional pressure behind the signal. Higher values = fewer but stronger entries.
Min. Volume
Minimum total volume (bid + ask) required on the signal bar. Low-volume bars produce unreliable signals — a “delta divergence” on a bar with 20 contracts means almost nothing. Setting a minimum volume threshold ensures every trade is backed by meaningful market participation. Adjust this based on your instrument: ES might need 500+, MNQ might work with 100+.
Min. Delta %
Delta as a percentage of total volume. This is a relative strength filter. A bar with 300 delta and 10,000 volume has 3% delta — not very decisive. A bar with 300 delta and 600 volume has 50% delta — extremely one-sided. This filter catches bars where one side is clearly dominant, regardless of the absolute numbers. Great for identifying bars where the crowd really committed to one direction.
Min. Signals (Many Mode)
Only visible when the combination mode is set to Many. Sets the minimum number of enabled signals that must fire on the same bar. If you have 8 signals enabled and set this to 3, at least 3 of those 8 must trigger simultaneously before the strategy will trade. This is the middle ground between “Any” (too loose for some traders) and “All” (too strict). Adjustable on the fly — dial it up for precision, dial it down for more entries.
Signal Tabs
“Standard” Tab — 21 Built-in Signals
A grid of toggle buttons for all 21 built-in orderflow signals. Click any button to flip it on or off. Green = enabled, gray = disabled. Changes take effect immediately — no restart, no confirmation dialog. You can enable Delta Divergence, disable Delta Rise, and add Stacked Imbalances all in about 2 seconds. The strategy immediately starts watching for your new combination.
“Custom” Tab — 16 Custom Slots
Each slot shows a toggle button with the template name (or “Untitled”) and a pencil icon that opens the visual signal designer for that slot. Load a .fpalgo template, enable the slot, and your custom strategy runs alongside the built-in signals. You can mix and match — 3 built-in signals plus 2 custom templates, all working together through the same combination and filter pipeline.
“Strategy is top notch and support is second to none. The help from the devs has been immense, answered any queries I've had within minutes.”
4. How It Works
From zero to live trading in three steps. No PhD in quantitative finance required.
1. Choose Your Signals
Toggle any of the 21 built-in orderflow signals on the control panel — or build your own using the visual designer and C# scripting across 16 custom slots. Mix and match built-in and custom signals freely.
2. Set Your Rules
Combine signals using Any / Many / All logic. Layer on volume, delta, and time filters. Choose Trending or Ranging market modes. Dial in exactly how selective you want to be.
3. Let It Trade
Configure your stop loss, targets, trailing stops, position sizing, and risk limits. Arm the strategy and let it work. Or backtest first in NinjaTrader's Strategy Analyzer to see how your setup would have performed on historical data.
Signal Pipeline: Footprint Data → Signal Detection → Signal Combination (Any / Many / All) → Volume & Delta Filters → Risk Filters → Order Execution → Trade Management (SL / TP / BE / Trail)
5. Trade Management
Getting into a trade is only half the battle. What happens after entry — your stop, your target, your trailing logic — is what separates profitable strategies from expensive experiments. This strategy gives you a professional-grade trade management engine that handles everything automatically once you're in a position.
Every signal — whether built-in, visual designer, or C# — feeds into the exact same management pipeline. Configure it once, and it applies to every trade.
6 Stop Loss Types
Previous Bar Hi/Lo, Ticks, Points, Dollars, ATR, or Swing Hi/Lo. Place your stop exactly where it makes sense — with configurable offsets on each type.
6 Trailing Stop Types
Ticks, ATR, Chandelier, Parabolic SAR, Previous Bar Hi/Lo. Lock in profits as the trade moves in your favor. Each with its own activation trigger.
6 Break-Even Types
Ticks, Points, Dollars, ATR, or Risk/Reward. Automatically move your stop to entry once the trade reaches a configurable profit threshold. Eliminate risk on winning trades.
6 Target Types
Ticks, Points, Dollars, ATR, or Risk/Reward. Set independent targets for scalp and runner positions. ATR-based targets adapt automatically to current volatility.
Scalp + Runner
Open two independent positions per signal — a quick scalp for guaranteed profit and a runner to catch the bigger move. Each with its own sizing, target, and trailing stop.
Risk Filters
Daily profit/loss/drawdown limits, session & weekday filters. The strategy auto-stops when your daily limits are hit — so you never give back a good day.
Full configuration details for every feature are in the Documentation section below.
“Functioning is excellent which means there is some astute programming behind the footprint indicator and auto trader.”
See It In Action — Free for 7 Days
Full access to every feature, every signal, every setting. No restrictions, no credit card required.
Start Your Free Trial6. Visual Signal Designer
The 21 built-in signals are powerful on their own. But what if you see a pattern that's uniquely yours — a specific combination of conditions that nobody else has thought of? That's where the visual signal designer comes in. Build your own multi-condition entry rules without writing a single line of code. Click together conditions, test them on historical data, save them as templates, and deploy them live. Your edge, your rules, your strategy.

What You Can Do With It
Most orderflow traders watch for specific patterns — delta divergences, stacked imbalances, exhaustion at swing highs — and trade them manually. That means sitting at the screen all day, watching every bar, hoping you don't miss the setup. The designer lets you describe exactly what you're looking for and have the strategy watch for you. Build rules like:
- "Go LONG when the bar is green AND has a bullish delta trap AND delta is greater than 200"
- "Go SHORT when ask volume is fading at the top 3 levels AND there's a bearish POC AND the bar closed below its value area"
- "Go LONG when delta crosses above 500 AND it's between 9:30 and 11:00 AND the bar is above the swing low"
Each rule becomes a fully automated strategy that integrates with the full trade management engine — stop loss, trailing stop, break-even, targets, position sizing, risk filters — all handled for you.
How It Works
- Open the designer by clicking the pencil icon next to any of the 16 custom signal slots in the control panel's "Custom" tab.
- Add Signal rows — each row has a Long expression and a Short expression.
- Each expression compares a Left field against a Right field using an Operator (e.g.,
Delta > 200,HasBullishDeltaTrap == 1). - Group conditions with AND (all must be true) or OR (any can be true). Nest sub-rules for complex logic.
- Choose a trigger mode: Continuous (fires every bar where the condition is true) or OneShot (fires only on the transition from false to true — edge-triggered).
- Save your template as a
.fpalgofile and load it anytime. Share templates with other traders or switch between strategies with one click.
7 Field Types
Every field on both sides of a comparison can be one of these types:
| Field Type | What You Can Do |
|---|---|
| Orderflow | Choose from 120+ orderflow metrics — Delta, Volume, POC, ValueAreaHigh, DeltaEfficiency, CumulativeDelta, every boolean signal flag, and many more. |
| Direction | Filter by candlestick pattern: Green, Red, Doji, Hammer, Inverted Hammer, Inside Bar, Engulfing Bar (7 patterns). |
| Price | Compare Open, Close, High, Low, BodyTop, BodyBottom, Range, BodyRange against thresholds or other fields. |
| Time | Session-based filtering. Only trigger signals during specific hours. |
| Fixed | Any constant numeric value. Compare a metric against a hard threshold (e.g., Delta > 500). |
| Swing Low | The most recent swing low price with configurable lookback strength. |
| Swing High | The most recent swing high price. Build resistance-level-based entries. |
Every field supports a BarsAgo offset, so you can compare current bar values to any historical bar. For example: Delta > Delta[1] checks if delta is increasing bar-over-bar.
8 Comparison Operators
Crosses Above / Below are multi-bar operators: they check that the left field crossed the right field between the previous bar and the current bar.
120+ Orderflow Data Points
Every data point the footprint engine calculates is available in your rules. You're not limited to the 21 built-in signals — you can access everything:
Numeric Metrics
Boolean Signal Flags
Every built-in signal (and many additional patterns) exposes its detection result as a boolean data point (1.0 = detected, 0.0 = not detected). Combine any orderflow pattern with any other condition:
7. Custom C# Signals
If you have programming experience, this is where it gets really interesting. The strategy gives you full programmatic access to every orderflow metric on every bar. Write your own entry logic in C#, test it on historical data, and deploy it live — all within the strategy's trade management framework.
The visual designer handles most use cases. But some strategies need more — custom calculations, multi-bar pattern matching, dynamic thresholds based on session data, or integration with external indicators. With C# scripting, if you can think it, you can code it. And your code plugs directly into the same trade management engine: stop loss, trailing stops, break-even, targets, position sizing, risk filters.
Two Paths, One Template
Each of the 16 custom signal slots supports two evaluation modes. You choose per slot:
Visual Logic Tree (No Code)
Build conditions graphically using AND/OR rules, field comparisons, and the 120+ orderflow data points. No programming knowledge needed.
C# Script (Full Power)
Write C# code in the code editor tab. If the Code field has content, it takes priority over the visual logic tree. Full access to all bar data and orderflow properties.
How C# Scripts Work
Your script runs once per bar. Three variables are available:
| Variable | Type | Description |
|---|---|---|
CurrentBar | int | Index of the current bar being processed. |
Signal | int | Output variable. Set to 1 for Long, -1 for Short, or 0 for no signal. |
Bars | Dictionary | Dictionary of FootPrintBar objects keyed by bar index. Access any bar's orderflow data: volume, delta, POC, value area, imbalances, and more. |
Example: Delta Reversal Strategy
// Go LONG when: green candle with negative delta (hidden buying)
// Go SHORT when: red candle with positive delta (hidden selling)
if (Bars.ContainsKey(CurrentBar))
{
    var bar = Bars[CurrentBar];
    if (bar.IsGreenBar && bar.Delta < 0)
        Signal = 1;   // Long
    else if (bar.IsRedBar && bar.Delta > 0)
        Signal = -1;  // Short
    else
        Signal = 0;
}
.fpalgo template files. Share templates with other traders or build a library of strategies you can switch between with one click.8. Installation & Setup
Getting up and running takes about 2 minutes. Here's how.
What is a NinjaTrader Strategy?
A strategy in NinjaTrader 8 is an automated trading program that can place, manage, and exit trades on your behalf. Unlike indicators (which only display information on charts), strategies interact with your broker connection to submit real orders. They appear in a different location than indicators and must be explicitly enabled before they will trade.
Step-by-Step Setup
- Install the strategy — Import the provided
.zipfile via Tools → Import → NinjaScript Add-On. Restart NinjaTrader after import. - Open a chart — Open any futures chart (e.g., ES, NQ, CL). The strategy works on any bar type but requires tick data internally.
- Add the strategy to your chart — Right-click the chart → select Strategies (NOT "Indicators"). In the Strategies dialog, find "TDU Footprint Auto Trader" in the list and double-click it to add.
- Configure settings — The properties panel appears. Set your signals, stop loss, targets, position sizing, and risk filters. Click OK.
- Set Calculate to "On each tick" — This is required. In the strategy properties, make sure Calculate is set to On each tick. The strategy will display a warning banner if this is not set.
- Enable the strategy — After adding, the strategy starts in a disabled state. You must click the "Enable" checkbox/button in the Strategies dialog to activate it.
- Open the Chart Trader panel — The strategy's control panel docks inside the NinjaTrader Chart Trader. To see it: right-click the chart → select Chart Trader (or press Ctrl+T). The control panel appears below the Chart Trader's order buttons. Alternatively, set the Order Panel property to "Separate" to open the control panel as its own window.
- Arm the strategy — The strategy starts in Paused mode. Use the control panel's top button to switch to OneShot (take one trade then pause) or Continuous (keep trading every signal).
9. Trade Execution Settings
| Setting | Options | Description |
|---|---|---|
| Order Type | Market Order, Limit Order | Market orders fill immediately. Limit orders use a configurable tick offset from the signal price. |
| Entry Type | OnBarClose, Realtime | OnBarClose waits for the bar to complete. Realtime evaluates during bar formation for faster entries. |
| Arm Mode | Paused, OneShot, Continuous | Paused = no trading. OneShot = take one trade, then auto-pause. Continuous = trade every valid signal. |
| Signal Combination | Any, Many, All | Any = at least one signal fires. Many = configurable minimum count. All = every enabled signal must fire simultaneously. |
| Market Type | Trending, Ranging | Trending = signals map naturally. Ranging = signals inverted for mean-reversion. |
| Max Open Trades | Integer (default: 1) | Maximum concurrent open trades. |
| Exit on Opposing | Yes / No | Opposing signal closes existing trades before entering the new direction. |
| Group SL/TP | Yes / No | Multiple same-direction trades share the same SL/TP levels. |
| Skip Historical | Yes / No | Only trade on live/realtime data, skip historical processing. |
10. Position Sizing
| Sizing Mode | How It Works |
|---|---|
| Fixed Contracts Per Trade | Trade a fixed number of contracts every time (e.g., always 2 contracts). |
| Fixed Amount Per Trade | Risk a fixed dollar amount. Calculates contracts based on stop distance and tick value. |
| Percentage Per Trade | Risk a percentage of your account balance. Calculates contracts from account value, stop distance, and tick value. |
All sizing modes enforce a configurable Max Contracts cap. Scalp and runner positions have completely independent sizing settings.
11. Stop Loss Management
| # | Stop Type | How It Works | Config |
|---|---|---|---|
| 1 | Previous Bar Hi/Lo | Stop at the previous bar's low (longs) or high (shorts). | Ticks offset |
| 2 | Ticks | Fixed tick distance from entry price. | Tick count |
| 3 | Points | Fixed point distance from entry. | Point count |
| 4 | Dollars | Fixed dollar risk per trade. | Dollar amount |
| 5 | ATR | Average True Range times a multiplier from Close. | ATR period, multiplier, ticks offset |
| 6 | Swing Hi/Lo | Most recent swing low (longs) or swing high (shorts). | Swing strength, ticks offset |
The initial stop loss type is shared between scalp and runner positions.
12. Break Even
| # | Type | Trigger Condition |
|---|---|---|
| 1 | None | Break-even disabled. |
| 2 | Ticks | Move stop to entry when price moves N ticks in profit. |
| 3 | Points | Move stop to entry when price moves N points in profit. |
| 4 | Dollars | Move stop to entry when unrealized dollar profit reaches threshold. |
| 5 | ATR | Move stop to entry when price moves N × ATR in profit. |
| 6 | Risk/Reward | Move stop to entry when profit distance reaches a configurable multiple of initial risk (e.g., 1:1 R:R). |
Scalp and runner have independent break-even settings. Both support a configurable offset in ticks to lock in a small guaranteed profit.
The control panel also has a manual Break Even button that immediately moves all open trade stops to their entry prices.
13. Take Profit & Targets
| # | Target Type | How It Works |
|---|---|---|
| 1 | None | No profit target. Position stays open until stop, trailing stop, or manual close. |
| 2 | Ticks | Fixed tick target from entry price. |
| 3 | Points | Fixed point target from entry. |
| 4 | Dollars | Close when dollar profit amount is reached. |
| 5 | ATR | ATR-based target (period + multiplier). Adapts to volatility. |
| 6 | Risk/Reward | Multiple of initial risk. E.g., 2.0 = target at 2× stop distance. |
Scalp and runner positions have fully independent target settings.
14. Trailing Stops
| # | Trailing Type | How It Works | Config |
|---|---|---|---|
| 1 | None | No trailing stop. | — |
| 2 | Ticks | Trails by a fixed tick distance behind the price. | Offset ticks |
| 3 | ATR | Trails by ATR × multiplier. Adapts to volatility. | ATR period, multiplier, offset ticks |
| 4 | Chandelier Stop | Chandelier stop based on highest high/lowest low minus ATR × multiplier. | Period, multiplier |
| 5 | Parabolic SAR | Uses the Parabolic SAR indicator. Accelerates as the trend continues. | Built-in SAR parameters |
| 6 | Previous Bar Hi/Lo | Trails to the previous bar's low (longs) or high (shorts) on each new bar. | Offset ticks |
Trailing Stop Trigger
The trailing stop does not activate immediately. You configure a trigger condition:
ATR Trigger
Trailing activates when price has moved N × ATR in profit.
When Break-Even
Trailing activates only after the break-even move has been triggered. Lock in break-even first, then let the trailing stop take over.
The trailing stop only moves in the favorable direction (ratchet mechanism). Scalp and runner have fully independent trailing stop settings.
15. Scalp + Runner System
Why choose between quick profits and big moves? When a signal fires, the strategy can open two independent positions simultaneously: a scalp that grabs quick profit and a runner that stays in to ride the trend. The scalp gets you paid early. The runner catches the home run. Each has its own sizing, target, break-even, and trailing stop. The runner is disabled by default and can be enabled via the Enable Runner setting.
Scalp Position
- Own position sizing (contracts, dollars, or percentage)
- Own take-profit target
- Own break-even trigger
- Own trailing stop type and trigger
- Shared initial stop loss type with runner
Runner Position
- Own position sizing (independent from scalp)
- Own take-profit target (or None for trend-following)
- Own break-even trigger
- Own trailing stop type and trigger
- Shared initial stop loss type with scalp
“It's by far the best I have come across and highly functional with heaps of features. Plus the support is excellent. Give the trial a go and I am sure you will be impressed.”
16. Risk Management Filters
The best strategy in the world is worthless without risk management. These filters protect your account automatically — you set the rules once, and the strategy enforces them every single day without fail.
| Filter | Description | Config |
|---|---|---|
| Daily Profit Limit | Had a great day? Lock it in. The strategy stops trading when your cumulative daily realized profit reaches your configured limit. No more “giving back a good day” by overtrading. | Dollar amount |
| Daily Loss Limit | Your safety net. If cumulative daily realized loss reaches the limit, the strategy shuts down for the day. Walk away, reset tomorrow. This is the single most important risk management setting. | Dollar amount |
| Daily Drawdown Limit | Accounts for unrealized losses too. If your realized P&L plus any open trade's unrealized P&L drops below this threshold, trading stops immediately. Catches scenarios where open trades are going south. | Dollar amount |
| Session Filter | Only trade during specific hours. Most traders find their edge in certain sessions — the London open, the NY morning, etc. Set your start and end times and the strategy ignores everything outside that window. | Start time, end time |
| Weekday Filter | Enable or disable trading per day of the week. Hate Mondays and Fridays? Turn them off. Only trade Tuesday through Thursday? Done. One toggle per day. | Per-day toggles |
| Volume Filter | Minimum total volume on the signal bar. Prevents entries on low-participation bars where signals are unreliable. | Minimum volume |
| Delta Filter | Minimum absolute delta on the signal bar. Ensures there's real directional conviction behind every entry. | Minimum delta |
| Delta Percentage Filter | Delta as a percentage of total volume. Filters for bars where one side is clearly dominant, regardless of absolute numbers. | Minimum delta % |
All daily limits reset automatically at the start of each new trading day. When any filter is blocking trades, the strategy renders clear status banners across the top of the chart so you always know why it's not trading.
17. Bar Markers
Each of the 21 built-in signals can display a configurable symbol character directly on the chart when it fires. Bullish markers appear below the bar; bearish markers appear above. Custom signals (1–16) also display as numbered markers.
Each marker has a configurable symbol character (Unicode), plus configurable bullish color (default: DodgerBlue) and bearish color (default: Magenta), and a configurable marker font.
“Very precise and quick entry & exit. Every day PnL increased. I am doing Micro, account balance increasing day by day.”
“Can't praise the guys enough. Still feeling the strategy out and trying to get the best settings. To that end the help from the devs has been immense, answered any queries I've had within minutes.”
Try It Yourself — Free for 7 Days
Every feature. Every signal. Every setting. No restrictions. No credit card required.
See what 21 orderflow signals, a visual strategy builder, and professional trade management can do for your trading.
Start Your Free TrialMonthly Subscription
$69/month
Full access to all features, all updates, all new signals. Cancel anytime — no lock-in, no questions asked.
Lifetime License
$775 one-time
Pay once, use forever. Every future update and new signal included at no extra cost. The best value for committed traders.
19. Video Tutorials
Prefer to learn by watching? We've put together a full video library — from getting started in 20 minutes to full-day live trading sessions with real trade examples and decision breakdowns. Click any video to watch on YouTube.
Auto Trader Training & Live Sessions
 41:40
41:40Orderflow Footprint Auto Trader for NinjaTrader 8 — Part 1
 24:47
24:47Orderflow Footprint Auto Trader for NinjaTrader 8 — Part 2
 12:28
12:28Orderflow Footprint Auto Trader for NinjaTrader 8 — Part 3
 22:39
22:39How To Master The Footprint Auto Trader In 20 Minutes
 31:28
31:28Easy Steps To Trade With Footprint Charts — Part 1
 24:48
24:48Auto Trader Customization: How to Set Up Custom Buttons Fast!
 32:54
32:54Full Day Training: Trade Examples & Decisions — Part 1
 29:45
29:45Full Day Training: Trade Examples & Decisions — Part 2
 27:30
27:30Full Day Training: Trade Examples & Decisions — Part 3
 39:05
39:05Full Day Training: Trade Examples & Decisions — Part 4
 27:29
27:29Backtest for Optimum Results: Find Your Combo
Feature Updates
 15:31
15:31New Features and Improvements in the Latest Update
 23:38
23:38I Automated My Best Order Flow Setups — New Signals + Swing Filter
Customers also look at
The following products are often combined with the orderflow auto trader
Join us on discord
Want to chat with us and other traders? Got questions on our indicators ? Or want to know more about our products?
