


Overview
The Cumulative delta volume indicator shows the cumulative delta volume traded for each session. At the start of each session, the cumulative delta volume is reset to 0. From there on transactions occurring on the Ask are considered buying pressure and are added to the total, and those occurring on the Bid are considered selling pressure and are subtracted from the cumulative total
When the cumulative delta volume is positive it means that there are more buyers in the market than sellers in the current market and vice versa.
The cumulative delta indicator can be used as a simple but efficient confirmation of the uptrend/downtrend. When price makes a pullback in a trend but cumulative delta stays strong then we have more confidence that the trend will continue after the pullback
It can also be used to determine if a trend is losing steam and about the end. When the price in an uptrend is continuing to go higher, but the cumulative delta volume is declining then it's like that the trend will end soon

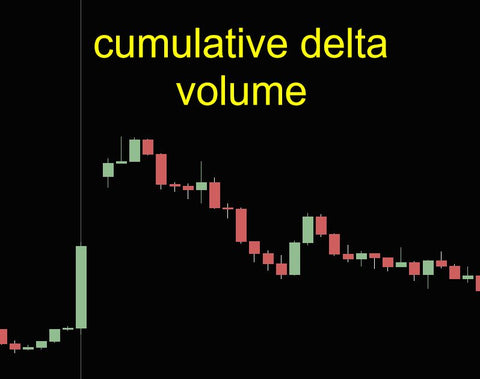
Candles or Histogram
The cumulative delta volume can be shown as candles or as a histogram

Bullish & Bearish divergence
The indicator can plot bullish and bearish divergence between price and the cumulative delta

BloodHound/Ninjascript ready
The indicator exposes several plots which can be used to develop your own strategies:
- CandleOpen - The open price of the delta volume candle
- CandleClose - The close price of the delta volume candle
- CandleLow - the low price of the delta volume candle
- CandleHigh - The high price of the delta volume candle
- Histogram - The histogram value
- Trend - The trend (-1 = down, 1=up)
- Signal - Divergence (1=bullish, -1 = bearish)
Features
- Plots the cumulative delta volume for each session
- Plots bullish & bearish divergence
- Oscillator below the chart
- cumulative delta can be shown as candles or histogram
- Colors can be fully customized
- bloodhound/strategy builder ready
- Plots Bollinger band on the cumulative delta
- Exports all plots
- Works on timeframe
- Works on any market (futures, forex, crypto, stock, options, etc)
- Works on any bar type (time, tick, volume, range, Renko, etc...)
- Works with any NinjaTrader license
Changelog
12-oct-2024 v1.0.0.9
- fixed trend plot not working
02-nov-2022 v1.0.0.6
- fixed divergence not working anylonger
02-nov-2022 v1.0.0.6
- fixed divergence not working anylonger
01-nov-2022 v1.0.0.5
- added support for Up/Down tick volume and Up/Down tick count
- fixed histogram
31-may-2022 v1.0.0.4
- added option to plot bullish/bearish divergence
- added option to turn on/off bollinger bands
25-Jan-2022 v1.0.0.3
- Fixed rendering issue where candle was rendered 1 bar too early
27-nov-2021 v1.0.0.1
- Added option to show Bollinger band on the cumulative delta
10-Aug-2021 v1.0.0.0
- Initial release
Media


