

1. Overview
The Market extremes indicator will tell you when multiple exchanges (NYSE, Dow Jones, and Nasdaq) are overbought or oversold. When multiple markets are overbought/sold at the same time we have a very high chance of seeing a reversal or bigger retracements.
This indicator will show (and alert) you in real-time when 2 or more exchanges become overbought/sold. By combining the overbought/sold signal with other signals (e.g. RSI, MACD, or S&R levels) you get very high probability entries

2. Settings
You can use the indicator in auto mode or manual mode. In Auto Mode, the indicator will calculate the standard deviation of all 3 markets and will give you a signal when 2 or more exchanges are overbought/sold.
In manual mode, you define the extreme levels for the NYSE, Dow, and Nasdaq yourself
2.1 Using Auto mode / Standard Deviation
This standard deviation period specifies the number of bars used to calculate the standard deviation. Depending on your timeframe we suggest a value of 20-100 bars
This standard deviation multiplier specifies how far outside the standard deviation the market should be overbought/sold to give a signal. A lower value will give more signals. A higher value will give less (but more reliable) signals. Depending on the market volatility you might want to choose a value between 1 - 1.6

2.2 Using Manual mode / extreme values

2.3 Display settings
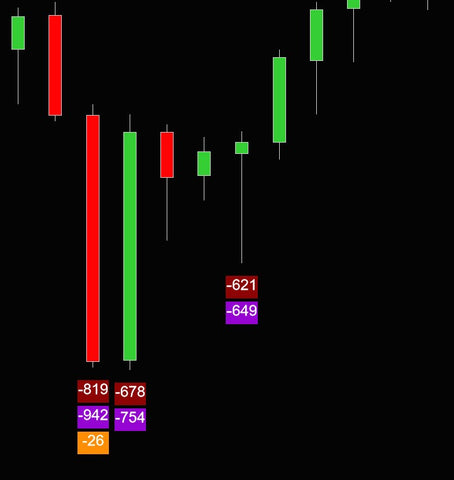
You can choose to have the signals displayed on the chart as a filled rectangle with the level inside, or as a simple dot

Next, you can define when a signal will be shown on the chart. You can choose a number between 1-3 which indicates how many exchanges need to be overbought/sold before a signal is shown

3. Alerts
The indicator can play an alert sound when 2 or more markets are overbought/sold. Simply enable the alert and choose your alert sound. Then sit back and relax and wait until the alert sounds so you can decide whether or not to open a trade.

4. Supports automated strategies/bloodhound
This indicator can be used in your own strategies and fully supports the strategy builder, bloodhound/blackbird, or plain ninja script
It exports a plot called 'Signal' which indicates how many markets are overbought/sold
| Signal | Value | Description |
| -3 | All 3 markets are oversold | |
| -2 | 2 markets are oversold | |
| -1 | 1 market is oversold | |
| 0 | no markets are oversold/overbought | |
| 1 | 1 market is overbought | |
| 2 | 2 markets are overbought | |
| 3 | all 3 markets are overbought |
5. Features
- Shows if NYSE, NASDAQ, and/or Dow Jones are overbought/sold in real-time
- Plots markers on the chart if one or more markets are overbought/sold
- Show signals dots or rectangles with level value
- Base signals on manual extreme values or standard deviation calculation
- Support alerts
- Supports bloodhound
- Can be used in automated strategies
- Supports any timeframe
- Supports any bar type
- Can be used to trade the indices ( NQ, ES, YM, RT )
- Supports all NinjaTrader versions
6. DISCLAIMER
Please note that this indicator needs real-time ^TICK data for the NYSE, DOW, and Nasdaq. This is NOT included in your default data subscription. Please consult your broker on how to get this data. Without this real-time data, this indicator will not work!!
7. Changelog
17-may-2023 v1.0.0.7
- fixed issue that dropdown menu appeared multiple times in chart menu after saving workspace and reloading ninjatrader
7-Aug -2022 v1.0.0.6
- Added dropdown menu for easy access to all important indicator settings
- Added option to hide multiple signals in a row
14-dec -2021 v1.0.0.4
- Users can now specify the minimum levels for the Dow, NYSE & NASDAQ which should be met to give a signal and/or show a marker
14-nov -2021 v1.0.0.3
- overbought./sold settings can now be calculated by looking at the standard deviation of the tick indexes
9-nov -2021 v1.0.0.0
- first release
9. Media

