

The most advanced Volume Profile indicator
Looking to take your trading game to the next level? Introducing the volume profile indicator - a powerful tool that helps you identify key support and resistance levels in the market. With its easy-to-read visual representation of volume data, you'll be able to make more informed trading decisions and potentially boost your profits. This volume profile has all the features you are looking for and more. How about auto profile splitting ? or High and Low volume nodes which makes sense ?


Daily,Weekly,Monthly and more.
Can show any session time, from Daily to monthly, from custom to visible rang and even a profile for every x bars
Mono, Heatmap, Buy/Sell, Delta
Choose any of the color modes like mono, buy/sell, heatmap, delta or delta + volume
High/Low volume nodes
Shows you the high/low volume nodes
Mono, Heatmap, Buy/Sell
Choose any of the color modes like mono, buy/sell, heatmap, delta or delta + volume
Auto profile splitting
Auto splits a composite profile into multiple sub profiles
Mono, Heatmap, Buy/Sell
Choose any of the color modes like mono, buy/sell, heatmap, delta or delta + volume
Left/right orientation
Choose if you want your profile to be shown on the left or right of each session
Pivot lines.. and much more
Like different settings for current / previous profiles. Extending pivot lines, profile smoothing
Volume profile indicator
Suitable for breakout, reversal, or trend following strategies. Many traders are using volume profiles in their trading arsenal to get visibility of the price levels where the most and least volume has traded over a given time. When price returns to an area where previously a large volume has been traded we can naturally expect support/resistance. Likewise, when price returns to a region where previously a very small amount of volume was traded we can expect the price to move through that area with relative ease.
Daily, Weekly, Monthly and other volume profiles
Daily volume profile
The volume profile indicator can show daily volume profile sessions. A daily volume profile session shows you the volume profile of the entire day. From star to end of the session. The trading hours template you choose in your dataseries determines the start and end of each daily session
-Helps you identify key support and resistance levels: By analyzing the volume distribution at different price levels, you can identify areas where there is high trading activity, which can be used as support or resistance levels. These levels can be useful for making trading decisions, such as setting stop loss or take profit levels.
- Provides insight into market sentiment: The volume profile can also provide insights into the sentiment of the market. For example, if there is high trading activity around a certain price level, it could indicate that traders are bullish or bearish on that level.
- Helps you identify potential trade opportunities: By analyzing the volume profile, you can identify areas where there is a high concentration of trading activity. These areas may present potential trade opportunities, such as breakouts or pullbacks.
- Can be used in conjunction with other analysis techniques: The daily volume profile can be used in combination with other technical analysis tools, such as trend lines, moving averages, and oscillators, to improve trading decisions.

Weekly volume profile
In addition to analyzing the daily volume profile, traders may also look at the weekly volume profile to gain a broader perspective of the market. Here are a few reasons why traders may find the weekly volume profile useful:
- Provides a longer-term view of market dynamics: The weekly volume profile covers a larger timeframe than the daily volume profile and can provide traders with a longer-term view of market dynamics. This can be useful for identifying trends and longer-term support and resistance levels.
-Helps identify potential breakout areas: By analyzing the volume profile on a weekly basis, traders may be able to identify potential breakout areas that are not visible on the daily chart. These breakout areas may provide profitable trading opportunities for traders who are able to spot them.
-Offers confirmation of daily volume profile analysis: Traders can also use the weekly volume profile to confirm their analysis of the daily volume profile. For example, if the daily volume profile indicates a strong level of support or resistance at a certain price level, traders may want to confirm this by looking at the weekly volume profile to see if the same level is significant over a longer timeframe.
Monthly volume profile
The monthly volume profile shows you the volume profile for the entire month
- Offers a longer-term perspective: The monthly volume profile provides traders with a view of market activity over a much longer timeframe than the daily or weekly volume profile. This longer-term perspective can be particularly useful for traders who are looking to take positions with longer holding periods.
-Provides a broader perspective on market sentiment: By analyzing the monthly volume profile, traders can gain insight into market sentiment over a longer period of time. This can help to identify trends and turning points in the market that may not be as apparent on shorter timeframes.
- Can identify major support and resistance levels: The monthly volume profile can help traders to identify major support and resistance levels that may not be visible on shorter timeframes. These levels can be used to make trading decisions and manage risk.


Up to 5 Custom Intraday Sessions for Volume Profiles
Traders now have the flexibility to define up to five custom session timeframes per day (e.g., 00:00–04:00, 04:00–09:30, 09:30–12:00, 12:00–17:00, and 17:00–23:59). This level of granularity provides a volume profile that focuses on precisely the times you care about—whether that’s regular trading hours (RTH) only, or multiple sub-sessions throughout the trading day. Below are several advantages of using custom session volume profiles:
1. Clearer Insight into Specific Time Windows
By concentrating on particular periods (e.g., RTH, overnight session, or any other custom block), traders gain a sharper picture of market activity and participation exactly when it matters most.
2. Reduced ‘Noise’ from Inactive Hours
Non-trading or low-liquidity hours can sometimes distort volume metrics. Custom session timeframes allow traders to bypass these inactive periods, providing a more accurate read on volume distribution during truly active intervals.
3. Better Detection of Intraday Market Anomalies
Custom volume profiles can highlight sudden volume spikes, unexpected surges in liquidity, or other anomalies occurring in narrower windows. These short-term clues often remain hidden when looking at broader or 24-hour profiles.
By defining up to five distinct intraday sessions each day, traders can tailor volume analysis to match their strategies—whether that involves focusing on the opening bell, lunchtime lulls, or post-market volatility.
Volume profile for every x bars
Looking at a volume profile that is built every x bars can provide traders with a more granular view of market activity over a specific timeframe. Here are a few reasons why you might want to consider looking at a volume profile that is built every x bars:
- Provides a more detailed view of market activity: By building a volume profile every x bars, traders can gain a more detailed view of market activity over a specific timeframe. This can help to identify trends and turning points that may not be apparent on longer timeframes.
- Can help to identify short-term trading opportunities: By analyzing the volume profile for shorter timeframes, traders can identify short-term trading opportunities that may not be visible on longer timeframes. This can be useful for day traders or scalpers who are looking to take advantage of short-term price movements.
- Can help to manage risk: By analyzing the volume profile for shorter timeframes, traders can identify key levels of support and resistance that can be used to manage risk. For example, a trader may set stop loss or take profit levels based on the volume profile for a specific number of bars.

Visible range volume profile
A volume profile based on the visible range can provide traders with a more focused view of market activity within a specific timeframe. Here are a few advantages of using a volume profile based on the visible range:
- Provides a focused view of market activity: By using a volume profile based on the visible range, traders can focus on the specific timeframe that is currently visible on their chart. This can help to provide a more focused view of market activity and make it easier to identify key levels of support and resistance.
- Helps to identify short-term trading opportunities: A volume profile based on the visible range can help traders to identify short-term trading opportunities that may not be visible on longer timeframes. This can be useful for day traders or scalpers who are looking to take advantage of short-term price movements.
- Can be used to manage risk: By analyzing the volume profile for the visible range, traders can identify key levels of support and resistance that can be used to manage risk. For example, a trader may set stop loss or take profit levels based on the volume profile for the visible range.
Volume profile of all bars
Another option is to show a volume profile which is based on all the available bars loaded. For example if you setup your chart so it loads 10 days of data then this volume profile will be based on all bars during the last 10 days. You might want to use this in combination with auto-splitting to get the 'best' single shaped volume profiles
By auto splitting a volume profile which is based on all bars, the split profiles are not bound anymore to (daily) sessions boundaries. There fory they might get divided in better single b,d,p profiles than when trying to split (daily) profiles which are always bound to the daily boundaries
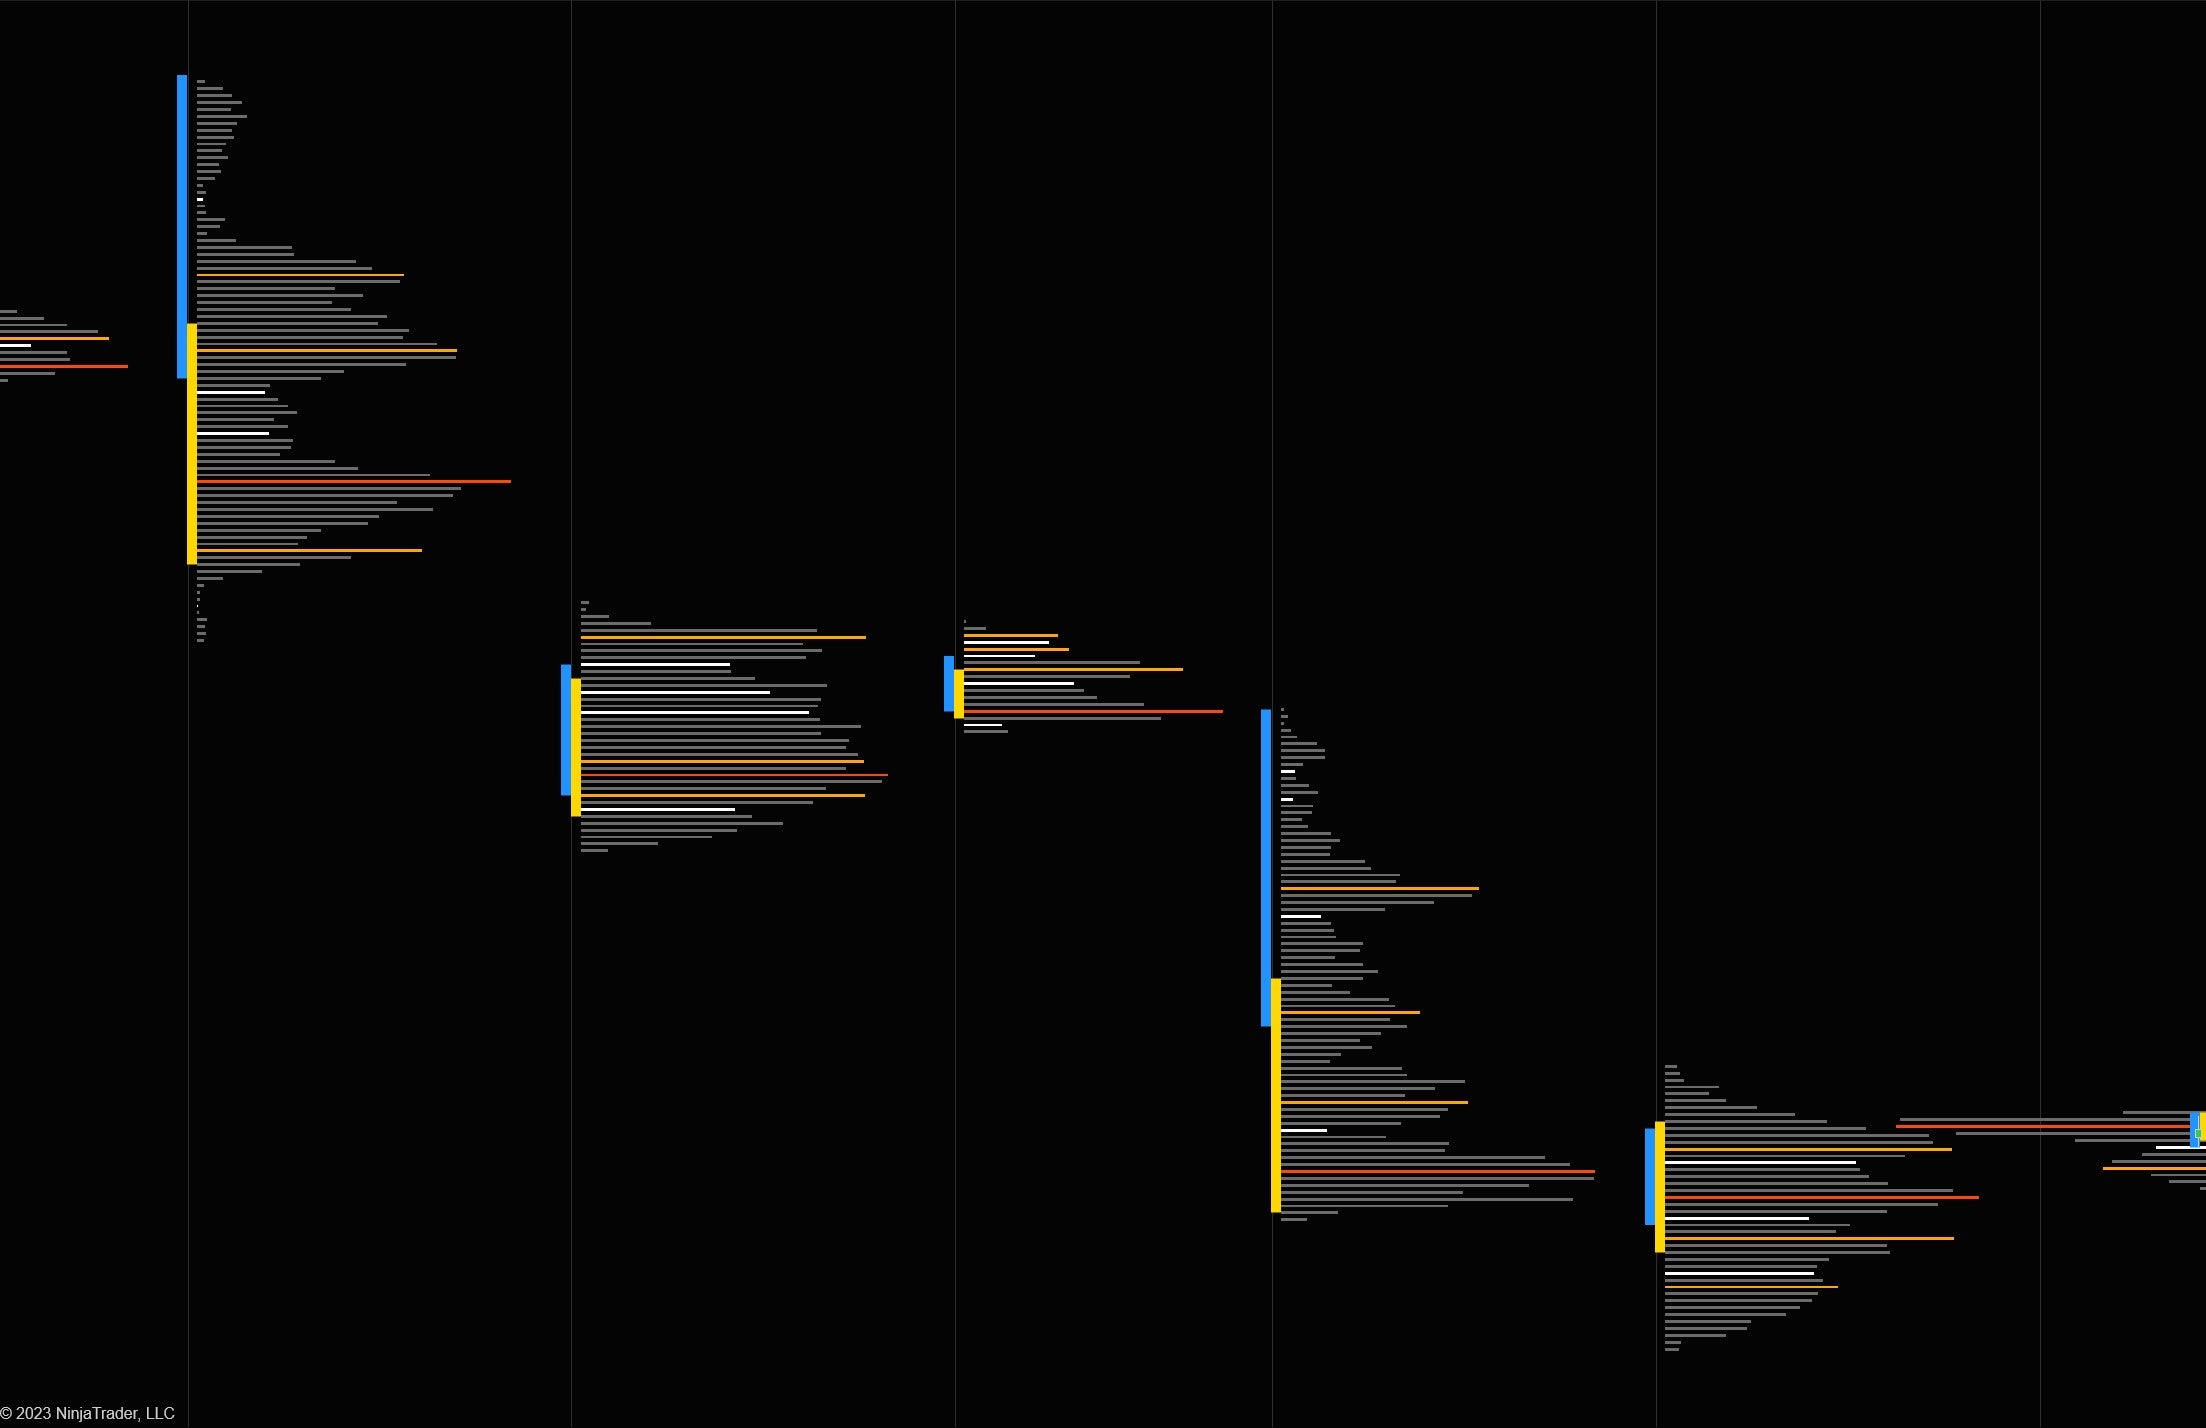
Fixed Interval Volume profiles
Rather than manually defining each session by start and end times, the Fixed-Interval session type automatically breaks the trading day into evenly sized “chunks” (e.g., every 2 hours), generating a separate volume profile for each interval. This systematic approach can bring clarity to intraday trading, as you repeatedly reset and observe volume distributions in equal blocks of time. Below are some advantages of using fixed-interval session profiles:
1. Consistent Time Slices
By segmenting the market into uniform intervals (e.g., 30-minute, 60-minute, or 120-minute blocks), traders can more easily compare one interval’s volume distribution to the next. This uniformity helps highlight when a new wave of trading activity emerges or when market participation declines.
2.Better Intraday Pattern Recognition
Many markets exhibit cyclical behaviors (e.g., midday slowdowns, late-day bursts) that recur roughly at the same times each day. Fixed-interval profiles make these patterns stand out clearly by resetting on a predictable schedule, so you can quickly detect volume spikes or lulls that repeat from one interval to the next.
3.Reduced Complexity in Session Definition
Unlike custom sessions, which must be explicitly defined for each window, a single choice of interval (e.g., “generate a new profile every 60 minutes”) creates multiple volume profiles automatically. This eliminates guesswork about which session boundaries to use or how to handle partial sessions, even if the interval crosses midnight or extends beyond the regular close.Overall, fixed-interval volume profiles offer a straightforward, time-based strategy for intraday traders who want consistent snapshots of market activity. By regularly “resetting” and analyzing volume over shorter, uniform periods, you can more easily track evolving conditions and gain valuable insights into shifting supply and demand throughout the trading day.
Volume profile color modes
You can select between different color modes for the volume profiles. All colors are fully customizable for both the inside value area part and outside value are part
Mono
A mono-colored volume profile is a type of volume profile chart that uses a single color to represent the volume traded at different price levels. The chart can provide traders with a clear and simple visual representation of the market structure and potential trading opportunities.
Heatmap
A heatmap colored profile is a type of volume profile chart that uses different colors to represent the volume traded at different price levels. The colors can range from cool colors like blue or green for low volume areas to warm colors like red or orange for high volume areaks.

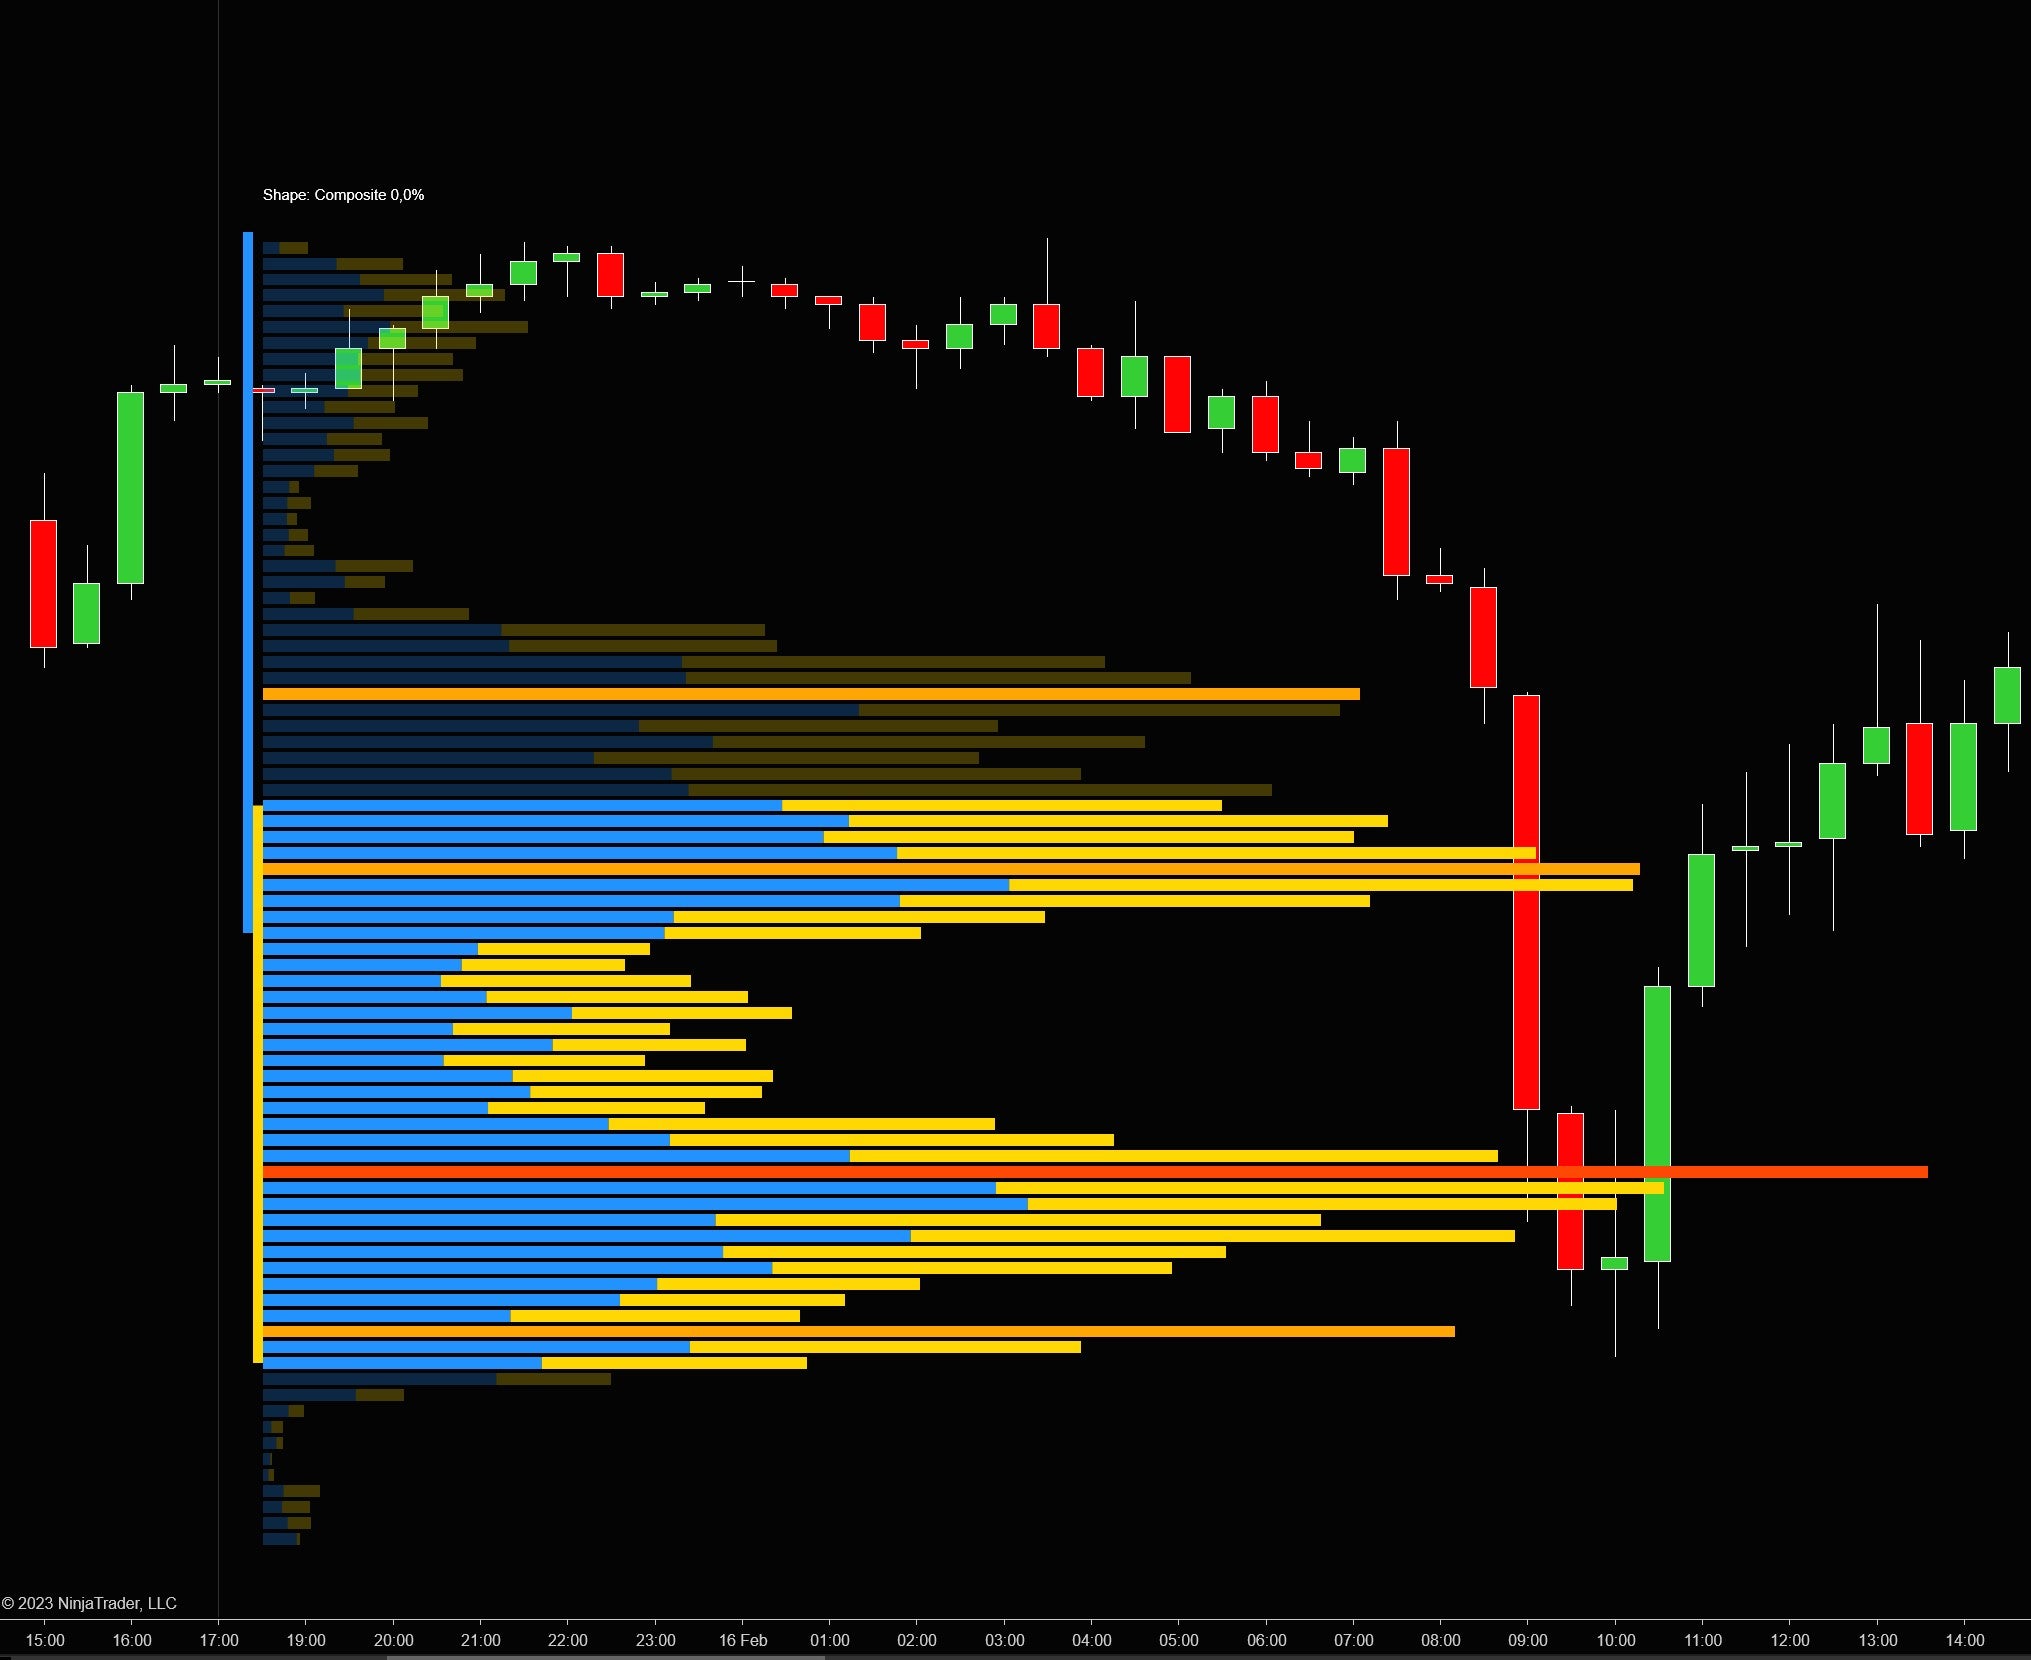
Buy/Sell
A buy-sell colored volume profile is a type of volume profile chart that uses different colors to represent buying and selling volume at different price levels. The colors can range from cool colors like blue or green for selling volume to warm colors like yellow or orange for buying volume
Delta
A delta volume profile is a type of volume profile chart that displays the difference between the volume of buyers and sellers at each price level. The chart can help traders to identify areas of high buying or selling pressure and potential trend reversals.
Delta+Volume
Delta + volume will will show you both a (mono) volume profile and also the delta at each price level (buy-sell volume). You can choose a separate color for the value area and outside the value are

High & Low volume nodes
High and low volume nodes are two important components of a volume profile chart. Both can be used to identify key support and resistance levels on a volume profile chart. High volume nodes represent areas of high liquidity and congestion, while Low volume nodes represent areas of low liquidity and potential breakout opportunities. Traders can use this information to make more informed trading decisions and improve their performance.
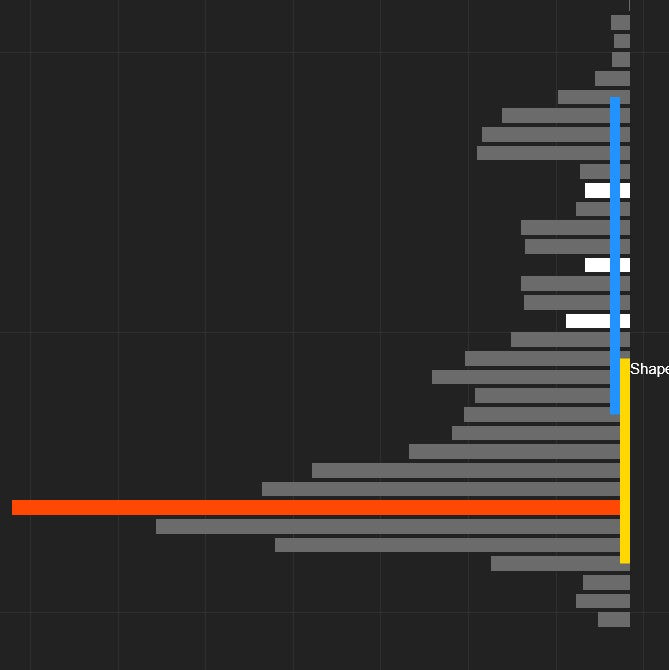
Low volume nodes
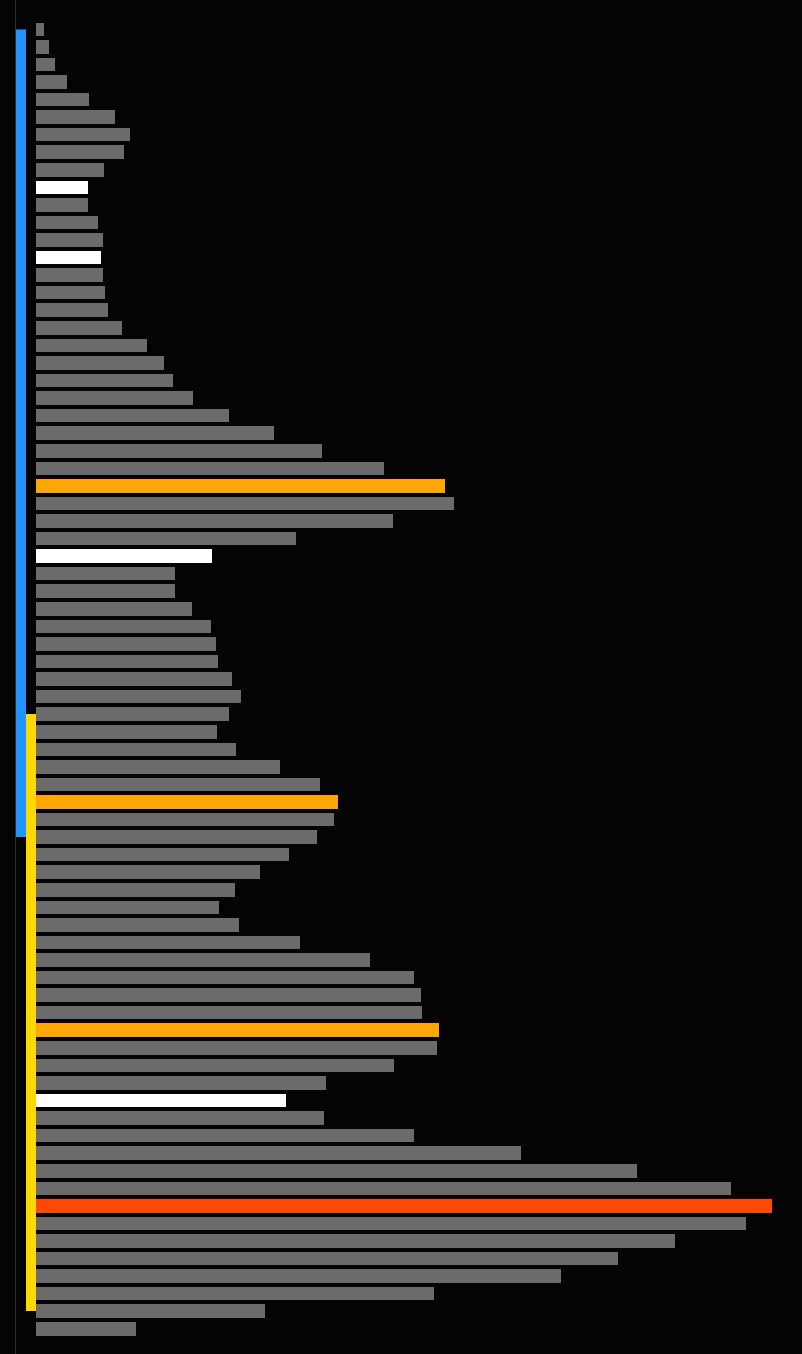
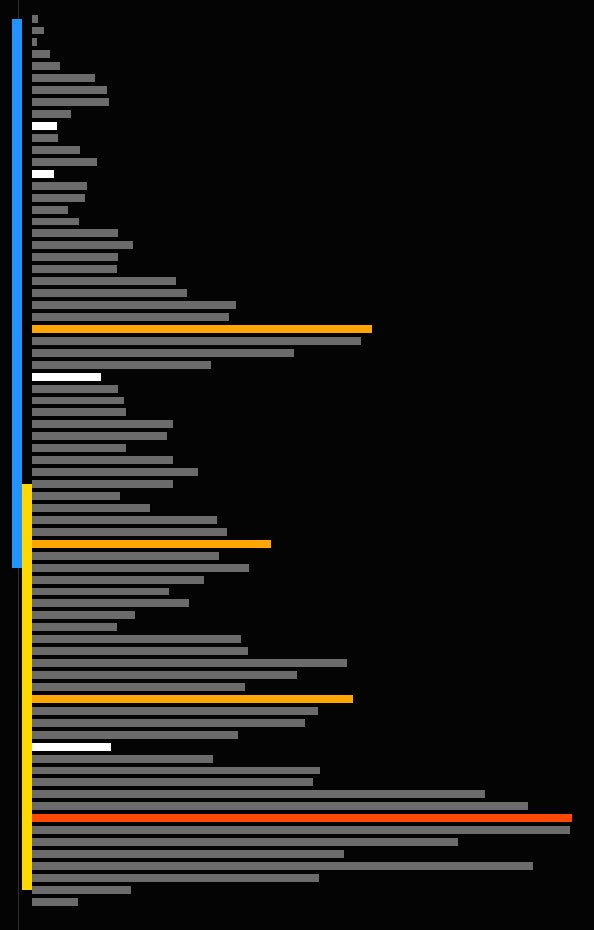
A low volume node (LVNode) is a price level where relatively little volume has traded in the past. LVNodes are depicted as white horizontal lines by default . These price levels can represent areas where there is less liquidity and less interest from market participants.
Traders can use LVNodes to identify potential breakout levels. If a price level has been relatively ignored by the market in the past (i.e., a LVNode), there may be an opportunity for the market to move quickly through that level if there is a shift in sentiment or market conditions.
On the right we see a volume profile with 3 low volume nodes in white


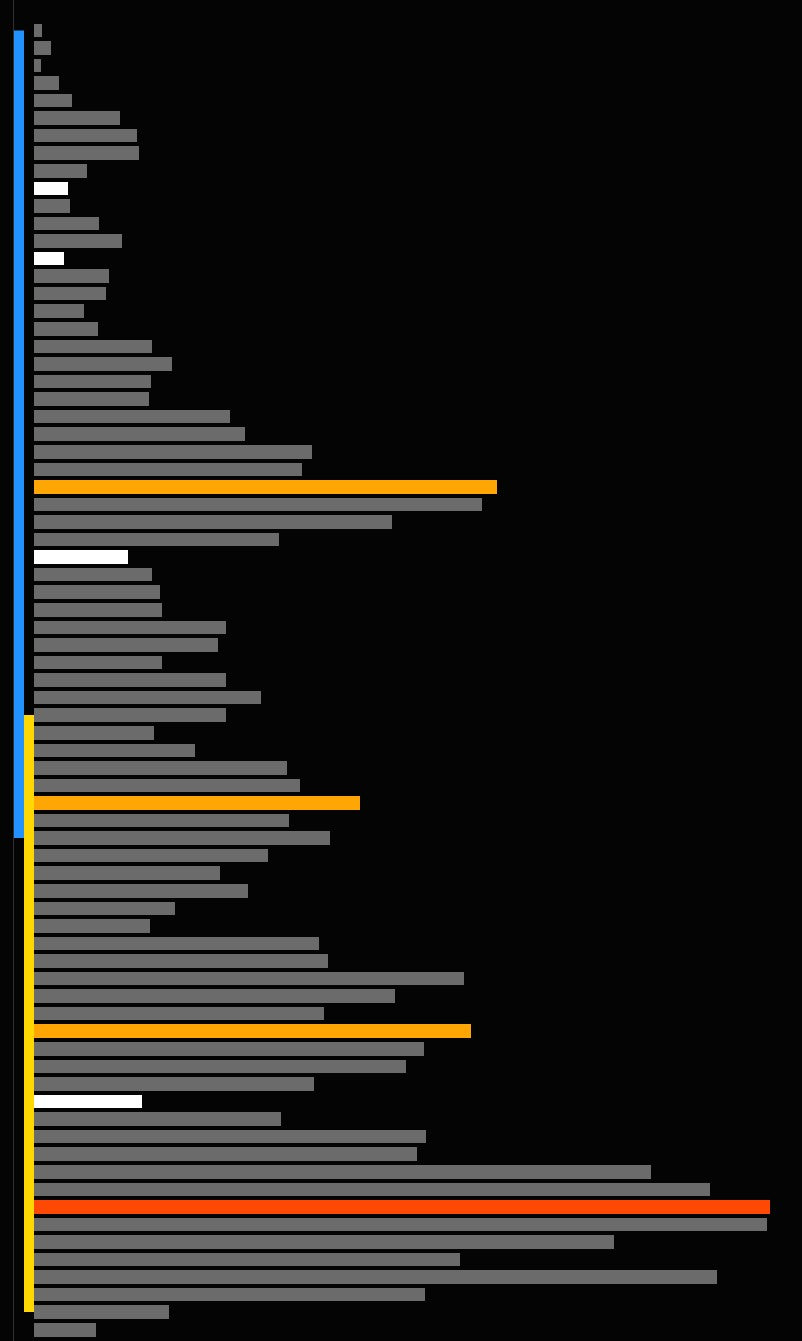
High volume nodes
A high volume node (HVNode) is a price level where a significant amount of volume has traded in the past. HVNodes are usually depicted as orange lines, indicating higher volumes. These price levels often represent areas of congestion or support/resistance.
On the left we see a volume profile with 3 highvolume nodes in orange.
Extending high/low volume nodes
By defaut the high and low volume nodes are shown inside the volume profile. However you can choose to extend these in 2 ways
Session:
The high and low volume nodes will be extended to the end of the session
Forward
The high/low volume nodes will be extended forward until the current date & time


High/Low volume node settings
With the easy to use dropdown menu you can quickly change any setting including the high/low volume node settings
You can
- turn both the High/Low volume nodes on/off individually
- determine how many high/low volume nodes to show
- extend both the High/Low volume nodes on/off individually
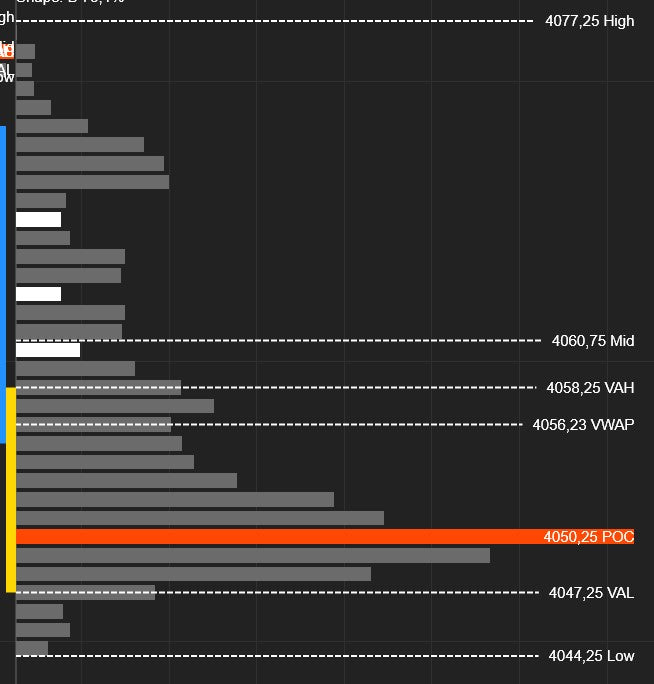
Pivot lines & Orientation
The volume profile indicator can show lines & labels for all the important pivots like POC, value area high/low
Left
You can choose whether you want your volume profiles to show on the left or on the right of each session. Below we see a profile on the left

Right
Left or right can be choosen for both the current profile and the previous profile. For example you can have the current profile on the right and the previous profile oriented on the left side
Show Pivot lines
For each volume profile you can show the Low, High, Mid , Value Area low/high and POC pivots.
Extending pivot lines
You can also choose to extend these pivot lines forward to the current date & time

Volume profile Auto split
Volume profile splitting is a technique used to break down a complex composite volume profile chart into multiple single profiles, with each sub-profile representing a simple b,d or p shape. The primary benefit of volume profile splitting in this context is that it can help traders to identify key levels of support and resistance more easily, as well as potential trading opportunities within each sub-profile.
Here are a few key benefits of using volume profile splitting to simplify a composite profile:
- Provides a clearer picture of market structure: By breaking down a complex composite profile into simpler sub-profiles, traders can gain a clearer understanding of the underlying market structure. This can help to identify important price levels and trends more easily, which can aid in making more informed trading decisions.
- Easier identification of key support and resistance levels: Simplifying a composite profile through volume profile splitting can make it easier to identify key levels of support and resistance within each sub-profile. These levels can then be used to set stop loss and take profit levels, or to identify potential trading opportunities.
More targeted analysis:
- Splitting a composite profile into separate sub-profiles allows traders helps to identify trends and patterns that may be difficult to spot in a more complex profile. This targeted analysis can lead to more precise trading decisions and better risk management
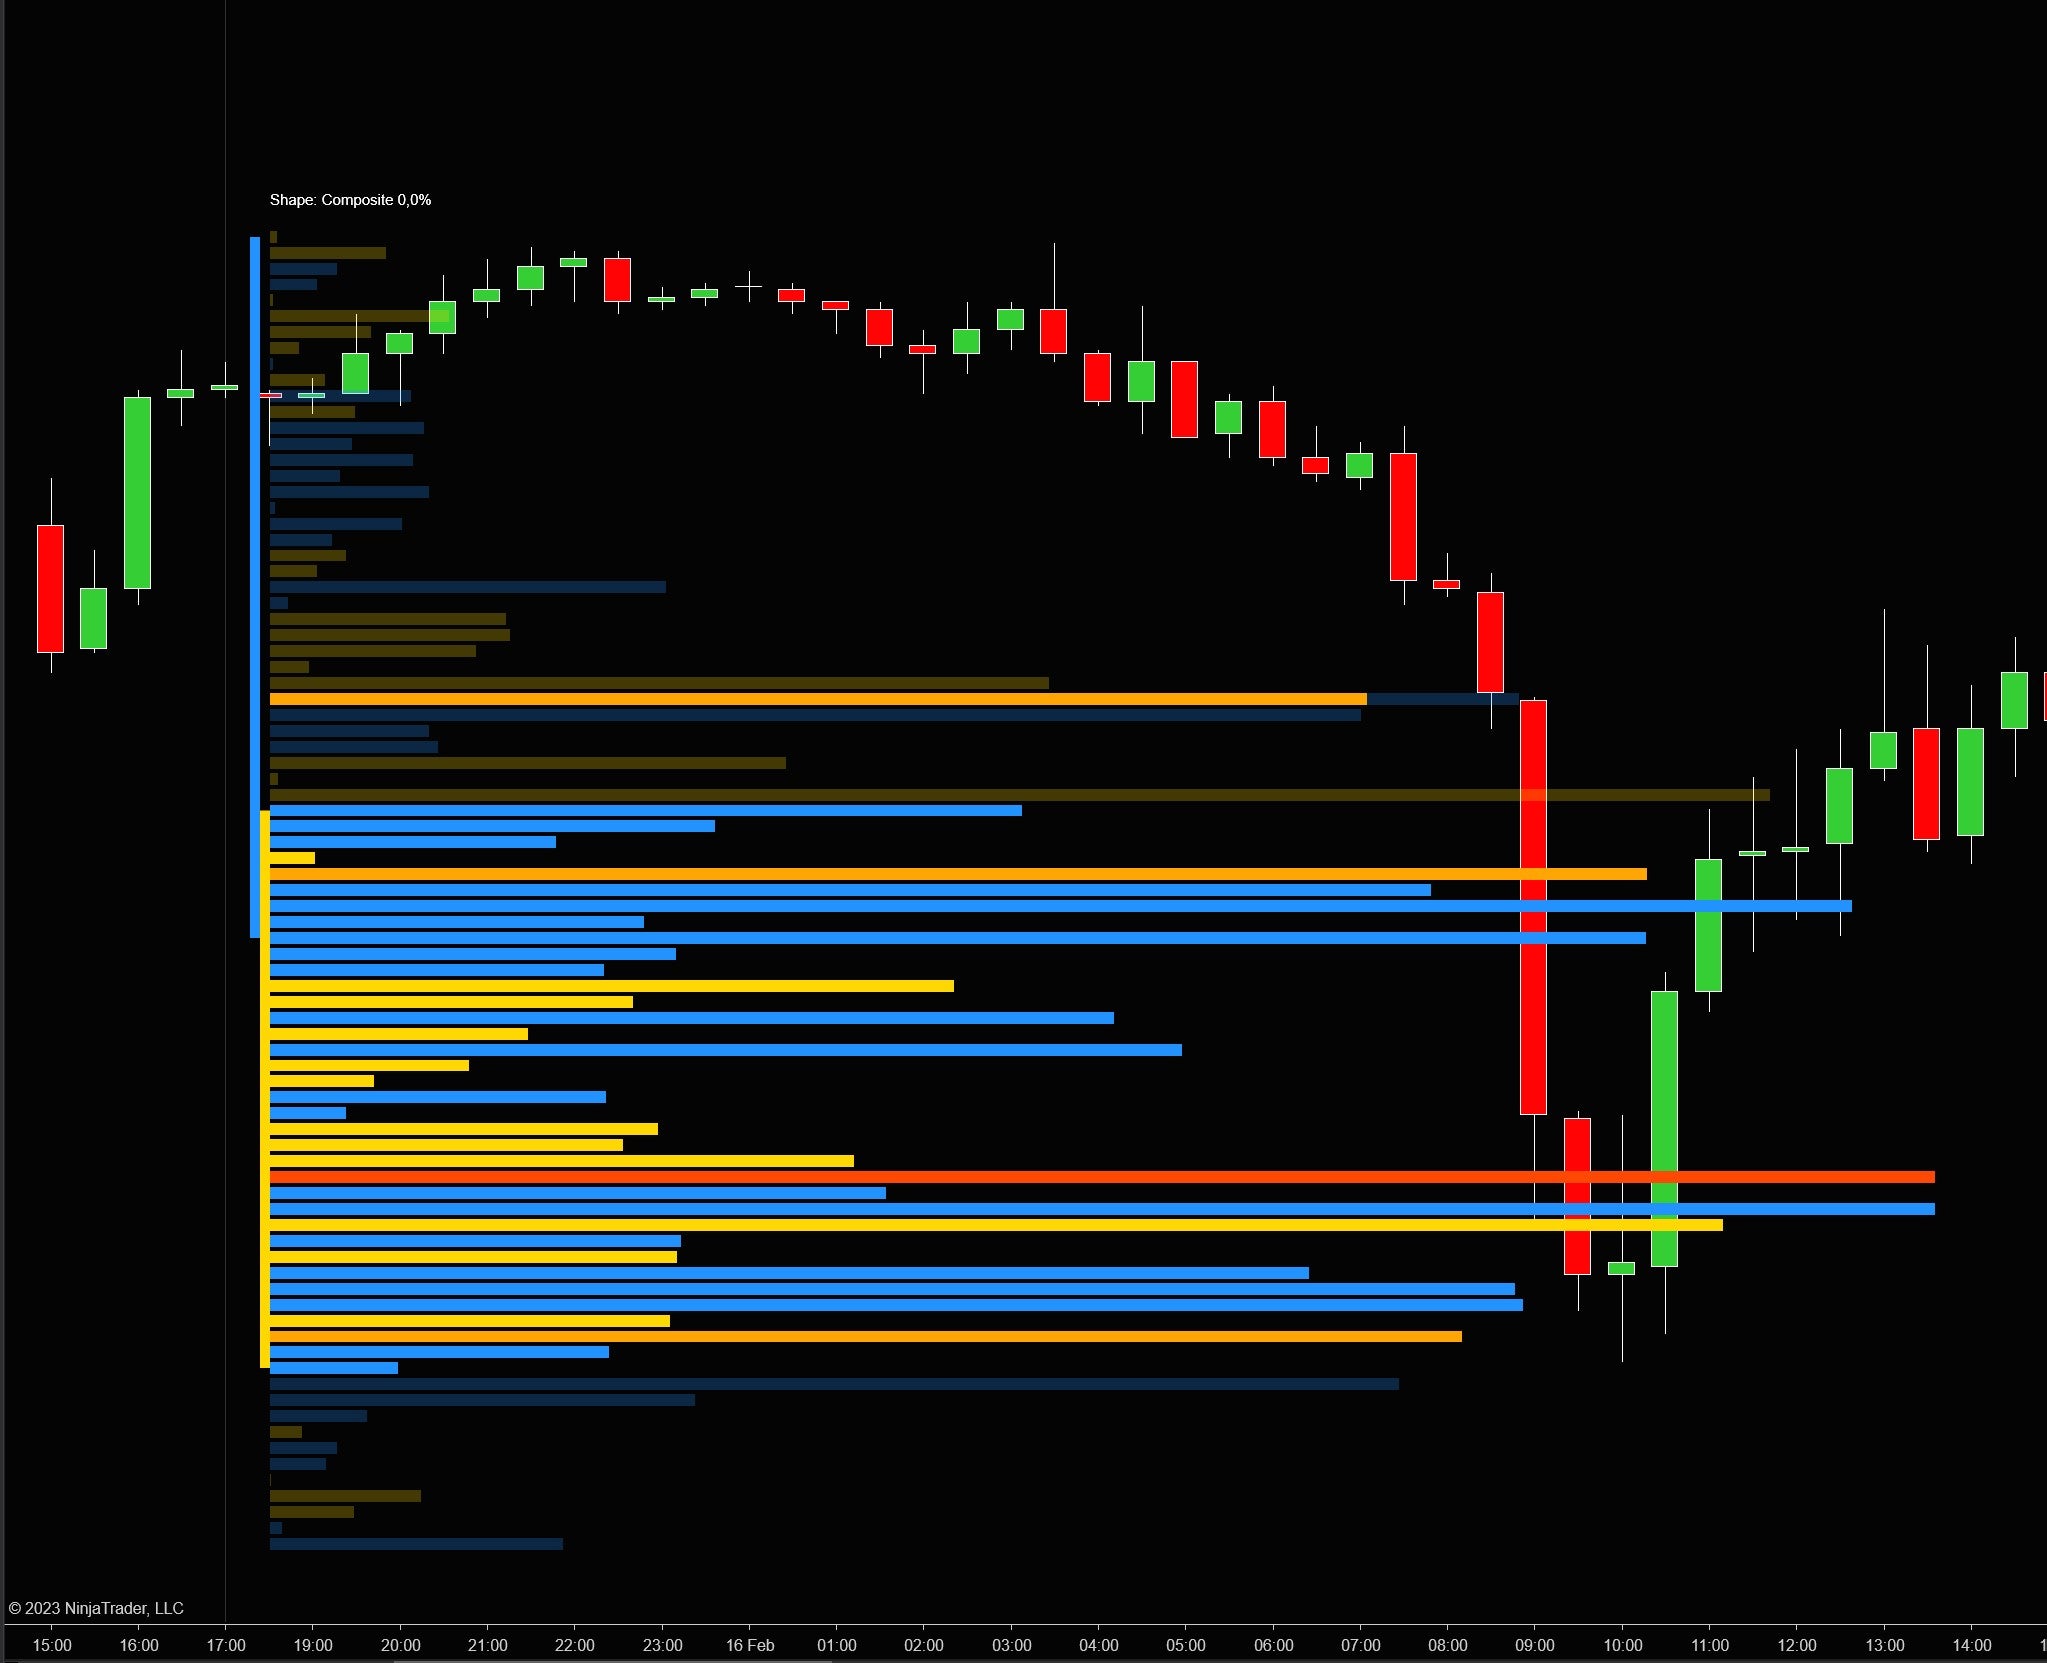
Unsplit composite profile
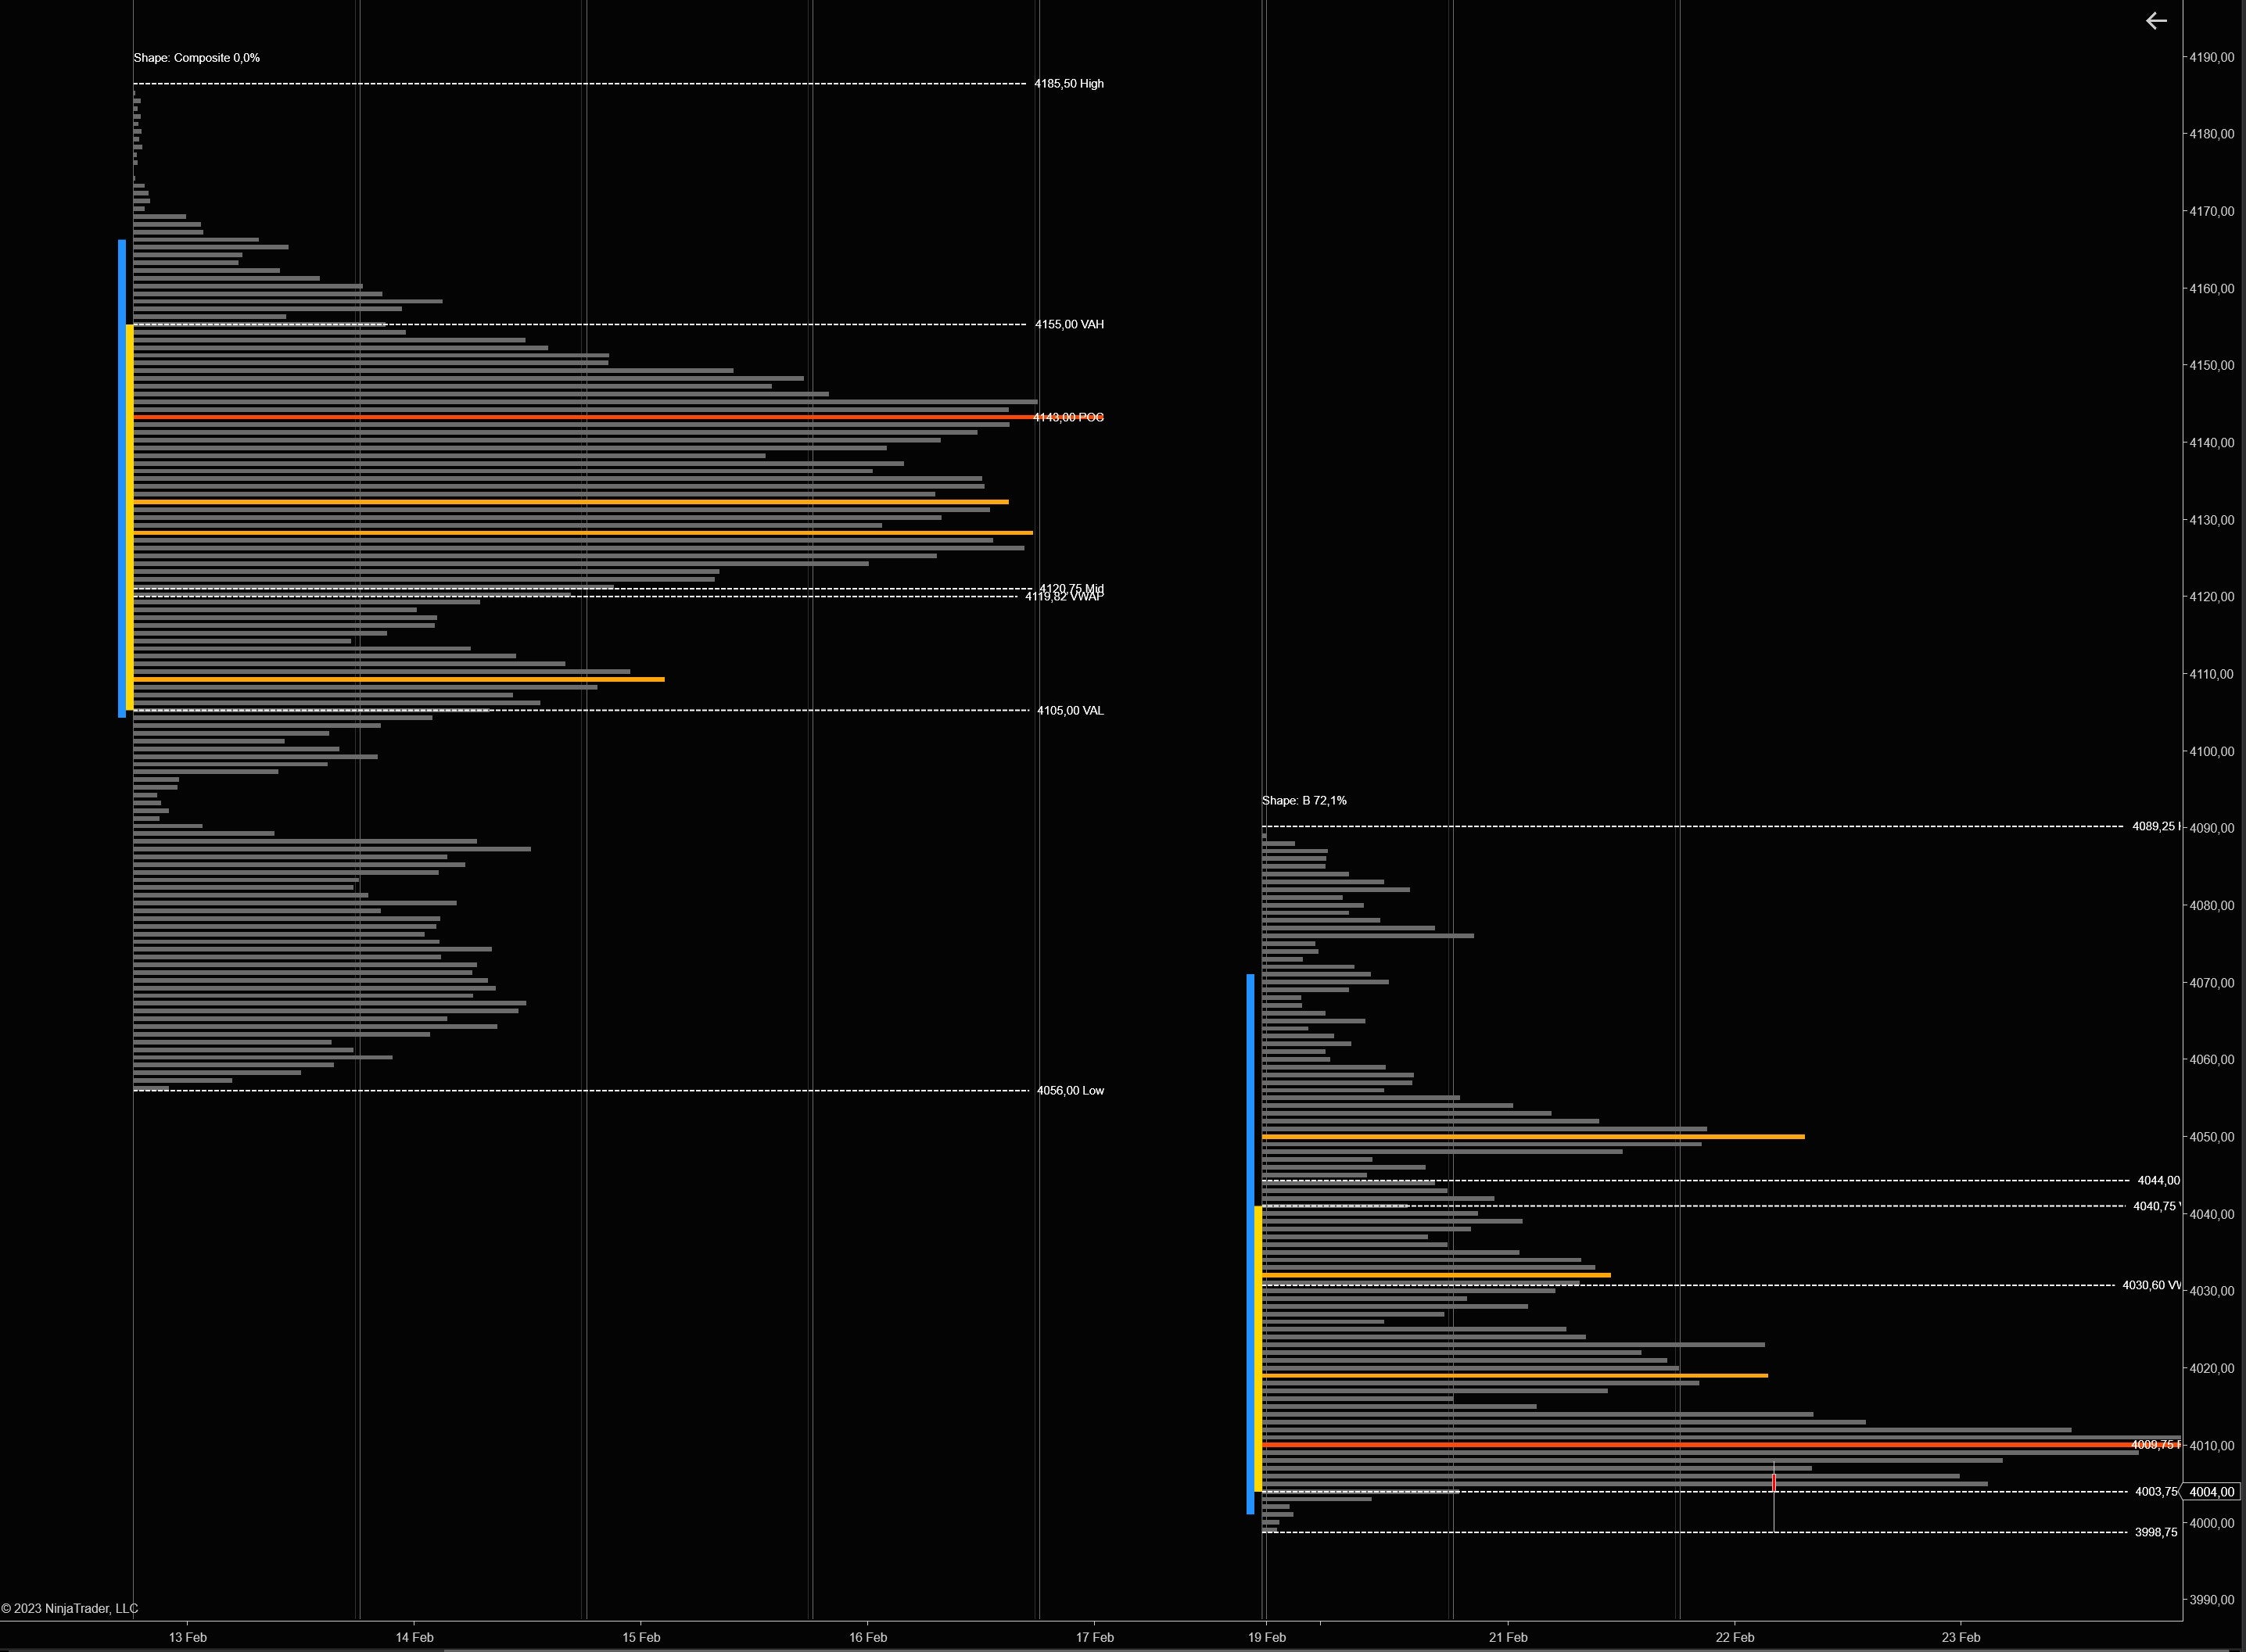
Below we can see a default un-split composit profile. A composite profile will have multiple high volume nodes and not a defined b,d, or P shape

Auto split profile
Below we can see that same profile but not auto-split . Here the profile was split into 2 separate b profiles. Each profile now has a clear b shape with only 1 high volume node


Profile Split settings
You can control the splitting of profiles using 3 setings
Shape threshold (1-100%)
This inidicates how good each split sub-profile should resemble a b,d or p shape. 100% would be a perfect single b,d,p shape. Around 60% is a good compromise. If you go much higher it might become impossible to find a sub profile which meets the perfect shape. Anything lower and the sub profiles begin to look more like composite profiles
Min Time % (1-100%)
This indicates how much time should be spend in each split sub-profile. For example.. lets say we split a daily composite profile into multiple sub profiles. A daily composite profile takes 24 hours. So if you set the min time % to 15% then each sub profile should take at least 15% of 24 hrs = 3,6 hours
Min Volume% (1-100%)
This indicates how much volume should be traded in each split sub-profile. For example.. lets say we split a daily composite profile into multiple sub profiles. The entire volume traded in that daily session would then be 100%. So if you set the min volume % to 10% then each sub profile should trade at least 10% of the daily volume
Volume profile smoothing
Profile smoothing is a technique used to reduce the noise in a volume profile chart by filtering out minor fluctuations in the data. This technique involves applying a smoothing algorithm to the volume profile, which can help to reveal underlying trends and patterns that may be difficult to see in the raw data.
There are several reasons why a trader may choose to use profile smoothing in their analysis:
- Better visual representation of the data: Smoothing a volume profile chart can help to remove the noise and make it easier to identify the underlying trends and patterns. This can lead to a clearer and more accurate representation of the data, which can be useful for making more informed trading decisions.
- Improved accuracy of key levels: Smoothing a volume profile chart can help to identify key levels of support and resistance more accurately. By filtering out minor fluctuations in the data, traders can focus on the most significant price levels and avoid being misled by false signals.
Normal profile
Smoothed profile
Volume profile width
With our volume profile indicator, users have the ability to define the width of each volume profile. The width can be set relative to the duration of the trading session, which allows for greater customization and precision in the analysis of volume data. For example, if a user selects a width of 50%, the volume profile will occupy half of the duration of the trading session. Similarly, if a user selects a width of 100%, the volume profile will occupy the entire duration of the trading session.
Width 50% of session

Width 100% of session

Ticks per level
Our volume profile indicator offers the option to group multiple ticks per level, which can provide a more accurate representation of the market activity at each price level.
When volume data is grouped per level, the indicator aggregates the volume for each price level, rather than showing each individual tick. This can be especially useful in markets with high trading volumes, where displaying each individual tick can lead to cluttered charts and less meaningful data.
By grouping multiple ticks per level, traders can gain a better understanding of the overall buying and selling activity at each price level. This can help identify significant levels of support and resistance, as well as potential trading opportunities based on price action.
1 tick / price level

4 ticks / price level
Easy drop down menu
Our indicator comes with a user-friendly dropdown menu that allows you to make adjustments to the settings quickly and easily, without the need to reload the chart. he menu allows you to adjust the parameters of the indicator, such as the session type, high/low volume nodes, coloring , smoothing, and other settings, so that you can tailor the indicator to your specific trading style and preferences. Instead of having to reload charts and make changes manually, you can simply use the dropdown menu to make quick and easy adjustments on the fly, without any disruption to your trading workflow.

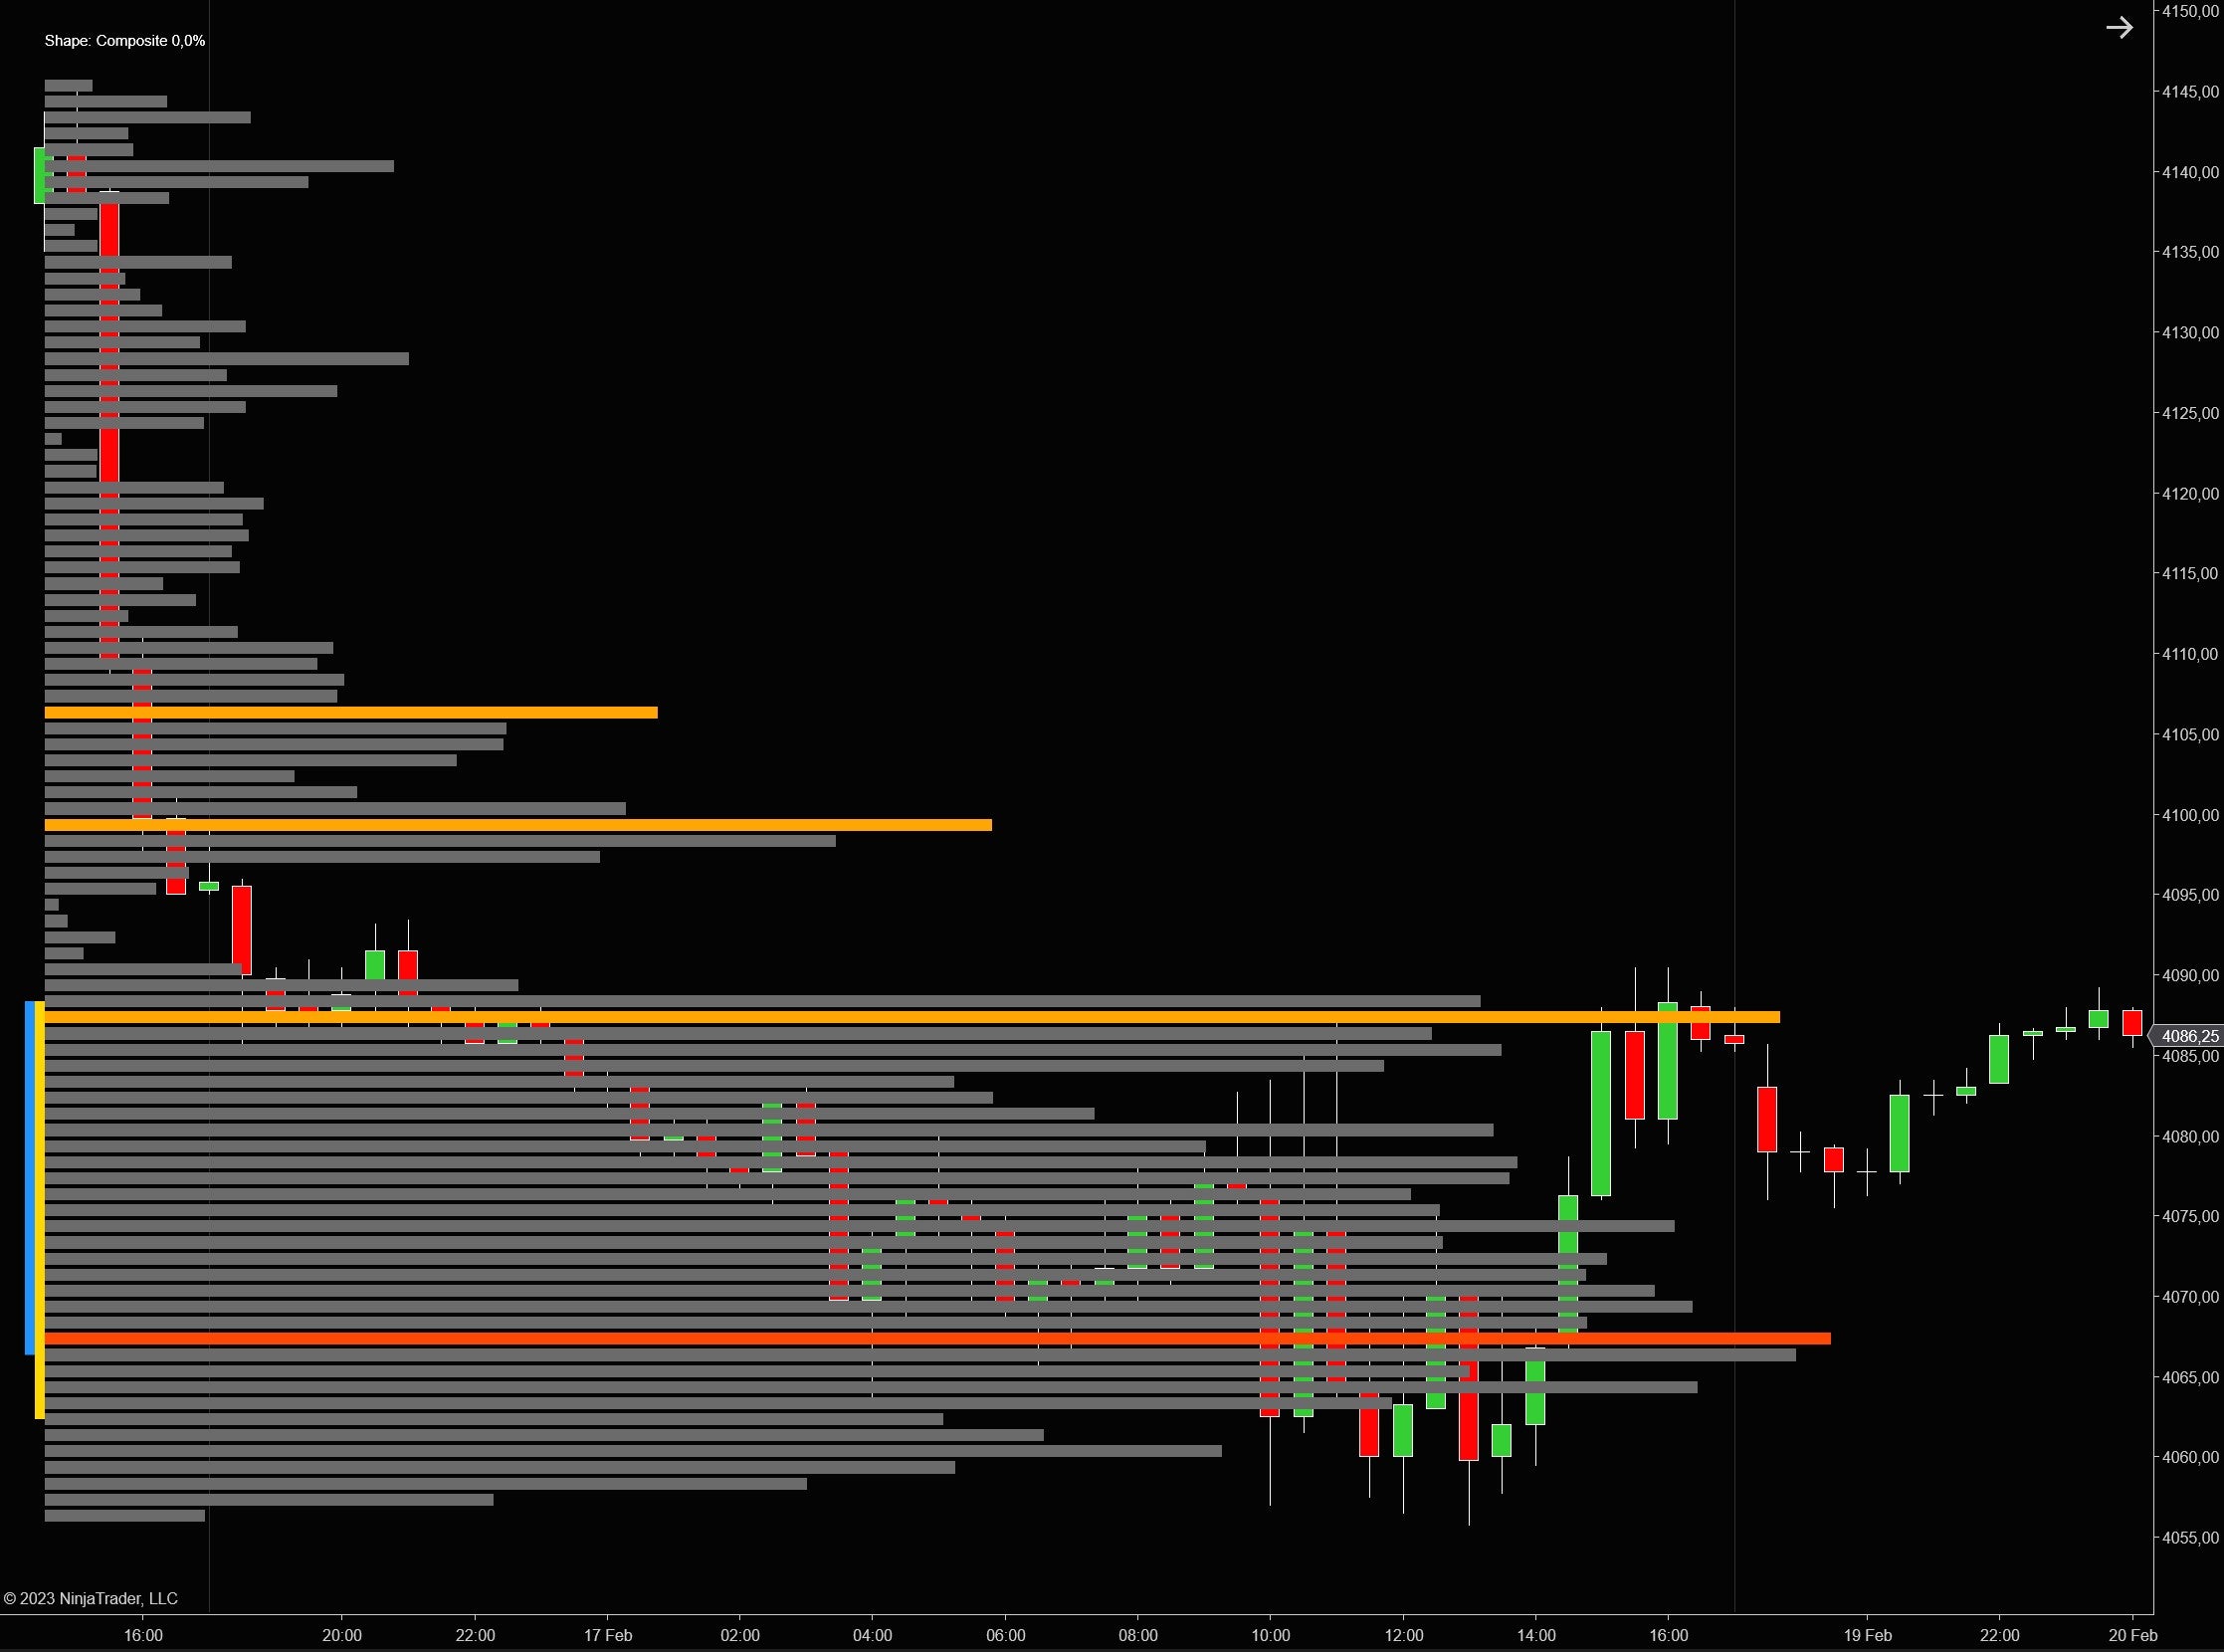
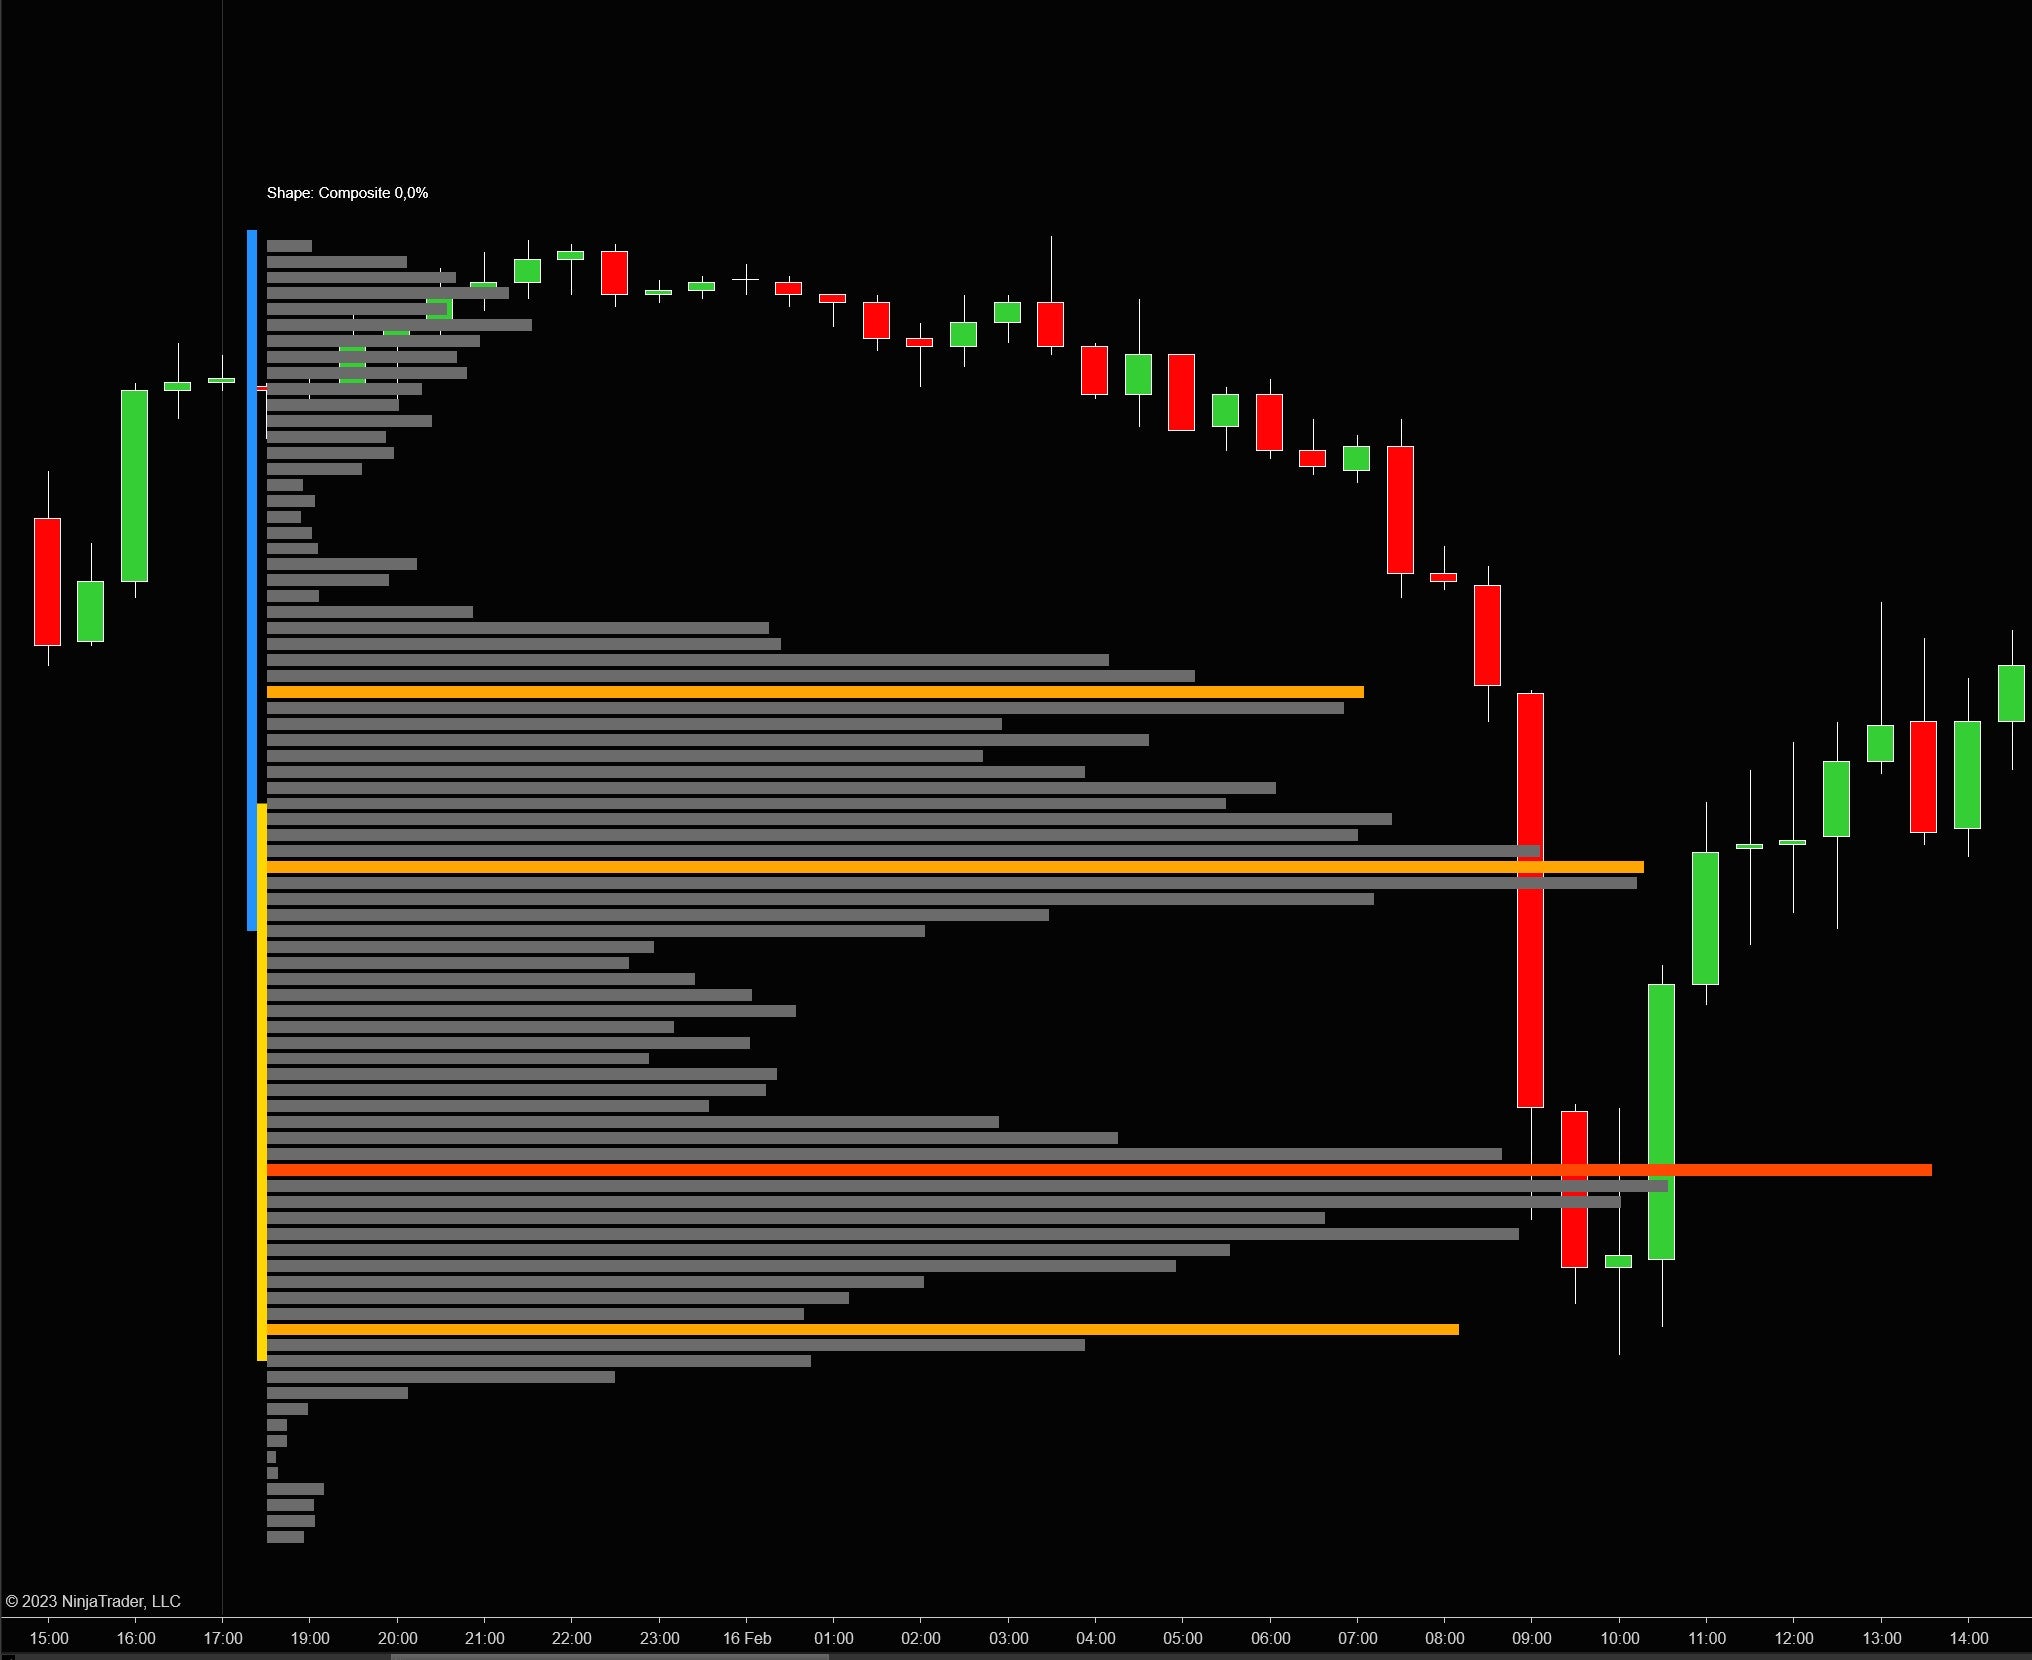
Paint bars
Our volume profile indicator offers users the flexibility to customize the display of the candles in relation to the volume profiles. Users can choose to hide the candles completely, allowing them to focus solely on the volume profile data.
Alternatively, users can opt to place the candles in front of or behind the volume profiles, depending on their analysis preferences. Placing the candles in front of the volume profiles allows for a clearer view of price movements in relation to the volume data. On the other hand, placing the candles behind the volume profiles can help emphasize the volume data and make it easier to spot significant levels of buying and selling activity.
Hide candles
Candles in front

Candles to back

Bloodhound & automated strategy support
The volume profile indicator exports several plots which you can use from within your own strategies, bloodhound, ninascript or strategybuilder
Available Plots
VP Value area high
The current value area high of the volume profile
VP Value area low
The current value area low of the volume profile
VP POC
the current point of control of the volume profile
Low Volume Node Price
The price of the low volume node which is the closest to the current price
Low Volume Node Distance
The distance in ticks between current price and the nearest low volume node
High volume node price
The price of the high volume node which is the closest to the current price
High volume node distance
The distance in ticks between current price and the neart high volume node
TPO value area high
The value area high price of the TPO/market profile
TPO value area highThe vale
TPO Value area low
The value ara low price of the TPO/market profile
TPO POC
The point of control of the TPO/market profile
VWAP
Price of vwap
Available Plots

Change log
- for daily sessions it uses the same trading hours s ninja's orderflow VP does.
- lines are now by default extended until the next profile starts
- added fixed interval session type for if you want to display a new VP every x mins
- added option to show profile summary (total volume & range)
- fixed: lines of previous VP's'.
- fixed: small bugfixes.
- fixed: small bugfixes.
- fixed: issue that volume profile indicator did not show up on some pcs.
- fixed: monthly profiles.
- new: option to choose how many profiles to display.
- new: option to show the total volume or delta (text) next to current profile.
- added plots for previous/yesterdays profile.
- fixed issue that dropdown menu appeared multiple times in chart menu after saving workspace and reloading ninjatrader.
- fixed error in ninjatrader log when using volume profile in bloodhound.
- new: added support for bloodhound/strategies ninjascript.
- new: added option to extend lines for more then just the last 2 profiles.
- new: added option to extend high/low volume nodes for more then just the last 2 profiles.
- new: added region size for Low and high volume nodes.
- fixed : volume profile not showing up when not enough days of data were loaded.
- fixed : pivots are now rendered on correct price.
- fixed : session high price now shows correct price.
- added option to show full session profile.
- small bug fixes.
- added dropdown menu.
- fix problem with VP's on monday
- improved precision on low volume markets.
- fixed some issues on RTY, GC and CL
- Added option to show RTH, ETH, or both sessions
- added context menu to quickly show/hide extend RTH/ETH volume profiles
- Added context menu to quickly extend todays or yesterdays lines
- Todays volume profile can now be shown at the start of session
- width of lines can now be set
- new option to specify if the volume profile for the current day should be shown at the start of the session or right of the chart
- new option to extend the levels of the current day
- fixed issue with NinjaTrader 8.0.2.4
- small bugfixes
Customers also look at
The following products are often combined with the orderflow footprint indicator
Join us on discord
https://launchpass.com/tradedevils-indicators1/member
Want to chat with us and other traders? Got questions on our indicators ? Or want to know more about our products? Then join us on discord for just $1 a year
