


Overview
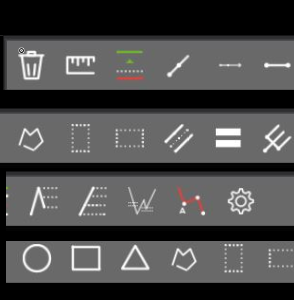
The TDU Toolbar is an advanced toolbar that not only contains all the default drawing tools but also adds some new custom drawing tools every trader needs with new added features for 2025.


Key Tools
Ruler tool drawing tool
With the ruler tool you can quickly and easy determine the number of ticks and price of a range together with the number of bars and time span. It's super easy just draw a simple line and the tool will show you the following
- Amount in $
- Numer ticks
- Number of bars
- and the total time spend

Risk/Reward drawing tool
Want to know if your trade has a good risk/reward ratio? That is exactly what our risk/reward drawing tool allows you todo. Simply draw a line from your SL to your entry and the drawing tool will show all the risk/reward levels. You can optionally show the profit made, the number of ticks reached, and more.

Volume profile drawing tool
The volume profile tool allows you to see how much volume was traded and at what price. By simply drawing a rectangle around the area you are interested in it, this tool will show you the volume profile for that area. Together with the VAL, VAH, and POC

Supply/Demand zones
Every trader knows about support/resistance or supply/demand zone. Most traders draw these lines on their chart which works but is cumbersome. You constantly need to extend the lines further to the right as time goes by. Our supply/demand zones allow you to draw a supply/demand zone with a single click. they will auto-extend and you can choose to stop this when they get broken or not. resistance lines will be colored red and support lines will be colored green. When the price goes through one of your zones the color will change accordingly

Fibonacci retracement tool
Many traders like Tim Racette from eminimind or David Halsey from eminiaddict trade the 'measured move' and Fibonacci retracements. They enter a trade on a 50% pullback retracement with a stop just under the 61.8% and ride the trade until the target at the -23.6%. Our Fibonacci retracement tool is an extension of the standard one and can show you the exact entry, stop loss, and exit prices together with your risk in $ and tick and your reward in $, ticks, and risk/reward
- Custom Fibonacci retracement drawing tool
- Shows exact entry/exit and stop-loss prices
- Shows risk in ticks and dollars
- Shows target in ticks, dollars, and risk/reward
- Allows you to delete retracement lines

Fibonacci price projections
Our custom Fibonacci price projection drawing tool allows you to draw price projections.
- Custom Fibonacci price projection tool
- clean layout without any chart cluttering
- allows you to delete any of the price lines

Fibonacci time projections
The Fibonacci time projection tool allows you to draw Fibonacci time projections.

Elliot wave drawing tools
Elliot Wave theory is getting more popular every day, and many traders use it to get a feel of where the market might be heading. Our Elliot Wave tool allows you to draw the count (1,2,3,4,5 or ABC or WXY etc) easily on the chart in various colors and degrees

Autorange tool

AB=CD tool
The AB=CD tool is a technical analysis pattern used in trading to identify potential price reversal or continuation zones based on harmonic price movements. It’s a key component of harmonic trading, popularized by Scott Carney and others. This tool allows you to be able to draw the pattern yourself on any chart.

Horizontal Line
This tool allows you to draw a horizontal line anywhere on your chart

ATR and Lag both displayed in Toolbar
We now display both the current ATR and the current Lag for your platform for easy viewing in the toolbar

Custom Labels
You now have the ability to add Custom Labels to your chart simply by adding them to the Toolbar indicator settings.
The default labels are:
2EL, 2ES, HL, LH, HH, LL, New Low, New High, F, Support, Resistance, Breakout, Entry, Exit

Trend Channel
Placing a Trend Channel on the chart allows you to see when the price action breaks out from the upwards or downwards channel

Horizonal Trend Channel
Horizontal Trend channel is a great tool for spotting when price breaks out of a period of consolidation.

Key features
- Custom ruler tool
- Custom risk/reward tool
- Auto range tool
- Custom Fibonacci tool
- Custom Fibonacci reversal tool
- Custom Fibonacci price projection tool
- Custom Fibonacci time projection tool
- Custom Fibonacci zigzag tool
- Volume profile tool
- Measured move tool
- Elliot Wave drawing tools
- Supply & Demand zones
- Gann Square
- Custom arrows
- Delete all drawings with a single click
- AB=CD tool
- Trend channel tool
- Horizontal line tool
- ATR displayed in Toolbar
- Lag displayed in Toolbar
- Custom labels now available
Installation
Changelog
12-Sep-2025 v1.0.0.3
- Added Horizontal line tool
- Added AB=CD tool
- Added Trend channel
- Added Horizontal range
- Added Custom labels
- Added display for ATR in Toolbar
- Add display for Lag in Toolbar
- Improved Up/Down arrows which are now larger
- Improved Settings dialog which is now clearer
23-july-2021 v1.0.0.2
- Added custom Fibonacci time projections tool
22-july-2021 v1.0.0.1
- Added custom Fibonacci projections tool
- Added custom Fibonacci zigzag tool
- Improved custom Fibonacci retracement tool
09-feb-2021 v1.0.0.0
- Added icon to hide/show all user-drawings
- Added horizontal range drawing tool