

Key Features
The only SMC indicator for NinjaTrader which contains ALL the SMC features

Plots BOS / ChoCh
Shows all BOS (break of structure) and Choch (Change of character)
Plots strong & weak swing hi/los
Shows where the strong & weak swing hi/los are
Plots supply/demand zones
Plots supply/demand zones
Plots order blocks
plots the order blocks
Plots fair value gaps
Shows you the fair value gaps
Plots volume profile for BOS
Shows you a custom volume profile for each BOS
Plots Micro structure
Shows microstructure BOS and Choch's
SMC trading
The only SMC indicator for Ninjatrader 8!
Greater chance of success
Follow the big institutional players and follow their moves
Clear setups
Once you studied smart money concepts you will see that your entries become crystal clear.
Great risk/reward ratio
Smart money concepts allow for scalping but also for great swing trading with risk/reward ratios of 1:20 !!
Follow the big money
Never swim against the current again. Always know what the current trend is and where price will be going to
Licensing / Free Trial
1) Send us your Sierra Chart Account name so we can give you access
2) Make sure you are running SierraChart version 2564 or higher (Help->Download current version)
3) enable OpenGL (Global Settings->Graphics Settings Global->Other)
4) when you got access, goto Studies->Click on Add Custom Study and then add the TDU Market Structure custom study to your chart
Smart money / market structure indicator
The TDU Market structure / Smart money indicator is the first indicator for NinjaTrader 8 which can display market structure timeframes in real-time
Our sophisticated trend analysis will tell you if the trend is up and down. It will spot & display BOS (break of structure) when the trend reverses. But not only that, but it will also show you the ChoCH (Change of Character) which often is the first indication that the trend might change or pull back. So you will be the first to know about a potential trend change using our ChoCH markers and will know exactly when the new trend is confirmed using the BOS
Besides the BOS and ChoCH, this indicator will also show you the weak & strong swing hi's and lows and the internal hi & low.
And of course, it draws up the supply/demand zones since that's a major part of the smart money concepts.

Break of structure (SMS/BMS)
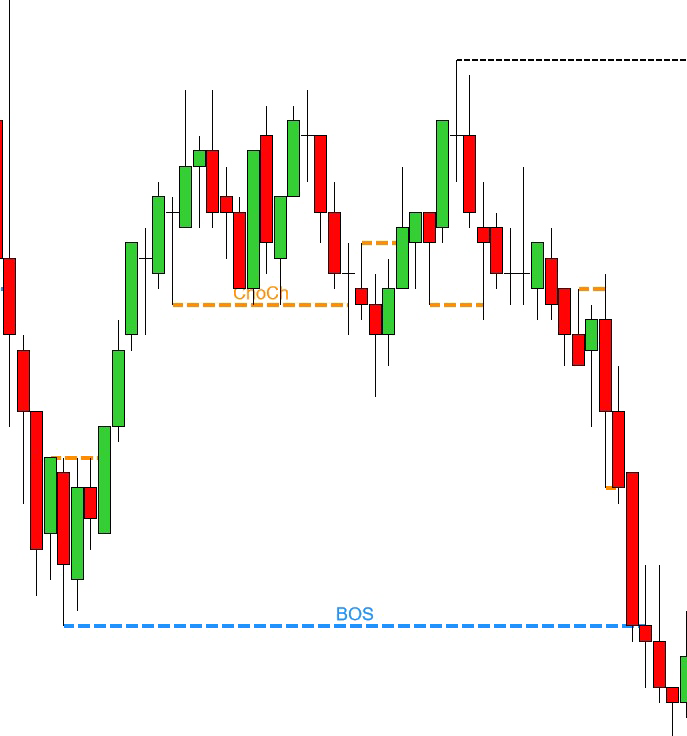
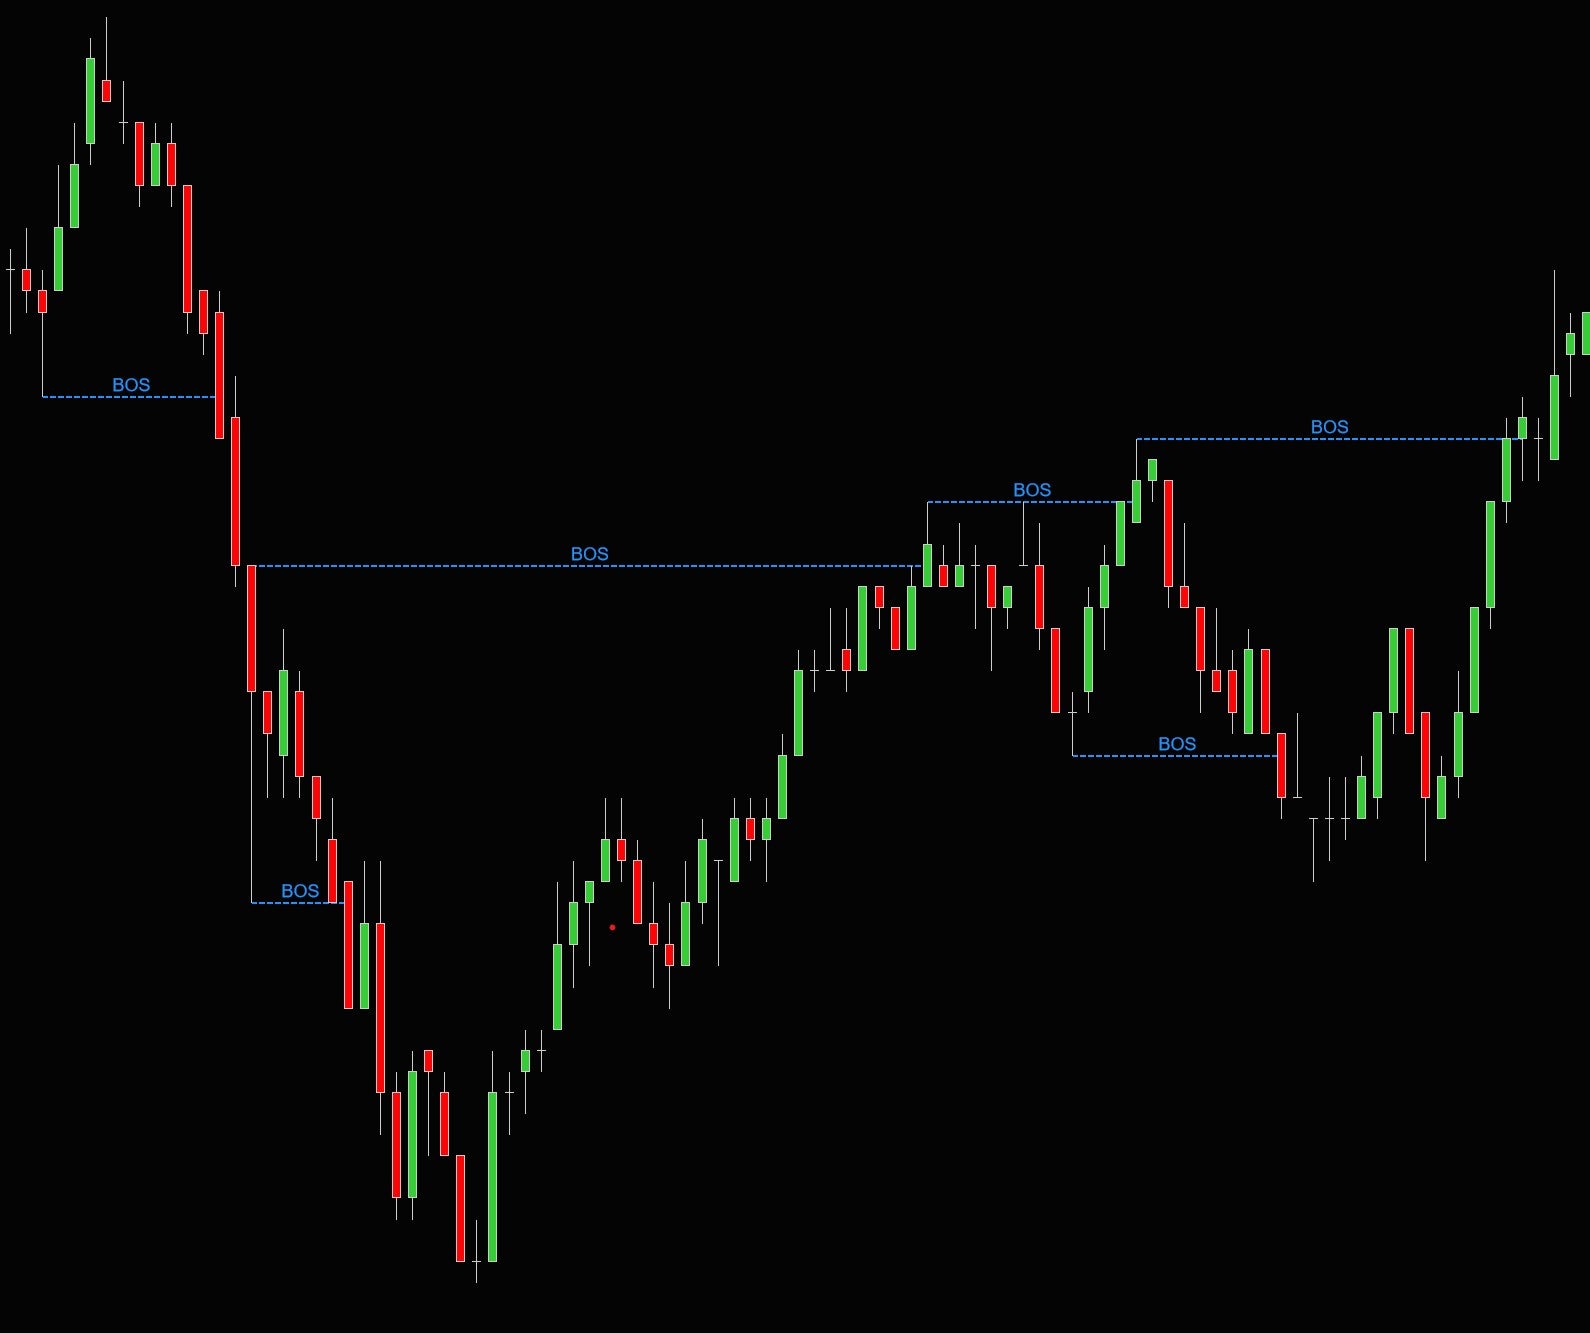
The market structure is the big picture, it detects and shows the trend and detects any trend changes. Using a sophisticated algorithm it detects major swing hi's and lows and plots these on your chart. Trend changes, also known as Break of Structure (BOS) are marked on the chart when they occur.
The following screenshot shows both a BOS to the upside, confirming the bullish trend, and later on, a BOS to the downside confirming that now the trend has changed and is bearish
Note that a BOS itself is not a trade entry. It just tells us the direction in which we want to trade. So a BOS to the upside confirms a long trend, which would mean we would only look for long entries. A BOS to the downside confirms a downtrend which means we only look for short entries
SMS vs BMS
The indicator will show the 1st BOS with the characters SMS which stands for Shift in Markt structure. Subsequent BOS-es will be shown with the letters BMS which stands for break of market structure
Strong and Weak hi/lo's
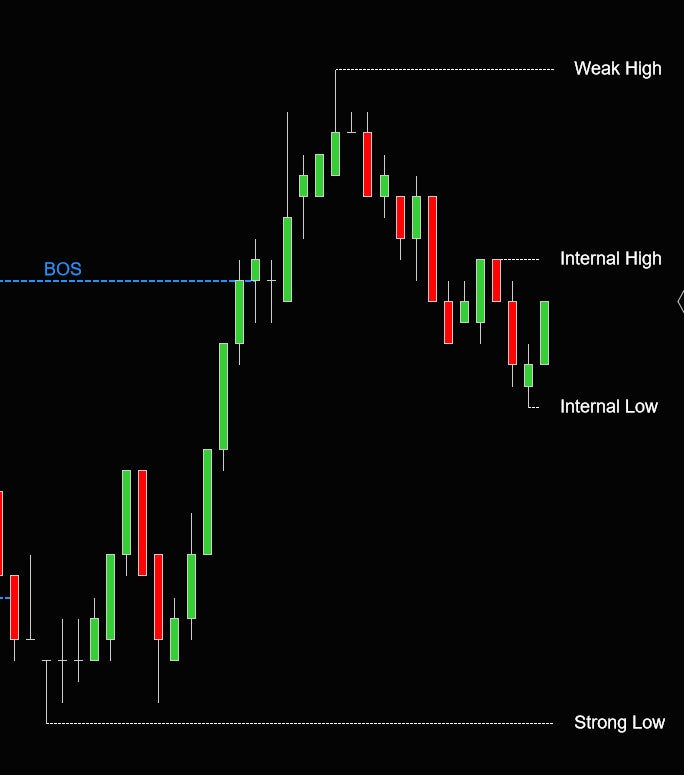
The indicator shows the last important swing high and low and whether it's a strong or weak one.
- A strong high occurs when a new low was formed after the high. If a high failed to make a new low then we consider it a weak high
- A strong low occurs when a new high was formed after the low. uf a low failed to make a new high then we consider it a weak high
In general, we always looking for trade entries :
- With the trend as defined by the last BOS
- And in the direction towards the weak low or weak high
Why do we take trades towards the weak low or weak high? Since we assume that the strong high/low is going to hold. Remember if a Low is able to make a new High then this makes it a very strong low. A lot of money was put into that low to be able to make a new high. So what would we expect after the High? We would expect a pullback to make a higher low. Since there was a lot of money involved in creating a new high we would not expect for price to reverse and take out that strong low. Instead, we expect a pullback to make a new HL, and then take out the weak high to make a new HH
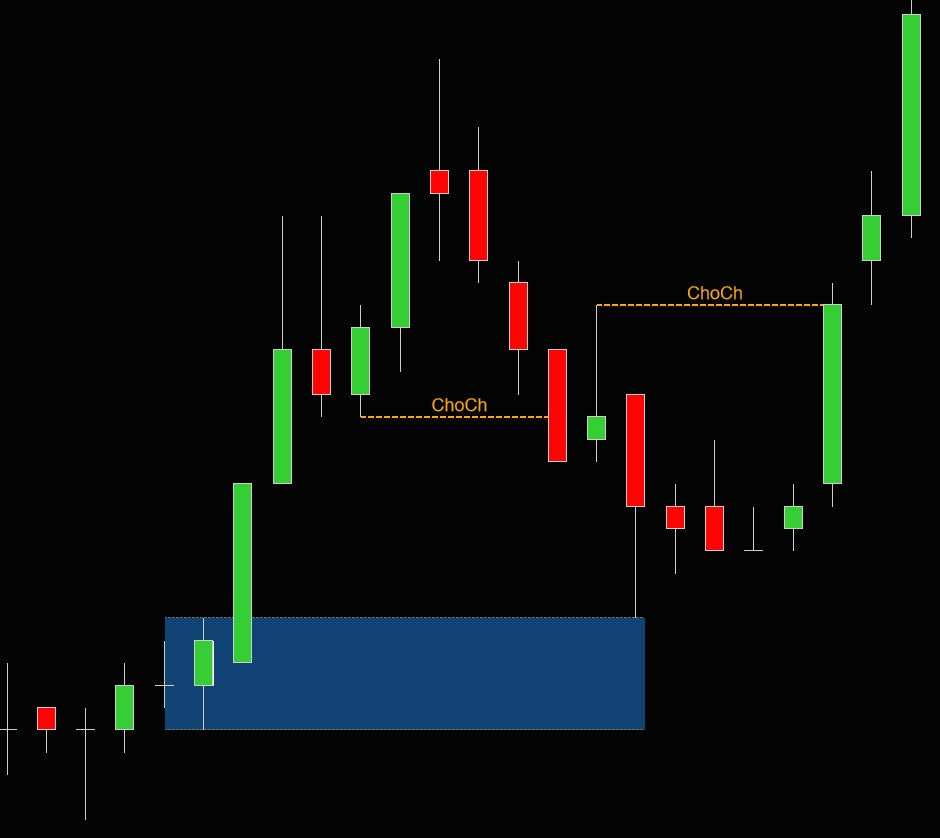
Change of character (ChoCh)
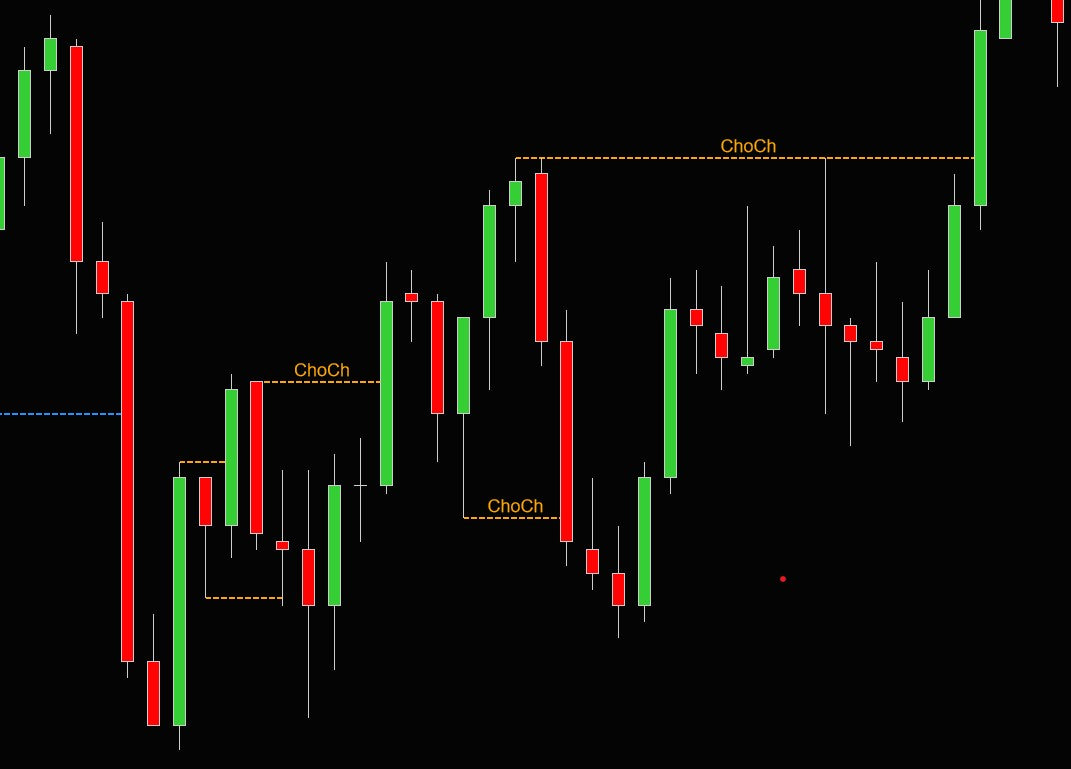
The market substructure is plotting the smaller trend within a bigger trend.
It often shows you the first signs that the trend will pull back or start to reverse. Remember a trend reversal is confirmed by a BOS, However, before we get a BOS we often see a change of character (ChOCh) in the market. When looking for trade entries we always trade in the direction of the BOS. But like we said a BOS by itself is not a trade entry. Instead, we wait for the price to pull back and find then find an entry. Let's say that the trend is bearish, so we had a bearish BOS. Next, we wait for the price to pull back. On a lower timeframe, this pullback often generates a bullish ChoCh. So we wait for a bullish ChoCH on a lower timeframe.. followed by a bearish ChOCH. Now the lower timeframe is aligned with the higher timeframe and the pullback might be over so we can look for a short entry
See the following screenshot which shows a 5min chart with the market structure of both the 15min and 5min timeframes. Note that at the left arrow we get a bullish BOS (blue line) meaning the trend is up. Next, we wait until we get a bullish ChoCH (orange line) on the 5min timeframe which confirms that
Latest updates
Below you will find some videos explaining the latest fetures
Video training course
The indicator comes with an extensive video course describing everything about the indicator, how to trade it, and with numerous trade examples:
Below you will find the first few videos of the course.
Visit the youtube playlist for all videos
Order blocks
The indicator can show Order blocks based on BOS and/or ChoCH

BOS Order blocks
A BOS Order block is drawn from the lowest (or highest) point between the start of the BOS and the break of the BOS
If you look at the screenshot on the left you can see the blue BOS (break of structure). You can imagine that a lot of effort was put into making this BOS possible.
A lot of buyers had to step in and push the market higher , and finally cause a break of structure
Now where did the buyers step in ? Where did price reverse from a down to an up trend ? That was right at the bottom between the start and end of the BOS
The indicator can highlight this with an order block shown as you can see in the screenshot.
You can choose to show the order block using the candle's wick only.. The zone will be drawn forward in time until wicked or broken since in general these order blocks will act as support/resistance zones
ChoCH Order blocks
A ChoCH supply / order block is drawn from last High or Last Low before the ChoCH was made.
For example, on the screenshot to the right, we can see a bearish ChoCH. In this case the last high before the ChoCH is the green up candle. And that is then used to create an order block
These order blocks often act as support/resistance zones. But note that ChoCH zones are not as strong as BOS order blocks


Orderblock settings
In the order block settings you can
- select which order blocks to show (bos/choch or both)
- select what should be considered to break an order block
- and customize the colors
Breaker blocks
The indicator can show breaker blocks

Breaker blocks
A breaker block occurs breaks an order block. The idea behnd this is that now support becomes resistance
So if price returns to the broken order block (= breaker block) then it will act as support/resistance
On the left we see a bullish (green) orderblock which gets broken
Then a red breaker blocks appears. price retets th breaker block which is now resistance and continues downward a few candles later

Breaker blocks settings
Just like with the orderblocks you can customize the colors for the breaker blocks nd enable or disable them
Supply/Demand zone
Supply/Demand zone are zones which get drawn when price moves out of a consolidation range with force.
After a breakout we often see price re-testing the zone before the trend continues
A good example is shown below. We can see a small 4-bar range followed by a big green breakout candle.
The moment the breakout candle closes the indicator will draw the zone
and a few bars later we see price retesting the zone before the trend continues

Supply/Demand zone settings
In the settings you can choose to show the Supply/Demand zones, and whether or not you want to show tested and broken zons and how many zones you want to show. In this example it just shows the 5 most recent zones to keep the chart clean
The min/max bars define how many bars should form the before we consider it a range. In this case the range will be detected when the range is 1-3 bars.
The base bar max percentage defines if a bar is considered part of The Thrust bar min percentage defines how big the thrust bar should be to be considered as a break out
BOS - volume profiles
What is a BOS volume profile ?
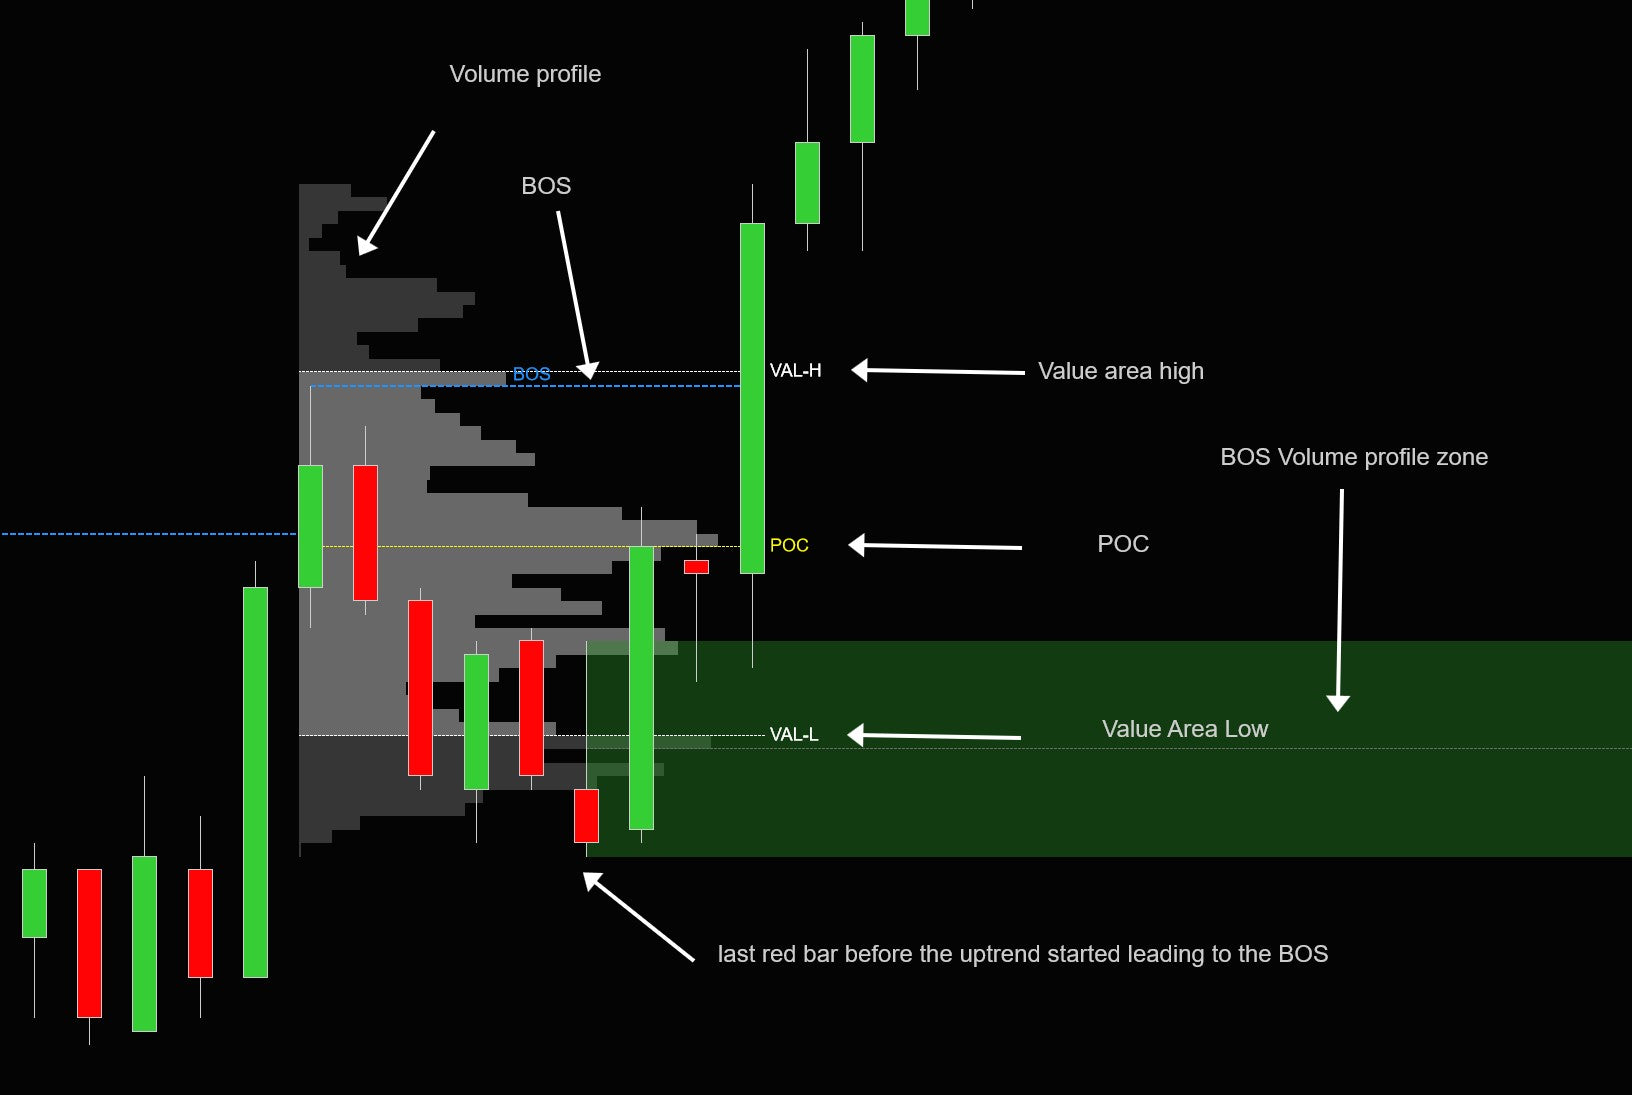
A BOS volume profile is a volume profile which gets calculated from the start of the BOS to the break of the BOS line. The volume profile will show where the most traded volume took place to form the BOS together with the point of control (POC) and the value area
In the screenshot above you can see the volume profile, and the Value area high/low and POC lines.
The POC is the price at which most of the trading during the BOS took place
The Value are is the region in which 68% of the volume traded during the BOS took place
As with any volume profile, we often see that the Value Area high, low and POC become important levels. When price retests these levels it could the find liquidity it needs to continue the trend
BOS volume profile zones
Besides showing you the volume profile and value area the indicator can also show 'volume profile zones' These zones will be drown at the last red- bar touching the value area low in an bullish BOS or the last green candle touching the value area high in for a bearish BOS
Again if price comes back to retest these levels you can often expect a reaction or trend reversal / continuation
Fair value gaps
Fair Value Gaps are a 3 candlesticks patterns, formed when the 3rd candle does not fully overlaps the 1st candle, leaving a gap in the second candle
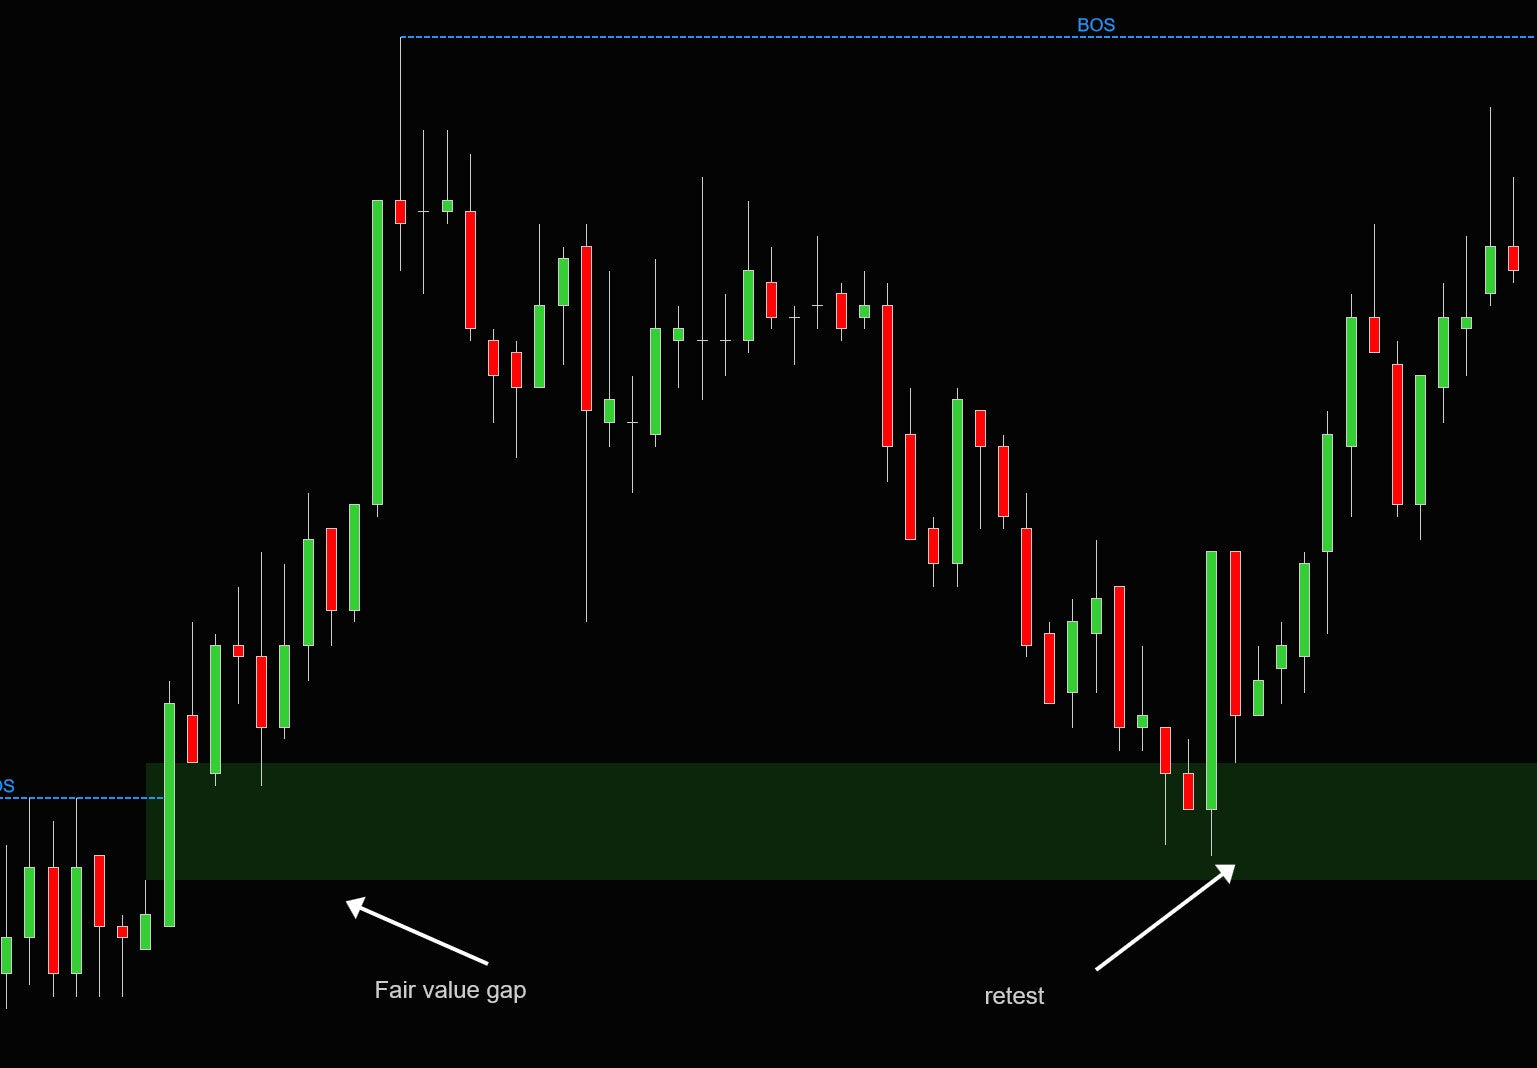
Re-tests
In the picture on the left we see a breakout out of a range which leaves a fair value gap. The indicator will show this fair value gap at the close of the 3rd candle.
After the fair value gap is formed , price first moves up, but then comes back to re-test the fair value gap. After re-testing price moves up again resuming the rend
Settings
You can define the min gap in ticks which is usefull for instruments like NQ which are very volatile. For these instruments you might want a bigger gap then for others.
Further more you can choose if you want to show the Fair Value gaps, and if yes.. how many should be shown. In this example only the most recent 3 gaps will be shown on the chart

Change log
21-oct-2023 v1.0.0.0
- - first release
Customers also look at
The following products are often combined with the orderflow footprint indicator
Join us on discord
https://launchpass.com/tradedevils-indicators1/member
Want to chat with us and other traders? Got questions on our indicators ? Or want to know more about our products? Then join us on discord for just $1 a year
