


Overview
Many traders love to trade Tick charts. Tick charts use the number of ticks passed to determine when a new candle forms. Because of this, new candles get formed faster when volatility increases. And we see candles getting formed slower when volatility slows down. This differs from time-based charts where new candles get formed every 1min for example.
But one common problem with Tick charts is deciding which tick chart to trade. Should you use a 512 tick or a 2000 tick chart. Or perhaps even a 5000 tick chart? Knowing which tick chart to use is very important. But how do you know which tick size to use?
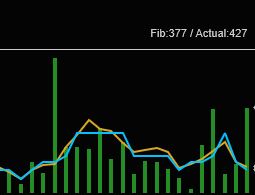
The TDU Recommended Tick Size Indicator tells you which tick chart you should trade in the current market conditions. It recommends but the actual tick value and the nearest Fibonacci number.
When volatility slows down it may, for example, suggest trading a 233 tick chart but when volatility increases you will see the recommended tick size also increasing to for example 512 tick or 2048 ticks or even higher.

Recommended tick size displayed in the menu bar

Recommended tick size shown on the bottom right of the chart
Features
- Shows which tick size to trade for Tick Charts
- Show nearest Fibonacci tick size
- Shows recommended tick size on the bottom right of the chart and in the menu-bar
- Histogram showing how the recommended tick size varies over time due to toe market volatility
- Can give alerts when the recommended tick size changes
- updates in real-time when market conditions are changing
- works on any timeframe
- works on any instrument (crypto, forex, options, futures, stock, etc)
- works on any bar type (time, volume, tick, renko, etc..)

Histogram shows how tick size various over time