

Key Features
A must have for all serious orderflow traders.
Our footprint indicator has all the features orderflow traders need.

Shows all the delta signals and alerts
Divergence, Tails, Reverse, Surge, Flip, Above/Below POC and more
Fully customizable layout
fully customize the look of the left & right cell text, background and bar backgrounds
Bar statistics & Delta bars
Fully customizable bar statistics and Delta bars
Extend any plot/signal
Extend plots/signal into the future until tested/broken
Create custom orderflow signals
Create your own custom orderflow signals (stripes or bar markers) using c++
The best Footprint Indicator for Sierra Chart
Installation notes:
1) Send us your Sierra Chart Account name so we can give you access
2) Make sure you are running SierraChart version 2564 or higher (Help->Download current version)
3) Enable openGL (Global Settings->Graphics Settings Global -> Other)
4) when you got access, goto Studies->Click on Add Custom Study and then add all 4 TDU Footprint custom studies to your chart


All features
Our footprint indicator contains all the features you can think of. Imbalances, exhaustion prints, thin prints, delta signals, you name it. It has all of those and much more.
Fully customizable
You can fully customize the chart to your style of trading. Any color, font can be changed, any signal can be turned on/off and any setting can be adjusted
Best price
Let's be honest.. $399 is a steal for a footprint indicator like this. We see some competitors asking up to $5000 for something which is not even close to what we offer.
All delta signals
single, multiple, stacked, reverse, inverse, overzized, big consecutive, delta flip, delta rise, delta drop, trapped traders, fading momenum and more
Video Playlist
Below you will find a playlist of videos in which we explain all the features
Introduction
Delta Continuous POC
Delta SlingShot
Delta Sweep
Delta Trap
Delta Tail
Delta Drop
Delta Rise
Delta Flip
Delta Divergence
Configuration choices
Custom layouts
Trapped traders
Exhaustion Prints
Volume Sequencing
Volume Sweeps
Unfinished Business
Stopping volume
Zero Prints
Left / Right Cell Text options
You can select what you want to display for the numbers left & right of each candle .
By default we show the Bid/Ask numbers left & right of ach candle.
However you can choose between the following options for the left / right cell text
Left cell text options
| Option | Description |
|---|---|
| None | Show nothing |
| Bid | Show volume traded on the bid |
| Bid/Ask | Show both bid & ask |
| Volume | Show total volume traded on bid&ask |
| Bid Delta | Show Horz delta (ask-bid) when bid outweighs the ask |
| Total Delta | Show total horz delta (ask-bid) |
| Delta/Volume % | Delta/Volume % |
| Bid Diagonal Delta | Show Diag. delta when bid outweighs the ask |
| Total Diagonal Delta | Show total diagonal delta |
| Total Trades | Show total number of trades on the bid |
| Volume % | Percentage of Volume spend at the bid side price |
| Dominant Bid/Ask | Shows the dominant bid or ask |
Right cell text options
| Option | Description |
|---|---|
| None | Show nothing |
| Ask | Show volume traded on the ask |
| Bid/Ask | Show both bid & ask |
| Volume | Show total volume traded on bid&ask |
| Ask Delta | Show Horz delta (ask-bid) when ask outweighs the bid |
| Total Delta | Show total horz delta (ask-bid) |
| Delta/Volume % | Delta/Volume % |
| Ask Diagonal Delta | Show Diag. delta when askoutweighs the bid |
| Total Diagonal Delta | Show total diagonal delta |
| Total Trades | Show total number of trades on the bid |
| Volume % | Percentage of Volume spend at the ask side price |
| Dominant Bid/ask | Shows the dominant bid or ask |
Bar alignment
The bar alignment allows you to choose how you want to align the candle + numbers inside the entire bar
This is very usefull if you are using only displaying text in the left or right cell and use the other cell to display a histogram in the background.
Center:
The candle + numbers + cell backgrounds get centered inside the entire bar.
Use this if you dont use any cell backgrounds, or when you use both left and right cell backgrounds
Left
The candle + numbers + cell backgrounds get left aligned inside the entire bar.
You might want to choose this when you are using a right cell background and no left cell background
Right
The candle + numbers + cell backgrounds get right aligned inside the entire bar.
You might want to choose this when you are using a left cell background and no right cell background
Aligned left

Aligned centered

Left / Right Cell Background options
Beside choosing what you want to show as the left/right cell text you can also select what you would like to see in the background of on the left and/or right of each candle . By default the background for the left/right cell is empty (None).
You can choose to show the volume, delta or Diagonal delta backgrounds in either the left and/or the right cell background
Left cell background options
| Option | Description |
|---|---|
| None | Show nothing in left cell background |
| Bid Volume | Show volume traded on the bid |
| Total Volume | Show total volume |
| Bid Delta | Show horz delta (ask-bid) when bid outweighs the ask |
| Total Delta | Show total horz. delta |
| Delta / Volume % | Show Delta/Volume% |
| Bid Diagonal Delta | Show diagonal delta when bid outweighs the ask |
| Total Diagonal Delta | Show total diagonal detla |
| Total Trades | Show total number of trades |
Right cell background options
| Option | Description |
|---|---|
| None | Show nothing in right cell background |
| Ask Volume | Show volume traded on the ask |
| Total Volume | Show total volume |
| Ask Delta | Show horz delta (ask-bid) when ask outweighs the bid |
| Total Delta | Show total horz. delta |
| Delta / Volume % | Show Delta/Volume% |
| Ask Diagonal Delta | Show diagonal delta when ask outweighs the bid |
| Total Diagonal Delta | Show total diagonal detla |
| Total Trades | Show total number of trades |
Left / Right Cell Background - Brick vs Profile vs Distribution
You have the option to display the background of the left or right cell in either brick or profile style. If you choose brick style, the background will cover the entire cell similar to the appearance of a brick. Conversely, if you select profile style, the width of each price level will vary based on the chosen value, such as volume or delta. It's worth noting that you have complete freedom to customize the left cell separately from the right cell.
Brick
The entire cell background gets filled a color (which color gets determined by the options described below)
Profile:
The background will show a profile where the width of each price level is based on the chosen value (see above)
E.g. if you have choosen volume then the histogram will show the volume traded at each price level
and if you have chosen horizontal delta.. then the profile will show the horizontal delta for each price level
Distribution
The background gets filled with a distribution showing negative values on the left and positive values on he right
Brick Style background

Profile Style background

Distribution Style background

Left / Right Cell Background - Profile direction
When the background is set to profile mode (see above) then you can choose whether the profile direction should be from left->right or from right->left
Profile Direction left->right

Profile Direction Right->Left

Left / Right Cell Background - Scaling
The width and shade of the histogram are dependent on the selected scaling type. You have the option to choose between bar, chart, session, and all. If you select bar, the width and shade of the histogram will be solely based on the bar itself. However, if you choose chart, the width and shade will be based on all bars visible on the chart. In the case of session, the histogram's width and shade will be based on all bars in the current session thus far, and for all, it will be based on all loaded bars.
Bar:
The width of each price level of the histogram is based on the bar only.
Chart
The width of each price level of the histogram is based on all bars visible on your chart
Session:
The width of each price level of the histogram is based on all bars in the current session.
All
The width of each price level of the histogram is based on all bars loaded .
Scaling: Bar

Scaling: Chart

Scaling: Session

Left / Right Cell Background - Color Type
When selecting the cell background color, you can opt for a solid or gradient effect. If you choose a solid color, the background will be shown of with two customizable colors. Conversely, if you choose a gradient, the cell background color will display a shade between the two customizable colors, with the degree of shading varying based on the value.
Solid colors

Gradient colors

Left / Right Cell Background - Color Source
The source of color determines the criteria for selecting which color to use. For instance, if the color source is set to delta, a negative delta value would result in the selection of the red color, while a positive delta value would result in the selection of blue. It's worth noting that the colors can be customized. In addition to delta, other options for color selection include trades, bid, ask, and neutral.
Delta:
The cell background color gets determined by the horizontal delta.
A positive delta will be colored with the positive color (here blue).
A negative horizontal delta will be colored with the negative color (here red)
Neutral:
The entire cell background will be displayed with the neutral color
Imbalances:
The cell background color gets determined by whether there is a buy or sell imbalance.
If there is a buy imbalance then the cell background color will be shown in the positive color.
If there is a sell imbalance then the cell background will be colored with the negative color
Color source: Delta

Color source: Neutral

Color source: Imbalances

Left / Right Cell Background - Color Direction
The color direction determines whether the cell will be shaded in a darker or lighter shade.
Opting for a Light->Dark direction will result in low values being colored with a lighter shade and high values with a darker one.
Conversely, Dark->Light will color low values with a darker shade and high values with a lighter one
Light->Dark

Dark->Light
Left / Right Cell Background - Number of gradient colors
The number of gradient colors options dictates the number of color shade variations displayed for each color (such as red or blue) when gradient colors are activated. A greater number of options corresponds to a higher number of shades shown
A lower number corresponds to less shades.
If you look carefully between these 2 screenshots you will see that the right image has more subtile shades then the left one
2 shades / color

10 shades/color

Entire bar background
Besides choosing a left/right cell background there is also an option to choose the background for the entire bar.
When enabled the background of the entire bar will be colored by the settings you choose.
You can base the bar background coloring on
- Total Volume
- Total Delta
- Delta / Volume %
- Total Diagonal Delta
- Total # of trades
And just like with the cell backgrounds you can choose the scaling, color type, color source, color direction, style and number of colors here too
On the right we see an example where the bar background displays the volume traded at that price level
Darker shades indicate higher volume was traded and lighter shades indicate lighter volume was traded at that price level
The bar background color (green/red) is based on delta. A green color is used to indicator positive delta and a red color for negative delta (of course these can be fully customized)
Finally we see that the right cell displays the horizontal delta as text and as histogram background
Here blue indicates positive delta and red indicates negative delta. Again you can customize everything to your liking

Tick aggregation
The tick aggregation option is a setting that determines how many price changes, or ticks, are grouped together to form a single data point. This setting is important because it affects the level of detail displayed
For example, if the tick aggregation is set to 1, each data point in the indicator represents a single tick at a specific price level. This provides a very detailed view of the trading activity but can also be overwhelming due to the large number of individual data points displayed.
On the other hand, if the tick aggregation is set to a higher number, such as 10, each data point represents the trading activity for a group of 10 ticks at a specific price level. This provides a less detailed view of the trading activity but can make it easier to identify patterns and trends in the data.
With tick aggregation (6 ticks) NQ-5min

Without tick aggregation NQ-5min

Show last traded tick
When enabled this will highlight the last price/tick traded on the current forming bar with a yellow background. It allows you to quickly spot where current price is.. You can of course change the color.

Point of Control and Value Area
The POC or point of control is the price level where most volume was traded within the bar. By default its highlighted by a grey background and a outline around the price level. The value area is where 70% of all volume was traded in the bar and by default its highlighted by a red background for red bars and green background for green bars


POC
The indicator can show the POC(Point of control) for each bar. These are the levels were most most volume was traded.
Continuous POC's
A continuous POC happens when 2 or more candles both have their POC at exactly the same price level
This is an indication that the POC is a strong level and might act as a support & resistance level.
Continous POC's will be highlighted using a different color (yellow by
default). On the right you can see 2 bars with the same POC price


Bullish/Bearish POC
Each bar has a POC (Point of control) which is the price level where most volume in that bar was traded.
When markets are in a normal state we expect the POC to be in the middle of the bar. In up trending markets we expect them to be in the upper 3rd of the bar and in a bearish trend we want to see them in the bottom 3rd of the bar
An bullish or bearish POC is a POC that shows up at the extreme top or bottom of the bar. Its a good reversal signal which indicate that aggresive buyers/sellers stepped in and prevented the price from going lower ( or higher)
RULES:
- Green bar with POC in the lowest 3 price levels of the bar
- Red bar with POC in the upper 3 price levels of the bar
Note you can define the number of price levels. By default its 3 which should be fine for markets like ES. For other markets you might want to change it
Lookback period
You can also define lookback period. When set it will only show a bullish / bearish poc if this bar is the highest (or lowest) bar over the last x bars where x is defined as the lookback period
POC Gaps
A POC gap occurs when the POC of a bar is above the previous bar high price or below the previous bar low price
This is considered a bullish or bearish sign.

Value areas
Value area
The value area is the area where 70% (can be changed) of the total volume of the bar was traded.
By default the value area for a bar will be green for an up candle and red for a down candle. But like everything else, you can fully customize all colors.
The value area can also be extended to the right for a fixed number or bars, until broken , or until tested

Engulfing Value area
An engulfing Value area appears when the value area of the current bar completely engulfs the value area of the previous bar.
On the left we see a green bar which value area gets completely engulfed by the next red bar's value area
You can assign separate colors to bullish & bearish engulfing value area's. In this example the engulfing area has a purple kind of color so its easy to recognize as an engulfing value area instead of a normal value area.
Value area gaps
An value area gap occurs when the value area of the current bar is completely above or completely below the value area of the previous bar.
Value area gaps are often signs that aggresive buyers/sellers are entered the markt trying to push the price higher/lower.
NOTE:
you can define how far (in ticks) the value area should be above or below the previous bar value area to be considered a value area gap
Value area gaps are shown with different color (customizable) to easy distinguish them from the normal value area's

Value Area Color schemes, based on Candle Close or Candle color
The value area for a bar can use one of of the following color schemes.
- Candle color
The value area will be colored red for red bars and green for green bars,
-Candle close:
The value area will be colored based on whether the close of the candle lies inside or outside the value area.
If the close is inside the value area, the value area will be colored grey.
If the close is above the value area high it will be colored green, and if its below the value area low it will be colored red
Value area color based on Candle Close

Value area color based on Candle Color

Zero Prints
Zero prints occur when there is no volume at the bid on the low of the bar, or when there is no volume at the ask at the high of the bar
RULES
- no (0) volume at the bid at the low of the candle
- no (0) volume at the ask at the high of the candle
On the right we see an example of a bar which has no volume at the bid at the low of the bar which is a bullish sign


Thin Prints
Thin prints occur in the candle when there is aggresive selling / buying with almost no counter-trading . With the thin print feature you can highlight the price levels where there is almost no counter trading
RULES
- a bar (red or green) which has one or more low volume price levels on the bid and/ or ask
On the left you can see 2 bars. The first (green) bar has multiple thin prints on the bid colored in green, the 2nd (red) bar has a single thin print on the ask which is colored red since its a bearish sign
The default max volume for thin prints is set to 1. This means that any volume of 0 OR 1 on either the bid or ask will be highlighted
You can change this max volume setting in the indicator settings to any value you like
Fat Prints
Fat prints are the opposite to thin prints and can be used to highlight and extend big volume occuring on the bid or ask
RULES
- a bar which has big volume on the bid or ask
On the right you can see an example of a fat print where the bar has 3000+ contracts traded on the bid
The default threhold volume for fat prints is set to 1000.
You can change this threshold setting in the indicator settings to any value you like


Big Delta
The big delta can be used to highlight and extend price levels in bars with a big delta.
RULES:
A bar that has big delta at one or more price levels
In the screenshot we see a bar which has a delta of -1327 at a price level. This gets highlighted and extended forward until tested or for a specific number of bars. You can set the delta threshold to determine which delta levels should be highlighted
Stopping Volume
Stopping volume occurs when a trend is exhausted and hits a brick wall of traders who are stopping the trend and pushing price in the other direction. We can detect this if the POC (and thus the most volume) is traded at the edge of the candle and the volume traded at the bid or ask is higher then the previous 10 candles
RULES:
- Green bar with POC near the low of the candle
- there is more volume traded at the bid at the lowest 2 price levels in the current candle then there was traded at the bid at lowest 2 price in the last X candles
- Red bar with the POC near the high of the candle
- there is more volume traded at the ask at the highest 2 price levels in the current candle then there was traded at the ask at highest 2 price in the last X candles


Volume sequencing
Volume sequencing occurs when we have multiple price levels with increasing volume. When we see this we know the big guys are aggresively buying this market up (or selling it down)
Bullish volume sequencing is colored with a blue background and bearish volume sequencing with a magenta background. Ofcourse you can change these colors as you wish
RULES:
Bullish volume sequencing
- 5 or more price levels with increasing volume on the ask
Bearish volume sequencing
- 5 or more price levels with increasing volume on the bid
On the left we see a footprint chart in which 3 bars contain volume sequencing. A clear indication the trend is up
If we take at the first bar then we can see buyers pushed the market up from the low and bought it up with increasing volume (0, 17, 165, 181 ,573). Each price level has an increasing volume
volume sequencing can also be extended tot the right for a fixed number or bars, until broken , or until tested
Exhaustion prints
Exhaustion prints indicate weakness. In an up trend we would like to see a good amount of contracts traded at the high, while in a downtrend we would like to see a good amount of contracts traded at the low. If this is not the case and we see only a small amount of volume at the high in an uptrend, or at the low in a downtrend then this indicates weakness or exhaustion. The trend might come to an end or go into a consilidation area
RULES:
Bearish exhaustion prints:
- red candle with (almost) no volume at the ask at the high of the bar
Bullish exhaustion prints:
- green candle with (almost) no volume at the bid at the low of the bar
On the right we see price going sideways at a high printing several bars with bearish exhaustion prints. Then price suddenly drops
At the bottom again we see bearish exhaustion prints occur and 1 bar later the market reverses up again
By default the threshold for the exhaustion print is set to 10. So any cell at the high or low with a volume less of 10 will be marked as an exhaustion print.
Ofcourse you can customize the threshold, colors and you can even extend the threshold into the nex bars or until broken if you would like


Unfinished business
An unfinished auction occurs when the high (or low) has both buy and sell volume. The presence of bid trades at the high (or ask trades at the low) of a bar could mean that movement has not yet been exhausted and there is a probability that price will return to that level soon to complete the process.
RULES:
- New high with numbers at bid AND ask at high of the bar
- New low with numbers at the bid AND ask at the low of the bar
Sweeps
Sweeps occur when aggresive buyers or sellers enter the market and aggresively start pushing price higher (or lower). These actions often leave small volume nodes behind which we can recognize with the sweeps
On the right we see a sweep through the bar with 4,0,0,0 volume at the ask
sweeps can also be extended tot the right for a fixed number or bars, until broken , or until tested


Fading momentum
The fading momentum signal indicators that a trend or swing is weakening and likely to reverse or go into a consolidation phase
RULES:
Bearish:
-3 bars with positive delta , were the delta of each bar is lower then the previous bar
Bullish:
-3 bars with negative delta were the delta of each bar is higher then the previous bar
In the example on the right we can see 3 bars with negative delta going from -131 -> -52 -> -29. Clearly sellers are drying up and momentum is fading. When that happens we see the Fading momentum marker being drawn on the 3rd bar and the horizontal stripe being drawn by the indicator. After that bar the market rips higher.
Bar statistics
The indicator can display bar statistics above and below each candle. In the indicator settings, you can define what should be displayed in each row above and below the candle. You can show up to 4 different rows above the candle and 4 different rows below the candle

Bar statistics settings
The indicator can display bar statistics above and below each candle. In the indicator settings, you can define what should be displayed in each row above and below the candle.
You can show up to 4 different rows above the candle and up to 4 different rows below the candle


Bar Ratio
The bar ratio is a number which can be found above a red bar or below a green bar.
A ratio between 0-0.7 indicates price defence or stopping volume
A ratio of 30 or higher indicate market exhaustion
RULES:
Bullish : ratio between the lowest 2 bids in the candle
Bearish : ratio between the highest 2 asks in the candle
On the left we see an example of a red bar with a ratio of 73. After the bar closed price dropped for 10 points
Bar Markers
The footprint indicator can show markers for each footprint signal above/below each bar. Bullish signals will be shown beneath the candle and Bearish signals will be shown above the candle

Bar marker settings
you can turn on/off any marker signal you like in either the indicator settings or via the dropdown menu.
On the right you can see the list of all the signals and the marker they will print on above/below the char, and the default symbols for them which you can change in the the indicator settings.
Bullish markers will be plotted under bar
Bearish markers will be plotted above the bar

Volume filter
Sometimes a footprint could be a bit overwhelming, especially if you are only interested what the BIG guys are doing. That is exactly why we developed the big trades/big orders filter. It filters out all the noise and only shows the biggest trades
By filtering out all the noise, the footprint chart becomes very easy to read. All the big trades become clearly visible so the BIG guys can't hide anymore
The filter will fiter our all price levels which have a bid or ask below the certain threshold. You can set the threshold to anything you like, depending on how much 'noise'you want to filter our.The exact value depends a bit on the market and timeframe you are looking at
As a guideine we would recommend to set the filter to a value so it shows 5-10 signals during a full trading day
For the ES 15 range chart that would be +/- 750
On the right you can see an example of an ES 15 range chart with the Big Trades/Big orders filter set to 750.
You can clearly spot these big orders. You can optionally extend them to the right since these big trades/orders often provide a pool of liquidity to form strong support/resistance levels


Volume filter
With the volume display filter you can filter out any volume levels below a certain threshold. For example here we see 2 bars. The left bar is a normal bar without any volume display filtering. But on the right bar we set the volume display filter to 100. Any value below 100 will not be shown and filtered out
This is especially usefull when combining it with the volume filter mentioned above
Volume divider
Some markets like crypto may have very high numbers. To make these a bit more readable you can shorten the big numbers like we mention below. Another option is to divide the number by 10, 100 or more and this is what the volume divider allows you to do
- Divides volume by 1, 100 or 1000
- Choose between 0, 1 or 2 decimal places
Here we see an example of two bars. The left bar is without any volume dividing turned on. And the right bar uses a volume dividing of 10 so all numbers are divided by 10

Delta filter
The delta filter can be used to hide price levels which have a small delta value. It's particular usefull when looking at delta charts (text and/or histogram). By specifying a delta filter we can filter out all the rows which have small delta value. This will cause the price levels with big delta to pop out on the chart


Shorten big numbers
The indicator will shorten big numbers to make the footprint chart more readable. This is very usefull since some assets like crypto show big numbers in the footprint chart. Same thing happens when you are looking at a higher timeframe.
The big numbers will be shown in the bar statistics, the candle itself and ofcourse in the footprint summary table
Footprint summary table
The indicator can show a footprint summary table which shows all the important metrics for each candle
You can fully customize the look & feel of the table and which rows gets shown there
Note : You need to enable
Chart Settings->Chart Data->Historical Pullback Data
if you want to show the COT High / Low values inside the footprint summary table.


Customize what to show
The footprint table can show up to 10 rows. In the indicator settings you can fully customize what to show in each row
Note that you dont have to show all 10 rows. If you only like to to show 3 rows then you can simply disable the other 7 rows by setting it to none
Delta Imbalances
The footprint order flow indicator can show
- normal imbalances
- multiple imbalances
-2nd slot imbalances
- oversized imbalances
- big imbalances
- stacked imbalances
- inverse imbalances
- reversal imbalances

Single imbalances
The indicator will highlight single delta imbalances at each price level. An imbalance occurs when the ratio between the bid/ask is more than a predefined percentage.
By default, the indicator uses a ratio of 400% which is the industry standard but this can be changed.
You can also change the minimum volume threshold for an imbalance. By default the minium volume for the imbalances is set to 1. This prevents imbalances to be shown when one of the two number (bid/ask) is a 0
So when the ratio between the bid and ask is 400% or more and both bid & ask show a 1 or more then indicator will highlight this with a red text color for the bids or blue text color for the asks.
In the screenshot left you can see sell imbalances of 611 / 203 and 107/19
and bullish imbalances of 137/42 and 168/47
Multiple imbalances
The indicator will plot a green or red border around the entire bar when the bar contains 3 or more imbalances on the ask and/or bid side.
As seen in the screenshot on the right we have 3 ask imbalances. Therefore the entire bar is surrounded by a green border.
If we would have 3 or more imbalances on the bid side then the bar would be surrounded by a red rectangle.


Oversized imbalances
The indicator can also highlight oversized imbalances. An oversized imbalance is when the ratio between the bid and ask is 1000% or more.
Again you can change this value but 1000% is more or less the industry standard. When the ratio between the bid and the ask is 1000% or more then the indicator will highlight this with both a red text color AND border for the bids, or a blue text AND border for the asks
In
On the left we see an oversized imbalance of 66/1 on the bid colored by a red text and red outline
Stacked imbalances
Stacked imbalances occur when we have 3 (or more), (this minimum can be changed in the settings) imbalances stacked on top of each other.
Again this can happen on the bid and/or the ask side
When a stacked imbalance is detected we will highlight this by coloring the background
As with all imbalances you can optionally extend them for a fixed number of bars, until tested or until broken
On the right we see that the first bar has 3 imbalances on the ask at the top. A green zone will be drawn from that point until the zone is broken or tested


Inverse imbalances
Inverse imbalances are indications of trapped traders. They occur when there are multiple stacked buy imbalances at in a red bar, (or multiple stacked sell imbalances in a green bar).
These imbalances mean traders went a long (or short) trying to trade a breakout but prices reversed on them and now these traders are trapped in a losing position.
RULES
- red bar with multiple stacked buy imbalances at the top of the bar
- green bar with multiple stacked sell imbalances at the bottom of the bar
On the left you see an example where price breaks out from a consolidation area. Traders go short , trying to trade the breakout, but then the price reverses up again.
The traders who got short got trapped and are now in a losing position
As with all imbalances you can optionally extend them for a fixed number of bars, until tested or until broken
Big imbalances
The indicator can highlight big imbalances with a yellow outline around the imbalance. You can specify the minimum volume difference needed to determine a big imbalance.
For ES this would be around 1300.
Of course, you can define the level (1300 by default), and you should adjust this for the markets you are trading. Big imbalance levels should not appear often. They should occur 1-2 a day. So if you see many imbalances with yellow outlines on your chart then you will need to increase the big imbalance level for your markets.
In the screenshot, you see a big imbalance highlighted by the red text and yellow outline. As you can see 3914 contracts were traded on the bid side, and just 1139 contracts on the ask side.


Second-slot delta imbalance
A second-slot imbalance signal means buyers or sellers have failed to push the market higher or lower. On the chart, this indicated by a diamond
The rules for a 2nd-slot imbalance are
- A green candle and an imbalance on the 2nd row from the bottom of the bid
- A red candle and an imbalance on the 2nd row from the top on the ask
The idea is that buyers spent a lot of volume trying to move the market up, but in the end, the candle closed lower. Since buyers failed to push it up further and the candle closed lower price is likely to continue downwards. See screenshot to the left
Reverse Imbalances
A reverse imbalance is a candle were we see buy/sell imbalances at the edges of the bar and price closing in the opposite direction. This often indicates a posibility for a pullback/reversal
RULES:
Bullish:
- green bar with a sell imbalance at one of the lower 2 price levels
Bearish:
- red bar with a buy imbalance at one of the upper 2 price levels
On the right we see an example of a green candle with a -60 sell imbalance t the bottom of the bar


Consecutive Imbalances
Consecutive sell/buy imbalances occur when we have a buy (or sell) imbalance at the same price for 2 or more bars
If you enble to show consecutive imbalances then these will be highlighted. An example can be seen in this screenshot where we have 2 bars which both have a sell imbalance at the same price
This is an indication that an aggresive seller is active here and defending the this level in an effort to push the market lower
Delta Signals
The footprint order flow indicator can show several delta signals like
- Above / below POC signal
- Delta Rise
- Delta Drop
- Delta Tail
- Delta Reversal
- Delta Divergence
-Delta flip
- Delta Trap
- Delta Continous POC
- Delta Sweep
- Trapped Traders

Above / Below POC signals
The Above/below POC signals are very powerful signals when they occur at new swing lows or swing hi's. They indicate the market reached a top (or bottom) and is ready to reverse. The signal is shown on the chart with a red triangle above or green triangle below the candle
Rules:
-A green bar that opens & closes above the POC at a swing low
- a red bar that opens & closes below the POC at a swing hi
Delta Rise signal (S)
The delta rise signal is a 4-bar signal and is indicated with the letter 'S' and/or a magenta vertical stripe. The signal happens when there is a sudden increase in the delta and when the delta is getting stronger and stronger. This is often a tell that buyers (or sellers) are in control and the market is/might be starting to trend.
RULES:
-4 consecutive bars with increasing delta
EXAMPLE:
Here you can see an example of a delta rise signal. The first bar has a negative delta of -461, then in the next bars we see the delta increase to positive 119->429->620
So in 4 bars, we went from -461to +620 where each bar is getting a higher positive delta. When that happens the delta rise signal will be plotted


Delta Divergence signal (D)
The delta divergence is a trend reversal signal. Only look for these signals when they occur at (or near) a swing high/low. The Delta divergence is plotted in the footprint table with the letter 'D' and a blue vertical stripe.
RULES:
- Price makes a new low with a green candle and positive delta
- Price makes a new high with a red candle and negative delta.
You can choose between two different modes to detect new highs or lows:
Session or Candle mode
This setting lets you change how a new high or low is detected
Session:
- A new high/low is formed when price breaks the high /low of the day
Candle:
- a new high/low is formed when price breaks the previous bar low/hi price.
EXAMPLE
In the screenshot on the left we can see the trend going up and making a new high.. then just after making a new high, we get a red candle with a bearish delta divergence signal and then the trend reverses and goes down
Delta Flip signal (F)
The Delta flip signal is a 2-bar signal. It triggers when there is a sudden shift in Delta from positive <-> negative and indicates a potential reversal. Again look for these signals at important places like swing lows/hi's. The delta flip is shown in the footprint chart with the letter 'F' and a yellow vertical stripe
RULES
-The first bar closes on its min-delta and has a max-delta around 0.
-The next bar closes on its max-delta and has a min-delta around 0
Or
- the first bar closes on its max-delta and has a min-delta around 0.
-The next bar closes on its min-delta and has a max-delta around 0

Delta Tail signal (T)
A delta tail signal occurs when a bar has a negative delta at all price levels except the bottom of the bar and vice versa. It is plotted on the footprint table with the letter 'T' and an orang vertical stripe
RULES
-The bar has a negative delta at all prices except the top or
The bar has a positive delta at all price levels except the bottom
EXAMPLE
On the left you see a bar that has a negative delta at all price levels except at the top.
Delta Reversal signal (R)
The Delta Reversal signal gets plotted when a bar has an above-average max and min delta. It is plotted with the letter 'R' and a light salmon vertical stripe
RULES
- The bar has above-average max and min delta
EXAMPLE
On the right we see that the second bar has a high max and high min delta, and prices reverse.


Delta Drop signal (O)
The delta drop signal is a 4-bar signal and is indicated with the letter 'O' and/or a red vertical stripe. The signal happens when there is a sudden decrease in the delta and when the delta is getting weaker and weaker . This is often a tell that the current trend might be ending and we will go into a consolidation or reversal.
RULES:
-4 consecutive bars with decreasing delta
EXAMPLE:
Here you can see an example of a delta surge signal. The first bar has a delta of 596, then in the next bars we see the delta decrease to 13, -109 , -130 So in 4 bars, we went from +596 to -130 where each bar is getting a lower delta. When that happens the delta drop signal will be plotted
Delta trap signal(A)
The delta trap signal is a 3-bar signal.. It tries to identify trapped traders in a strong up/down trend
RULES:
In a downtrend
- a green bar with strong positive delta
- followed by 2 red bars with negative delta which together cancel out the positive delta from the green candle
- last red bar has a value area gap down
In an uptrend:
- red bar with strong negative delta
- followed by 2 green bars with positive delta which together cancel out the negative delta from the red candle
- last green bar has a value area gap up
EXAMPLE:
Here you can see an example of a uptrend.. When price pulls back some traders went short thinking the the trend switched bearish. Immediately after we see strong buying coming in again with the Delta Trap signal


Delta Continuous POC signal(C)
Uses a continuous POC as a possible trend continuation signal
RULES:
In a downtrend
- a green bar
- followed by a red bar which has the same POC price as the previous bar and negative delta
- followed by a red bar with negative delta and a value area gap
At least one of the 2 red bars needs to have strong negative delta
In an uptrend:
-a red bar
- followed by a green bar which has the same POC price as the previous bar and positive delta
- followed by a green bar with positive delta and a value area gap up
At least one of the last 2 green bars should have strong positive delta
EXAMPLE:
Here you can see an example where price printed a delta continuous POC signal. You can clearly see th continuous POC as its highlighted by the horizontal yellow rectangle. Immediately after this we see another green candle which has strong positive delta. The close of that bar confirms the signal to go long
Delta Sweep signal(W)
Indicates when a big trader enters the market to push the market forward
RULES:
For shorts
- a red bar which contains a market sweep and has strong negative delta
For longs:
- a green bar which contains a market sweep and has strong positive delta
EXAMPLE:
In the example we see market making a bottom and then a green candle gets formed with strong 1220 positive delta and a market sweep. The Delta sweep signal gets highlighted here in the background by a purple vertical stripe. You can customize the colors


Trapped Traders Signal (P)
The concept of "trapped traders" refers to those market participants who find themselves in unfavorable positions due to incorrect predictions about market movements. For instance, consider the situation on the left where a significant amount of selling activity occurs at the lowest point of a price bar, but subsequently, the bar closes green. In this case, the traders who sold at the lowest point are considered "trapped" in a short position, as the market is moving against their expectations.
To mitigate their losses, these trapped traders will need to close their short positions by placing buy orders.
This influx of buy orders can contribute to the existing upward momentum in the market, further intensifying the price increase. In summary, trapped traders are market participants who, due to their incorrect predictions, inadvertently contribute to the continuation of a price trend in the opposite direction of their initial positions.
RULES:
- A green bar in which most volume was traded in the bottom part of the candle
- A red bar in which most volume was traded at the top of the candle
EXAMPLE:
Here you can see an example where some traders got trapped into a short. (Green bar with most volume traded at the bottom)
Delta Slingshot signal(I)
Indicates a possible trend reversal when selling volume gets overrun by buying volume and market closing higher
RULES:
For longs
- a red bar with extreme negative delta
- followed by a green bar which closes above the red bar with positive extreme delta
For short:
- a green bar with extreme positive delta
- followed by a red bar which closes below the green bar with negative extreme delta
EXAMPLE:
In the example we see a red bar with -1321 delta
Then after a consilidation bar the next bar closes above the red bar with with +1669 delt

Delta Signal Vertical Stripes
As shown before you can have multiple ways to show the delta signals. You can show them as bar markers, you can show them in the footprint summary table , but we also give you the option to show a vertical stripe when a delta signal occurs.
The vertical stripes are very easy to recognize and make sure you never miss any delta signal.

Delta Signal Stripe Settings
You can enable/disable which stripes you want to see in the indicator settings, and from our easy to use dropdown menu
Next you can assign a custom color to each vertical stripe

Create your own custom dynamic vertical stripes
You can create up to 5 custom rules for rendering the vertical stripes
Custom stripes are created with a little bit of c++ scripting which you just copy and paste inside the study settings
Below you can see a custom stripes which shows a signal when there is a bar with a thinprint followed by a bar with an exhausion print.
The code for this custom stripe is : (see the section about custom scripts for more details)
if (bars[current_bar-1].is_green_bar() && bars[current_bar].is_green_bar() && bars[current_bar-1].HasBullishThinPrint && bars[current_bar].HasExhaustionPrint) { BackgroundColor=0x00FF00; Opacity=130; } else if (bars[current_bar-1].is_red_bar() && bars[current_bar].is_red_bar() && bars[current_bar-1].HasBearishThinPrint && bars[current_bar].HasExhaustionPrint) { BackgroundColor=0x0000FF; Opacity=130; }


Alerts
The footprint indicator is equipped with a highly adaptable alert system. It allows you to activate as many as 10 alerts and select the corresponding signal for each alert. For instance, you can configure alert #1 to trigger when an exhaustion print emerges, while alert #2 can be set to activate when a delta trap is detected. The choice is yours.
Additionally, each alert can have its unique sound, and you can easily enable everything from the indicator settings.

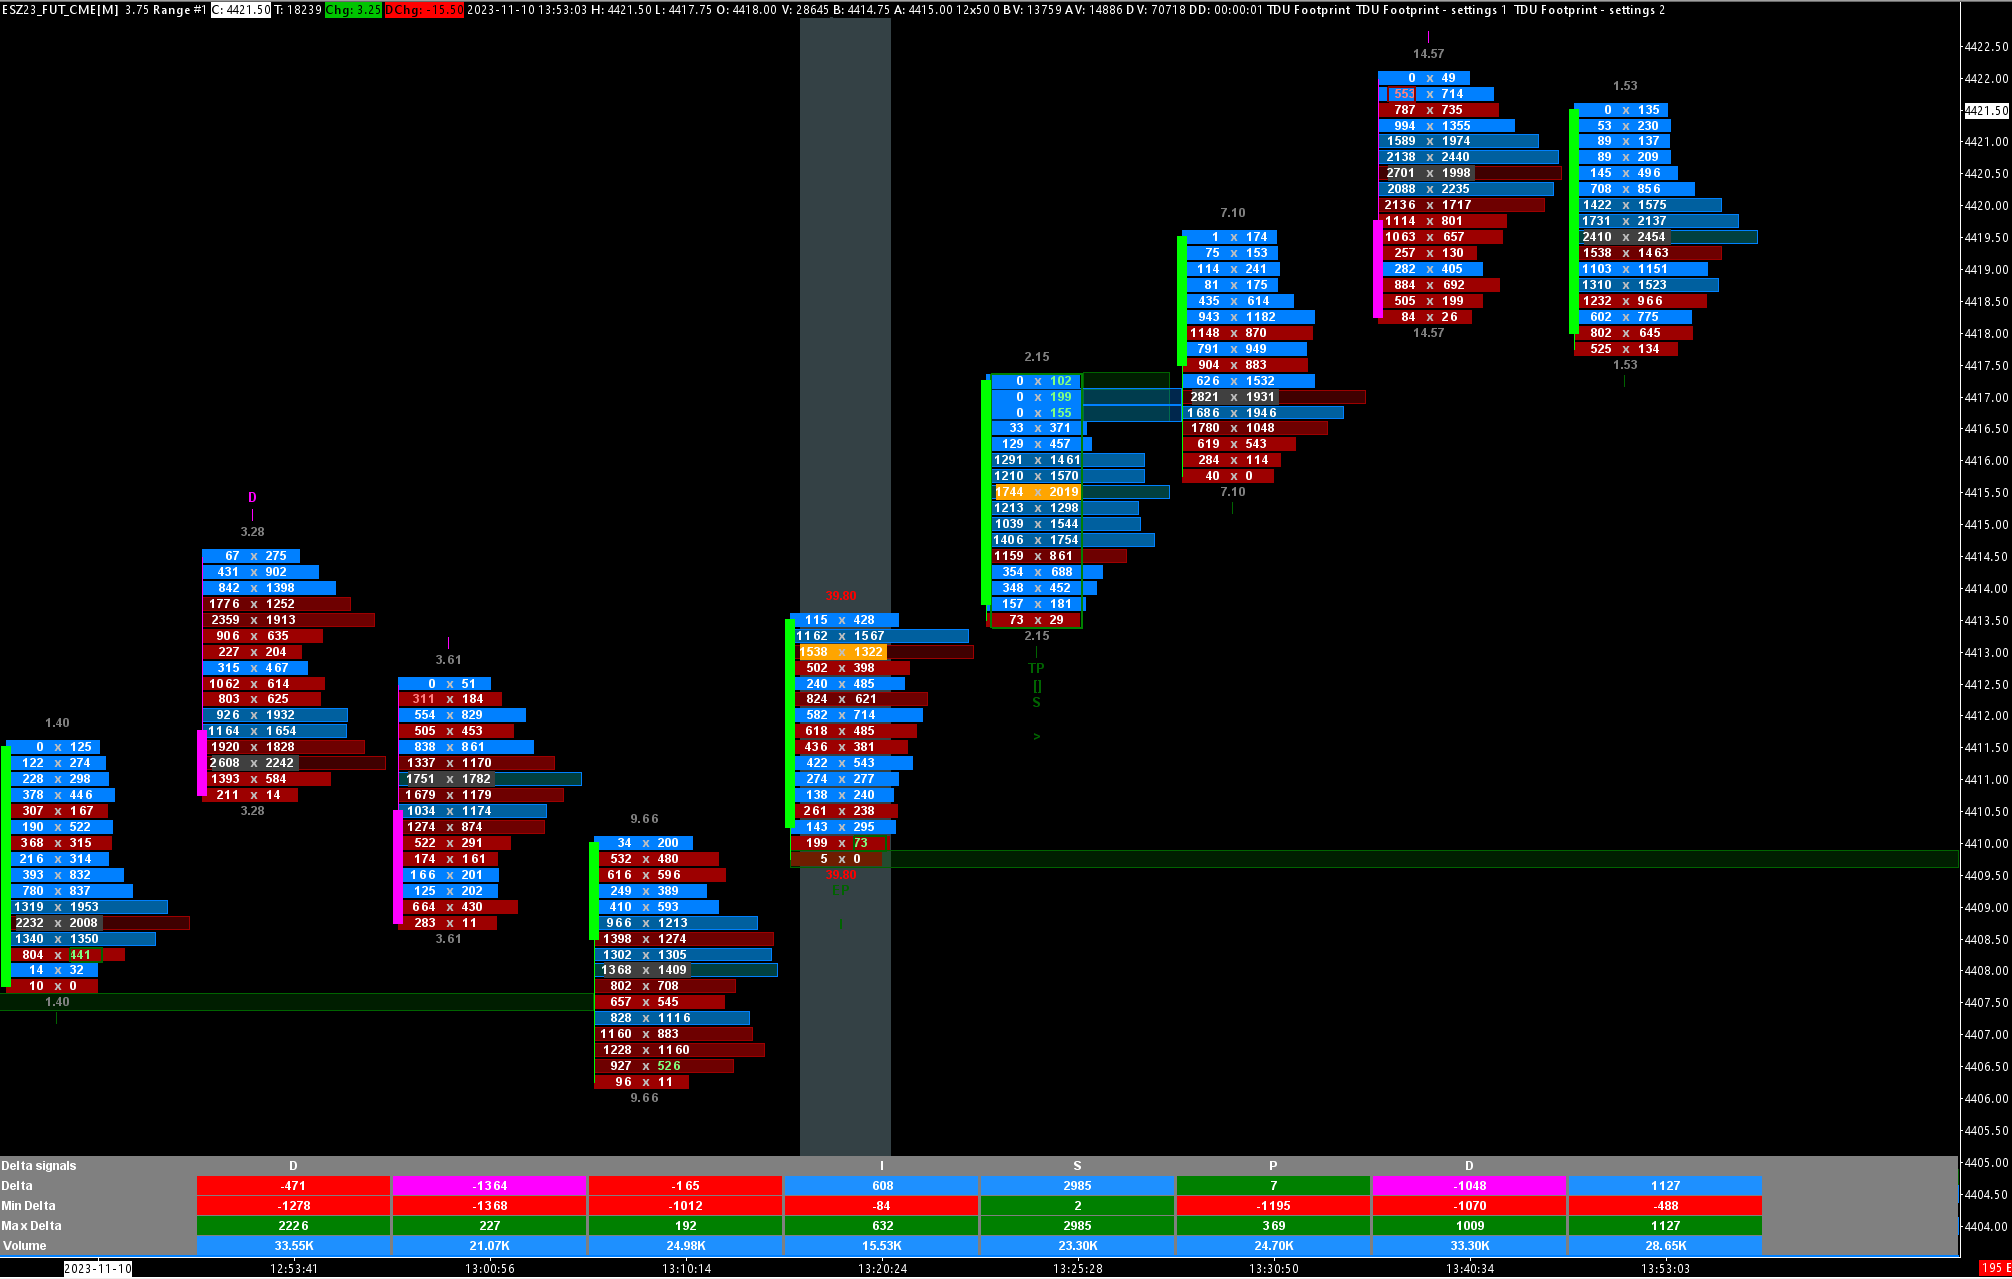
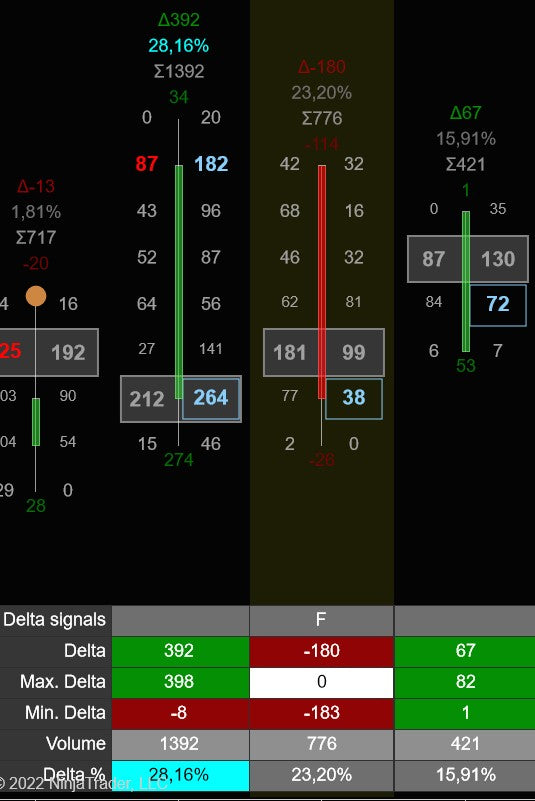
Delta bars
You can (optionally) show delta bars above the footprint summary table.
The delta bars give you a quick glance if there is a a sudden delta % increase or decrease by just looking at the height of the delta bars.
Beneath the delta bars you can also show optionally show the delta percentage, delta ,and volume


Delta bar settings
In the delta bar settings you can define the maximum height for the delta bars. If you find the current delta bars to high then just lower this number a bit, and if they are too small then just increase it a bit. The default value of 10 should be ok for most users and screen sizes
Next you can choose whether you want to show the delta percentage, delta and or volume below the delta bar
And finally you can change the colors of the delta bars
Quick Dropdown menu
The footprint indicator comes with a quick menu which allows you to quickly change layouts and/or djust settings right from the chart
just click on the blue FP icon and the menu will appear

Custom scripts syntax
The indicator allows you to use C++ script to define color coding rules. With these scripts, you can create advanced rules that determine what foreground and background color an item should have based on the rules you define.
You can define custom rules for:
- Bar statistics
- Vertical stripe
- Footprint summary table cells
For example lets say you want the volume displayed in the bar statistics to be the color cyan when the volume is more then 10.000
You can do this using the following rule
if (bars[current_bar].Volume >= 10000) TextColor= 0xffff00;
This simple rule will set the Text color to Cyan when the bar volume is equal to or above 10.000 Let's take it a bit further
if (bars[current_bar].Volume >= 10000) { TextColor= 0xffff00; BackgroundColor=0xffffff; Opacity=220; }
This rule will still set the text color to cyan, but now it also sets the background color to a 30% white (which is more or less greyish)
Since the rules are just c++you can also use things like if, then, else, loops, abs() functions e.g.
if (bars[current_bar].Delta >= 1000) TextColor= 0xffff00; else if (bars[current_bar].Delta >= 0) TextColor =0x00ff00; else TextColor = 0x0000ff;
This will set the Text color to cyan when Delta is equal or above 1000
If its below 1000 then it will set the textcolor to ForestGreen when the delta is above 0 and DarkRed when the dela is below 0
You have access to the complete c++ language and the following variables
Footprint bars/candles
FootPrintBar bars[]
This is the array that contains all the footprint candles with all their properties
current_bar
This is the index in bars[] for the current_bar
FootPrintBar functions:
is_red_bar() - returns if candle is a red bar
is_green_bar() - returns if candle is a green bar
FootPrintBar variables:
These are the variables which are available for each footprint bar
float Open - the candle open price
float Close - the candle close price
float Low - the candle low price
float High - the candle high price
float POC - the candle POC price
float ValueAreaLow - the candle value area low price
float ValueAreaHigh - the candle value area high price
float Ratio - the candle ratio
long Delta = the candleclosing delta
long MinDelta - the candle min. delta
long MaxDelta - the candle max delta
long Volume - the candles volume
long BuyVolume - the candle total buy volume
long SellVolume - the candle totl sell volume
long TotalTrades - total number of trades which occured in the candle
long COTLow - the candle COT low
long COTHigh - the candle COT high
float DeltaStandardDeviation - the delt standard deviation of this candle
float VolumeStandardDeviation - the volume standard deviation of this candle
float TradesStandardDeviation - the trades standard deviation of this candle
long DeltaChange - the change in delt a between the current and previous bar
float DeltaChangePercentage - the ratio between the delta of the current and previous bar
long VolumeChange the change in volume between the current and previous bar
float VolumeChangePercentage - the ratio of the volume between the current and previous bar
float DeltaPercentage - delta / volume of the bar
float BidAskRatio = Buy/Sell volume ratio
float DeltaEfficiency - Delta / Candle range
Footprint bar signals:
The following variables indicate if one of the various delta signals occurred inside the bar or not
bool HasSecondSlotImbalance
bool HasOpenAndCloseAbovePOC
bool HasOpenAndCloseBelowPOC
bool HasBullishPOC
bool HasBearishPOC
bool HasPOCGap
bool HasEngulfingValueArea
bool HasExhaustionPrint
bool HasValueAreaGap
bool HasZeroPrint
bool HasVolumeSequencing
bool HasBullishThinPrint
bool HasBearishThinPrint
bool HasMarketSweep
bool HasDeltaRise;
bool HasDeltaFlip
bool HasDeltaTail
bool HasDeltaReversal
bool HasDeltaDrop
bool HasBearishDeltaTrap
bool HasBullishDeltaTrap
bool HasBearishTrappedTraders
bool HasBullishTrappedTraders
bool HasDeltaCloseAtMinMax
bool HasDeltaSlingShot
bool HasBearishDeltaContinuousPocSignal
bool HasBullishDeltaContinuousPocSignal
bool HasBullishReversalImbalance
bool HasBearishReversalImbalance
bool HasBullishInverseImbalance
bool HasBearishInverseImbalance
bool HasBullishUnfinishedBusiness
bool HasBearishUnfinishedBusiness
bool HasBullishFadingMomentum
bool HasBearishFadingMomentum
bool HasBearishStoppingVolume
bool HasBullishStoppingVolume
bool HasBullishDeltaDivergence
bool HasBearishDeltaDivergence
bool HasDeltaSweep
bool HasBullishFatPrint
bool HasBearishFatPrint
bool HasBullishBigDelta
bool HasBearishBigDelta
bool HasBullishAbsorption
bool HasBearishAbsorption
Change log
xx-xx-2023 v1.0.1.27
- first release.
Join us on discord
Want to chat with us and other traders? Got questions on our indicators ? Or want to know more about our products? Then join us on discord for just $1 a year
