


Overview
The concepts of support and resistance are two basic aspects of day-to-day trading. These tools help traders to clearly establish the points where the price can bounce, allowing them to also determine when to enter and when to exit trades.
While it's true that mastering the concepts of support and resistance can help you build a more effective strategy, it's also true that these tools are subjective, which in many occasions can lead you to make some mistakes.
For this reason, many traders use indicators to correctly determine and draw the perfect support and resistance levels.
Pivot points or daily pivots are one of the most reliable tools for this and today, you'll understand why so many traders love them.
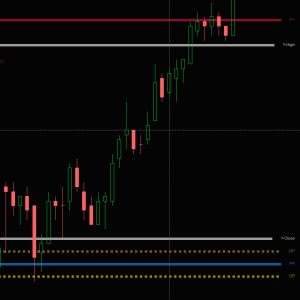
Pivot points are something that has been used by traders since the '80s. Calculated based on the high, low, and closing prices of previous trading sessions, the TDU Pivots indicator tracks and draws key pivot points that can be used to predict key support and resistance levels in the current or upcoming session. Since they are widely known and regularly used, we see the markets respecting these pivots on a daily basis, making them an important consideration for traders in determining suitable entry and exit points, stop-loss positioning, and profit-taking zones.
You can choose between
- the traditional floor trader pivot points
- the Jackson zones
- The Camarilla pivot points
- The Fibonacci pivot points
Key Features
- Plots Traditional floor trader Pivots
- Plots Jackson Zones
- Plots Daily Camarilla daily pivots
- Plots Fibonacci daily pivots
- S1-S4, R1-R4,
- Optionally plots mid-levels
- Directional Pivot, Center Pivot, PP pivot points
- Yesterdays High/Low/Open/Close
- Optionally color the RTH session background
- Works on any timeframe
- Works on any market
- Works on any bar type
- Works with any NinjaTrader version
What are Pivot Points?
Pivot points are a technical market analysis tool that many traders use when trading multiple financial markets on a regular basis.
These points are combined with traditional support and resistance to easily determine the levels at which the price is highly likely to bounce. This tool also allows calculating a series of additional supports and resistances that can help even more for this purpose.
Usually, pivot points are determined from price information, such as the high, low, and closing price of a previous period - usually the day before - and are perfect to help project possible levels of support and resistance in the future.
These daily pivots are especially useful to identify critical levels where a bullish and a bearish market can "collide", a situation in which it can happen that the price rebounds or that there is a breakout.
Pivot points were originally invented by a group of floor traders. These took the high, low, and closing prices of the previous day and then applied certain calculations to determine the pivot point of the current day.
Today, traders of all kinds use this tool to establish a clear balance between a bullish and a bearish trend, even in equity and Forex markets.
Pivot Points structure and calculation
A daily pivots indicator basically consists of several horizontal lines that, depending on the type of instrument used, can contain a variable number of lines between 5 and 10. Since these are trend indicators, the pivot points are implemented directly on the price chart.
As you can see, pivot points consist of support, resistance, and center lines. This is always the case, no matter what type of pivot points you use. The next classification is called "Levels."
Resistance 1 (R1) - First point above PP
Resistance 2 (R2) - Second point above PP, and second above R1
Resistance 3 (R3) - Third point above PP, and first above R2
Basic Pivot Level (PP) - Central point
Support 1 (S1) - First point below PP
Support 2 (S2) - Second point below PP, and first below S1
Support 3 (S3) - Third point below PP, and first below S2
Most of the time, the price moves between these points and usually consolidates near them, since they act as a kind of limit for future movements.
The basic pivot level (PP) lies between an identical number of resistance (R) and support (S) levels, acting as a barrier. The PP point is very important as it's used to calculate the market trend.
There are different ways to calculate pivot points, which are called "types."
Naturally, nowadays you won't need to perform these calculations manually, since for that purpose there are software tools that automatically do all the tedious work, such as the daily pivots indicator from TradeDevils, which you can even use on platforms like NinjaTrader.
However, to understand exactly how these programs work, it's good to also understand how the calculations are performed. Let's start with the basics.
Classic or standard Pivot Points

Typically, this type consists of five levels, but can occasionally include seven. To calculate the levels, you need to take the high, low, and closing prices (C) of the previous day.
I recommend starting at the center pivot point. For this, you must find a sum of high, low, and closing prices and divide the result by 3.
Pivot Point (PP) = (High + Low + C) / 3
Once you have the centerline, it's easier to get the support or resistance levels.
R1 = (PP x 2) - Low
R2 = PP + (High - Low)
S1 = (PP x 2) - High
S2 = PP - (High - Low)
As I already mentioned, in some cases the S3 and R3 levels are also calculated. This is especially useful on days of high volatility.
R3 = High + 2 x (PP - Low)
S3 = Low - 2 x (High - PP)
This is the easiest way to get the pivot points. However, there are other methods to perform these calculations that traders use in more specific strategies. Let's see the most used.
Jackson Zones or Fibonacci pivots

In 1994 J.T. Jackson published his book, Detecting High-Profit Day Trades in the Futures Markets. In this book, he introduced his “zone probabilities” methodology, which has gained increasing popularity over the ensuing years. Jackson’s statistical research indicated that by examining the relationship between the opening price of the day and the previous day’s close, there was a predictive relationship to the current day’s range. While the traditional daily pivots are based on the previous day's open/high/low and close prices. The Jackson zones use Fibonacci retracements and extensions. Statistically, there is a high chance that prices will be attracted to these zones during the day.
This method is probably the most popular of all, is widely used in Forex and stock trading alike. The method basically consists of a recursive mathematical sequence in which a result is obtained from the sum of two previous numbers.
This type can include seven lines. The calculation begins with the kingpin or PP level.
PP = (High + Low + C) / 3
The resistances are calculated as the sum of the PP + the result of the following calculations.
R3 = PP + ((High - Low) x 1,000)
R2 = PP + ((High - Low) x 0.618)
R1 = PP + ((High - Low) x 0.382)
The support levels have the same formula as the resistance pivots, but you shouldn't take the sum but the difference between the high and low prices.
S1 = PP - ((High - Low) x 0.382)
S2 = PP - ((High - Low) x 0.618)
S3 = PP - ((High - Low) x 1,000)
Using pivot points - Basic strategies
Although the main purpose of pivot points is to help you determine support and resistance levels, they can also help you predict the market trend.
Let's see the most basic strategies you should follow when using daily pivots.
Support and resistance levels
Many limited range traders use pivot levels in a very simple strategy: It's about opening a buy operation when the price is close to support levels and opening a sell position if the price is approaching resistance points.
TIP:
Consider that the more times the price approaches the pivot point, this is an indicator of the strength of that level.
Pivot points also work very well for pending orders. If you notice that the price is rising towards the resistance level, you can place a sell limit order. In the case of a stop loss, you can also benefit by simply placing an order several pips above the resistance.
A common strategy for traders is to use a stop order of 5-10 pips - although there are other factors to consider as well.
If you notice that the price is falling, the ideal is to place a buy limit order. A stop loss order should be several pips below the support level.
TIP:
Sometimes it happens that a support pivot can become a resistance pivot if the price falls below it; otherwise, a resistance pivot can turn into support if the price breaks above it.
Rupture levels
Some breakout traders often use this tool to calculate the levels that need to be broken before a future position. If there is a feeling of an uptrend in the market, a good idea is to wait until the asset moves above the first resistance it encounters.
The next step would be to open a buy position and place a take profit at the next resistance level - in this case you can also place a stop loss order below the first resistance.
Another option is to replace your stop loss if the price moves in the direction you predicted. This strategy can also work for a sell trade if you wait until the price breaks the support level on the other side.
You could also try placing a take profit order at the second support level, or setting a stop loss above the already broken support level, or moving it relative to price movements.
Although this strategy seems easy, it's also easy to make a mistake, so it's a good idea to use additional indicators that can provide some confirmation.
TIP:
It never hurts to check the news and economic events, remember that the market fluctuates significantly when certain events occur in there.
Trend
You can also use a daily pivots indicator to define the current market trend. It often happens that when the price breaks below the central pivot point, this indicates a bearish trend. But if the price is above the center, the market can be considered bullish. However, never act until you have confirmation.
If you wish, you can watch a video with a more detailed explanation of how pivot points work here.
4 Reasons why you will love pivot points
1.- Easy to use
Pivot points are easily applied to price charts and provide clearly identifiable signals.
2.- Variety of signals
Pivot points not only help you determine support and resistance levels, but also other indicators, such as the direction of the trend.
3.- Statics
Long-term traders love pivot points because they don't change during the day.
4.- High precision
The fact that a large number of traders use pivot points on a daily basis, is a clear sign that it's a very effective tool to follow market variations.
Summarizing
The pivot points indicator is a useful tool used by traders to easily and quickly establish the support and resistance levels used in their day-to-day trading strategies. In addition, this tool can predict the market trend, so the possibilities skyrocket.
This makes daily pivots a very useful tool, particularly for day-to-day operations.
Changelog
17-may-2023 v1.0.1.9
- fixed issue that dropdown menu appeared multiple times in chart menu after saving workspace and reloading ninjatrader
08-aug-2022 v1.0.1.7
- added dropdown menu for easy access to most common settings
26-06-2022 v1.0.1.6
- added Camarilla daily pivots
- added Fibonacci daily pivots
- added (optional) mid-levels
22-04-2021 v1.0.1.3
- small bugfixes
- added feature to color the background of the price chart during the RTH trading session
04-03-2021 v1.0.1.1
- Added option to show all pivots or only yesterday (last) pivots

traditional pivots

jackson zones