

Please note:
- The Auto orderflow footprint trader does NOT include a Footprint chart indicator
It will work with any footprint chart (including NinjaTraders) So if you already own a footprint indicator you can just use it. However not every 3rd party footprint indicator might be able to show all the signals. We do recommend to use it with our own footprint indicator
- This is an automated strategy. You will find it under strategies (NOT under indicators)
- You need to enable an automated strategy first for it to work
Key Features
Our orderflow foorprint indicator allows you to auto-trade the best footprint signals available

Auto trade 15 orderflow strategies
Stacked imbalance, Delta flip, Delta divergence, Delta Surge/Drop, Delta Tail, Delta trap, continuous POC and custom
Advanced order panel
Allows you to pause / run the strategy, quickly turn strategies on/off , disable longs/shorts and many more
Volume and delta filters
Stacked imbalance, Delta flip, Delta divergence, Delta Surge/Drop, Delta Tail, Delta trap, continuous POC and custom
Auto position sizing
Fixed % of contracts, fixed amount / trade or risk certain % of your account
Advanced stop placement, trailing stops and breakeven
Stacked imbalance, Delta flip, Delta divergence, Delta Surge/Drop, Delta Tail, Delta trap, continuous POC and custom
Day & Time filters
Only allow the strategy to trade at specific date & times
Daily loss & profit & drawdown filters
Stacked imbalance, Delta flip, Delta divergence, Delta Surge/Drop, Delta Tail, Delta trap, continuous POC and custom
Define your own custom signals
Define your own custom entries using c# scripting

Videos
Auto trade 15 different orderflow strategies
below you will find the stratgies which can be traded. Note your can turn any strategy on/off at any time you like without the need to stop the auto trader. You can combine multiple strategies, set volume and delta filters and even create your own custom strategy

Above / Below POC Strategy
The Above/below POC strategy will open a trade whenever a bar opens & closes above or below the POC. When both the open and the close are above the POC this is a clear indication that buyers and sellers stepped into the market and price will continue at least a little bit further. On the left you can see an example of a red bar opening and closing below the red value area. The indicator opens a trade the moment the bar closes and quickly reaches profit
Rules:
LONG:
-A green bar that opens & closes above the POC at a swing low
SHORT:
- a red bar that opens & closes below the POC at a swing hi
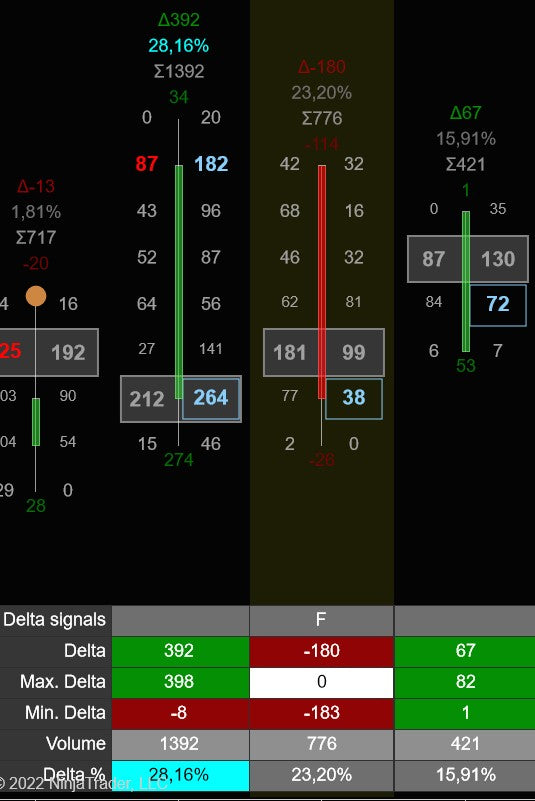
Delta Divergence Strategy
The delta divergence is a trend reversal signal.
RULES:
LONG:
- Price makes a new low with a green candle and positive delta
SHORT:
- Price makes a new high with a red candle and negative delta
EXAMPLE
On the right we can see a red bar making a new high, but with -160 delta being formed. When the red bar closes the auto trader will immediately open a short trade which hits its target a few seconds later


Delta Tail Strategy
A delta tail signal occurs when a bar has a negative delta at all price levels except the bottom of the bar and vice versa.
RULES
LONG
- green bar with postive delta at all prices except the bottom
SJORT:
- Red bar with negative delta at all price levels except the top
EXAMPLE
On the left you see a bar that has a negative delta at all price levels except at the top.
Delta Reversal Strategy
The Delta Reversal strategy opens a trade when a bar has an above-average max and min delta.
RULES
LONG:
- green with above-average max and min delta
SHORT:
- red bar with above average max and min delta
EXAMPLE
On the right we see that the second bar has a high max and high min delta, and prices reverse.


Delta Surge/Drop Strategy
The delta drop strategy uses a a 4-bar signal The signal happens when there is a sudden decrease in the delta and when the delta is getting weaker and weaker . or when there is an increase in delta and delta is getting stronger and stronger
RULES:
LONG
- 4 consecutive bars with increasing delta
SHORT:
-4 consecutive bars with decreasing delta
EXAMPLE:
On the left you can see that price made a new low which got quickly rejected. The first green bar gave a delta surge signal because the last 4 bars each had increasing delta and the strategy went long exactly a the bar close resulting in a winner
Delta Flip Strategy
The Delta flip signal is a 2-bar signal. It triggers when there is a sudden shift in Delta from positive <-> negative and indicates a potential reversal.
RULES
LONG:
-The first bar closes on its min-delta and has a max-delta around 0.
-The next bar closes on its max-delta and has a min-delta around 0
SHORT:
- the first bar closes on its max-delta and has a min-delta around 0.
-The next bar closes on its min-delta and has a max-delta around 0

Up to 5 User defined custom strategies
The custom strategy is a strategy you can define yourself. You can use C# to code your own strategy and take longs/shorts on the rules you decide. Scroll down to the customs signals section for more information
You can define a total of 5 different custom strategies and you can assign a button label to each one of them
Stacked imbalances Strategy
Stacked imbalances occur when we have 3 (or more), imbalances stacked on top of each other.
When a stacked imbalance is detected the strategy will take a long/short
Rules
LONG
- 3 or more imbalances on the Ask
SHORT:
- 3 or more imbalances on the Bids
You can change the number for the stacked imbalances. Default is 3
In the example on the right we see a sell imbalance being formed and as soon as the candle closes the autotrader opens a trade


Continuous POC strategy
When 2 or more bars have their POC at the same price level we call this a continuous POC. Its a indication of a strong level and thats what forms the base of this strategy
RULES:
LONG:
- a continuous POC (2 bars with same POC)
- followed by a bar with a high positive delta and/or a value area gap up
SHORT:
- a continuous POC (2 bars with the same POC)
- followed by a bar with a high negative delta and/or a value area gap down
Delta trap strategy
The delta trap strategy is a 3-bar strategy which looks a delta reversing and followed with stremgth
RULES:
LONG:
- bar 1 : big negative delta
- bar 2: big positive delta
- bar 3: ema 5 is up
- bar 3: big positive delta and/ and/or a value area gap up
SHORT:
- bar 1 : big positive delta
- bar 2: big negativedelta
-
- bar 3: ema 5 is down
- bar 3: big negative delta and/ and/or a value area gap down
On the right we can see an example. First bar had -813 delta, next bar had +1536 delta and 3rd bar had a value area gap up AND high positive delta.. The auto trader would go long after the 3rd bar


Exhaustion prints
Exhaustion prints indicate weakness. In an up trend we would like to see a good amount of contracts traded at the high, while in a downtrend we would like to see a good amount of contracts traded at the low. If this is not the case and we see only a small amount of volume at the high in an uptrend, or at the low in a downtrend then this indicates weakness or exhaustion. The trend might come to an end or go into a consilidation area
RULES:
Short:
- red candle with (almost) no volume at the ask at the high of the bar
Long:
- green candle with (almost) no volume at the bid at the low of the bar
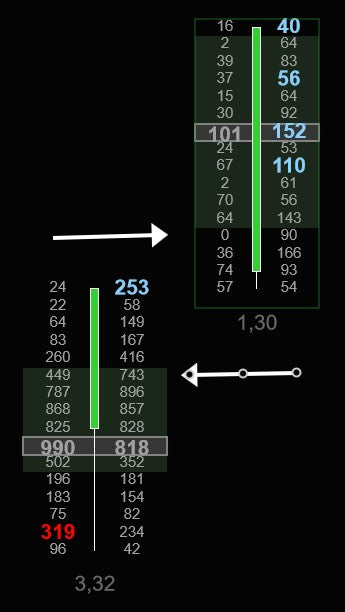
Volume Sequencing
Volume sequencing occurs when we have multiple price levels with increasing volume. when we see this we know the big guys are buying this market up (or selling it down) with force
Bullish volume sequencing is colored On the right we see a footprint chart in which 3 bars contain volume sequencing.
A clear indication the trend is up
If we take at the first bar then we can see buyers pushed the market up from the low and bought it up with increasing volume (0, 17, 165, 181 ,573).
Each price level has an increasing volume
volume sequencing can also be extended tot the right for a fixed number or bars, until broken , or until tested
RULES:
Short:
- bearish volume sequencing
Long:
- bullish volum sequencing


Bullish/Bearish POC
Each bar has a POC (Point of control) which is the price level where most volume in that bar was traded.
When markets are in a normal state we expect the POC to be in the middle of the bar. In up trending markets we expect them to be in the upper 3rd of the bar and in a bearish trend we want to see them in the bottom 3rd of the bar
An extreme POC is an POC which happens at the extreme top or bottom of the bar. Its a good reversal signal which indicate that aggresive buyers/sellers stepped in and prevented the price from going lower ( or higher)
RULES:
- LONG
Green bar with POC in the lowest 3 price levels of the bar
- SHORT
Red bar with POC in the upper 3 price levels of the bar
Value Area Gap
A value area gap occurs when there is a gap between the value area's of 2 consective bars.
On the right you see 2 green bars. The gap between the two value areas is market by the arrows
RULES:
- LONG
Green bar with value area gap up
- SHORT
Red bar with value area gap down

Delta sweep signal
A delta sweep signal occurs when a aggresive buyer (or seller) steps in and starts buying all the asks (or selling the bids) , sweeping multiple price levels without any counter trading. When this happens in conjunction with strong delta we have a delta sweep. This is a trend continuation signal
RULES:
- LONG
Green bar with strong positive delta and a market sweep , sweeping multiple price levels to the up side
- SHORT
Red bar with strong negative delta and a market sweep , sweeping multiple levels to the downside
Trapped Traders
The concept of "trapped traders" refers to those market participants who find themselves in unfavorable positions due to incorrect predictions about market movements. For instance, consider the situation on the right where a significant amount of selling activity occurs at the lowest point of a price bar, but subsequently, the bar closes green. In this case, the traders who sold at the lowest point are considered "trapped" in a short position, as the market is moving against their expectations.
To mitigate their losses, these trapped traders will need to close their short positions by placing buy orders.
This influx of buy orders can contribute to the existing upward momentum in the market, further intensifying the price increase. In summary, trapped traders are market participants who, due to their incorrect predictions, inadvertently contribute to the continuation of a price trend in the opposite direction of their initial positions.
RULES:
- LONG
Green bar with most volume traded in the bottom of the bar
- SHORT
Red bar with most volume traded in the top of the bar


Delta slingshot
Indicates a possible trend reversal when selling volume gets overrun by buying volume and market closing higher
RULES:
For shorts
- a red bar with extreme negative delta
- followed by a green bar which closes above the red bar with positive extreme delta
For longs:
- a green bar with extreme positive delta
- followed by a red bar which closes below the green bar with negative extreme delta
EXAMPLE:
In the example we see a red bar with -1321 delta
Then after a consilidation bar the next bar closes above the red bar with with +1669 delt
Order Panel
When the strategy is running it will place an order panel on the chart trader window. You can control everything the strategy does with this panel without needing to stop and restart the strategy

Arming and pausing the auto trader
The first button in the auto trader is used to arm or pause the auto trader. When armed the strategy will take a trade when all requirements are met. When paused it will not open any new trades
Paused
The auto trader will not open any new trades but it will still manage any open trades
Armed: One-Shot
The autotrader is ready to trade and will open a new trade when all requirements are met. However it will automatically go back to paused mode after that 1 trade. So in this mode the auto trader will only take 1 trade and then switch back to paused mode
Armed: Continuous
The autotrader is ready to trade and will open a new trade when all requirements are met. The auto trader will continue trading after a trade has been closed. It will not automatically go back to paused mode
Switch between Trending & Ranging markets
You can use this button to toggle between a trending market and a ranging market. Normally you would leave this set to trending
However if you see that the market is in a range then most of the time its better to sell the tops and buy the bottom of the range. In that case you can turn ranging by clicking the button
In ranging mode the strategy will do the opposite. So long signals will create a short trade and short signals will create a long trade


Move to break even & Closing Trades
If your trade is in profit then you can move your stoploss by breakeven with the break even button
If you would like to close your trade, you can do so by pressing the Close button
Disable/Enable short or longs
You can enable / disable shorts and/or longs at any time. For example if the market is an uptrend you might want to disable shorts. That way the strategy will not takes shorts and will only take longs
In a downtrend you might want to disable the longs. In that case the strategy will only take shorts


Combine multiple strategies together
This button determines when a trade should be opened. You can set it to the following options
1 or more signals
The auto trader will open a new trade when any of the selected (green) strategies below fires a signal
At lease x signals
The auto trader will open a new trade when at least X of the selected (green strategies) below fires a signal. This allows you to (for example) select 6 signals and open a trade when at least 3 of those fire a signal
All signals
The auto trader will open a new trade when ALL seleced (green) strategies below fire a signal.
Occurs in at last # bars
In this text box you can specify how many bars the auto trader will look back to find a signal
Min # required signals
Specifies the minimum number of required signals needed when you select the 'At least x signals' opion
Select which strategies to trade
Select any combination of the strategies you want to use in your trading. All the different strategies are explained above.
Note that if you use the AND operator then all strategies should fire in the last x bars before a trade gets opened.
With the OR operator only 1 of the selected strategies will open a new trade

Order management
The footprint auto trader is an automated strategy which allows you to auto-trade up to 8 different footprint signals.

Trade scalps + runners
The auto trader can trade a scalp and optionally a runner as well. You can define your target, trailing stop, stoploss for both of them.
The scalp can quickly reduces your risk to 0 while the runner tries to get you the most out of these big moves we all love
Advanced position sizing
Under position sizing, you define how much you want to risk per trade for both your scalp and your runner. If you don't want to use a runner then you can just change its setting to trade 0 fixed contracts.
There are a couple of options:
Fixed contracts / trade
With fixed contracts/trade the indicator will always open a trade using a fixed number of contracts. For example, if you set this value to 3 then every trade will be opened with 3 contracts. And if you set it to 1, every trade will be opened with 1 contract.
Fixed Amount/trade
If you want to risk a certain amount of dollars/trade then you can select this option. For example, let's say you want to risk a maximum of $150 / trade. In that case, you select Fixed amount/trade and enter 150 here. The indicator will then calculate the number of contracts it can trade for each trade based on the size of the stop loss. This means that for every trade your maximum risk will always be $150 and the number of contracts will depend on the size of the stop-loss.
If the stop loss is too big to trade even 1 contract then the trade will be skipped since the indicator cannot open a trade with the maximum risk you defined here

Percentage % trade
If you want to risk a certain percentage of your trading capital/trade then you can select this option. For example, let's say you want to risk a maximum of 2% / trade. In that case, you select Percentage/trade and enter 2 here. The indicator will then calculate maximum risk in $ for each trade based on the size of the stop loss, the percentage, and the account size. When it has calculated the max. amount of $ to risk on the trade it calculates how many contracts it can use for this trade.
This means that for every trade your maximum risk will always be 2% of your account and the number of contracts will depend on the size of the stop-loss.
If the stop loss is too big to trade even 1 contract then the trade will be skipped since the indicator cannot open a trade with the maximum risk you defined here
Max contracts
You might want to limit the max. of contracts the indicator can trade. Especially when you have selected a Fixed amount/trade of percentage/trade. In those cases, the indicator will calculate the number of contracts it can trade for each trade. Now if the stop loss is very small it could end up with too many contracts
With this setting, you can set the max. the number of contracts/trade the indicator should use.

Stop loss options
The indicator allows you to define your own stop loss.
You can define your stop loss in
-Ticks
-Points
-Amount ($)
-ATR
When selecting ATR you can also specify the ATR period and ATR multiplier to use.
- Previous Bar high/low
When selected your stoploss will be placed below the previous bar low for a long, or above the previous bar high for a short
- Swing High/low
When selected your stoploss will be places below the previous swing low for a long or above the previous swing high for a short
Break even options
You can specify your break-even point for both scalp + runner separately. For each you can choose to base your break even on
- Ticks
- Points
- Amount ($)
ATR
- Risk / Reward
When selecting ATR you can also specify the ATR period and ATR multiplier to use.
You can also specify an offset (in ticks) for the break-even.
For example, let's say you set your break-even to the settings above. In that case, the stop-loss will be moved to break even when your trade is in 1.5 ATR profit
Now if you set the Offset(ticks) to 1, then the stop-loss will be moved to breakeven + 1 tick when your trade is in 1.5 ATR profit


Take profit options
Here you can specify when to take profit for both the scalp & runner
You can specify your take profit in
- Ticks
- Points
- Amount ($)
- ATR
- Risk / Reward
When selecting ATR you can also specify the ATR period and ATR multiplier to use.
Note that if you don't want a fixed target, for example, because you are using a trailing stop and want your trades to be closed only when the trailing stop is hit, then you can just set your take profit to None. In that case, your trade will be closed when it hits the trailing stop ( or stop loss)
Trailing stop options
You can enable a trailing stop for both your scalp and/or your runner
To do so you first define which trailing stop you want to use.
You can choose between
- None
- Parabolic SAR
- ATR
Chandelier Stop
- previous bar hi / low
Which is often used when trading Renko bars
Next, you define WHEN your trailing stop should be triggered/started. Here you have 2 options:
- ATR
- When trade is at breakeven (+ some offset)
With the first (ATR) option, you can tell the indicator that the stop loss should get trailed by the trailing stop when the trade is in profit by a specific ATR period & multiplier you specify. For example. This allows you to start trailing your stop when your trade is in 1.5 ATR profit
The other option is to start trailing your stop when your trade is at breakeven + some ticks. This allows you to start trailing your stops when your trade is 16 ticks in profit.
Trade filters
You can setup the following filters to filter out bad signals
Daily loss/profit filter
The daily profit/loss filter will enable you to stop trading for the day when your daily profit target and/or your daily loss limit has been reached. Use this if you want to set limits on how much you can lose or win per day


Daily max drawdown filter
The daily max drawdown filter will enable you to stop trading for the day when your daily drawdown limit has been reached. Use this if you want to set limits on how much you profit you allow to give back during the day
Day of week filter
The weekday filter allows you to restrict trading to particular days of the week. When abled the indicator will only trade the days you have selected checked and won't take any trades on the other days.


Session filter
With the session filter you can limit the times when the footprint trader is allowed to take any trades
Volume, Delta and Delta % filter
This filter will filter out any trades when the volume, Delta and or Delta % is below the minimum level

Create your own custom entry signals
One of the unique features of this strategy is that you can use C# script to create your own custom entry signals.
With these c# scripts you can create advanced signals based on any of the bars and all their metrics.
NOTE THAT YOU CANNOT USE OTHER INDICATORS, STRATEGIES AND/OR ACCESS NINJATRADER API'S INSIDE YOUR CUSTOM SIGNALS
Volume - the total bar volume value
Delta - the bar delta value
MinDelta - the bar min delta value
MaxDelta - the bar max delta value
DeltaRate - the delta rate
DeltaChange - the change in delta between this bar and the previous bar
VolumePerSecond - The volume traded / second
Duration - The bar duration(as a c# timespan)
DeltaVolume - the delta in volume between this bar and the previous bar
DeltaVolumePercentage- the delta volume % between this bar and the previous bar
MinDeltaVolume- the max delta volume between this bar and the previous bar
MaxDeltaVolume- the min delta volume between this bar and the previous bar
DeltaPercentage - the bar delta / volume% value
COTHigh - the bar COT High value
COTLow - the bar COT Low value
Open - the bar's open price
Close - the bar's close price
High - the bar high price
Low - the bar low price
CumulativeDelta - the cumulative delta value for the bar
CumulativeVolume - the cumulative volume for the bar
POC - the bar POC price
ValueAreaHigh - the bar Value Area High price
ValueAreaLow - the bar Value Area Low price
TotalAsks - the bar total ask volume
TotalBids - the bar total bid volume
Trades - the number of trades executed in the bar
IsGreenBar - true if the bar is a green candle, false otherwise
IsRedBar - true if the bar is a red candle, false otherwise
Ratio - bar ratio
OpenAndCloseAbovePOC - (bool) bar opens and closes above its POC
OpenAndCloseBelowPOC - (bool) bar opens and closes below its POC
DeltaRise - (bool) Bar has a delta rise signal
DeltaFlip - (bool) Bar has a delta flip signal
DeltaTail - (bool) Bar has a delta tail signal
DeltaReversal - (bool) Bar has a delta reversal signal
DeltaDrop - (bool) Bar has a delta drop signal
DeltaSweep - (bool) Bar has a delta sweep signal
CloseAtMinMaxDelta - (bool) Bar closes around its min/max delta
BuyImbalances - List<double> - List of all prices (inside the bar) which have buy imbalances
SellImbalances - List<double> - List of all prices (inside the bar) which have sell imbalances
StackedBuyImbalances - List<double> - List of all prices (inside the bar) which have stacked buy imbalances
StackedSellImbalances- List<double> - List of all prices (inside the bar) which have stacked sell imbalances
OverSizedBuyImbalances- List<double> - List of all prices (inside the bar) which have oversized buy imbalances
OverSizedSellImbalances- List<double> - List of all prices (inside the bar) which have oversized sell imbalances
BigBuyImbalances- List<double> - List of all prices (inside the bar) which have bigbuy imbalances
BigSellImbalances- List<double> - List of all prices (inside the bar) which have big sell imbalances
Below is an sample strategy which shows how to go long / short depending on the previous bar volume, delta and candle color

Change log
5 nov 2024 2.0.0.11
- fixed exception messages
9 sep 2024 2.0.0.107
- synced to match Footprint indicator 2.0.0.10
14 may 2024 2.0.0.7
- added option to filter market sweeps at candle high/low
7 may 2024 2.0.0.6
- added signal designer
- fixed inverse imbalances
- changed tick aggregation to group price levels based on candle low
12-oct-2023 v1.0.0.16
- fixed: added thin prints
26-may-2023 v1.0.0.13
- fixed: delta and delta % filtering not working
- fixed: autotrader sometimes taking a long instead of a short and vice versa
20-may-2023 v1.0.0.11
- new: option to use limit orders instead or market orders (experimental)
- new: delta slingshot strategy
- new: trapped traders strategy
- new: added option to specify an offset (in ticks) for stoploss type Previous Bar high/low
- new: the auto trader now shows which signals it used to open a trade on the chart with bar markers
- new: New option in indicator settings to set trending/ranging market
- fixed: invalid order when using Previous Bar High/Low for stoploss
10-april-2023 v1.0.0.9
- fixed: added missing button for value area gap strategy
5-april-2023 v1.0.0.8
- New: delta divergence / candle type
- fixed: sometimes a trade got opened directly when enabling the strategy
14-jan-2023 v1.0.0.6
- New: delta market sweep signal
- added delta rate, volume / sec and other properties for use in custom signals
8-jan-2023 v1.0.0.5
- New: max daily drawdown filter
- Fixed: max daily loss filter
- improved COT High/Low calculations
29-dec-2022 v1.0.0.4
- improved delta trap strategy
- improved continous poc strategy
- improved volume sequencing
- fixed error when closing a trade manually
19-dec-2022 v1.0.0.3
- new feature: combine strategies using use any,some or all strategies
- new feature: You can now define upto 5 custom strategies and assign a button label to them
- new feature: Value Area Gap strategy
- new feature: You can now arm the auto trader to take 1 trade only and then go back to pause mode
17-dec-2022 v1.0.0.2
- new feature: use and/or to combine strategies together
- new feature: Min. bars lookback filter
- new feature: Extreme POC
- new feature: Exhaustion prints
- new feature: Volume sequencing
- added new settings to enable short/long/trading
9-dec-2022 v1.0.0.1
- first release
Customers also look at
The following products are often combined with the orderflow auto trader
Join us on discord
Want to chat with us and other traders? Got questions on our indicators ? Or want to know more about our products?
