


Key Features
Support & resistance or supply & demand play a vital role in the financial markets. Time after time we see the market respecting previous levels of support & resistance. This makes these levels excellent areas to look for a trade.

Plot S&R lines or supply and demand zones or both
Plot the support/resistance (or supply/demand) levels in real-time on your chart
Show overbought/sold based on a dynamic RSI
xxxxxxxxxxxxxxxxxxxx
Support & Resistance trading
Plots support / Resistance levels
Shows previous levels of support and resistance. Important levels that are often respected.
Retest of pervious S&R levels
When price returns to an important previous support level, changes are high we will get at least a reaction and maybe a bigger trend reversal. A scalper could scalp this retest.
S&R levels play a vital role in the financial markets
Time after time we see markets respecting previous levels of support & resistance
Bloodhound & Strategy support
Plots for all the delta signals and important metrics
support/resistance indicator
Support & resistance or supply & demand play a vital role in the financial markets. Time after time we see the market respecting previous levels of support & resistance. This makes these levels excellent areas to look for a trade.
Our indicator will plot the support/resistance (or supply/demand) levels in real-time on your chart. Both active and broken levels can be shown. Besides this, it can also show all the previous touches for all the active support & resistance levels. This gives you a clear indication of how strong a level is.

Trading Strategies using support / resistance
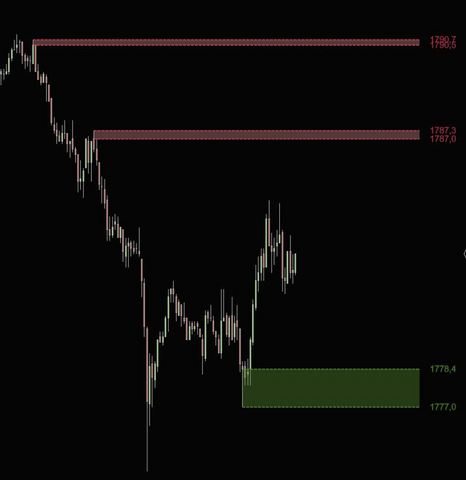
Retest of previous support/resistance
Another high probability setup is to trade the retest of previous support/resistance levels. When price returns to an important previous support level changes are high we will get at least a reaction and maybe a bigger trend reversal. As a scalper, you could scalp the retest of a previous support/ resistance level with a tight stop just above/below the S&R level. If you are looking for bigger swings you could go for a bigger target and anticipate a trend reversal when price retests a maybe S&R level
The example on the right shows how this looks like. Here we see a re-test of a previous support level. Our stop could go a few ticks under the support line, and we open a trade when the price either hits the support line or breaks back above it.


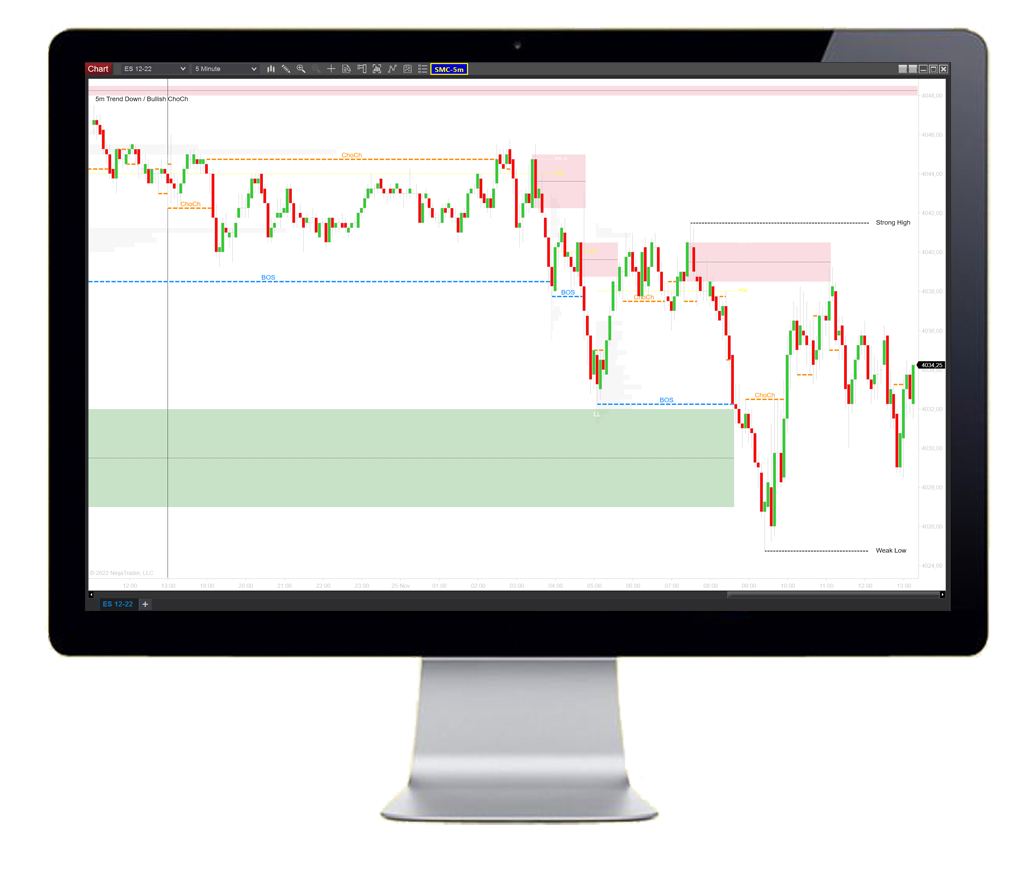
Breakout strategy using support / resistance
You probably heard it before. Previous resistance often becomes support.
What this means is that when price breaks through a resistance level it will often come back to that level to retest it and see if the previous resistance is now accepted as support. These retests are prime candidates for breakout traders.
The previous resistance (and now possible support) level gives us a clear location where to place our stop and when the price starts rejecting the level and moves higher we can open a breakout trade long.
On the left we see a clear example of price breaking through the resistance level and coming back later to restest the (now) support level. When the price breaks above the support after the retest we can open a long trade
For shorts, just follow the opposite where support gets broken and the price comes back to test it as resistance
Zone types

In the indicator settings, you can specify which zone type you would like to use. You can choose between
Line
The indicator will draw S&R levels using the high or low of the candle

Close
The indicator will draw S&R levels using the close of the candle
Wick
The indicator will draw S&R zones using the wicks of the
candle

Average
The indicator will draw S&R levels using the average price of the candle
Settings
Number of zones to show
You can choose to hide or show supply/demand zones (or S&R levels) that are broken and set up different colors for both the active and broken zones


Hide / Show broken lines
You can choose to hide or show supply/demand zones (or S&R levels) that are broken and set up different colors for both the active and broken zones
Broken zone algorithm
You can specify if a zone gets broken when prices only pierce through a support/resistance zone without closing outside the zone. Or that a zone is broken when prices closes outside the zone
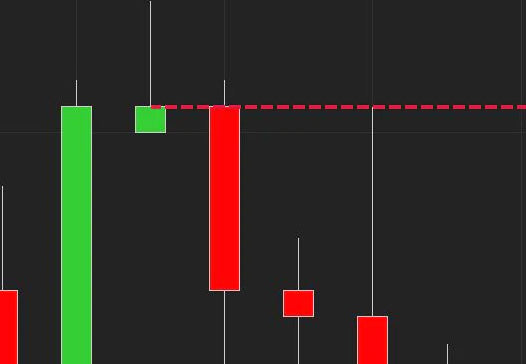
Strenght left / right
The strength left and right are used to detect the S&R or supply /demand levels. For a resistance level (top), these specify the number of bars to the left and right which need to be below the current candle high to make a top. See the example below. We see that a new top is found since the 5 bars to the left and right are all below the top

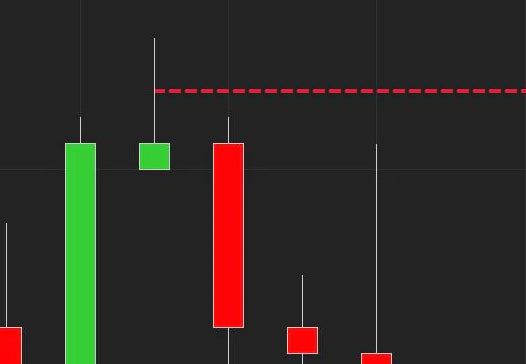
Show previous touches of support / resistance
The indicator can show the previous touches for the active support & resistance lines. This gives a good indication of how strong a support/resistance level is. The more times a level was touched in the past, the more likely we will see a reaction when prices retest that level in the future. Previous touches are marked with a yellow dot as shown below.

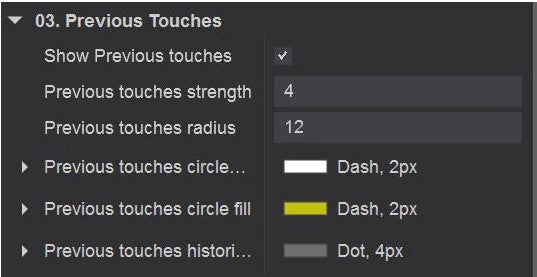
Settings for the previous touches
You can specify a separate strength for detecting the previous touches. Just like the StrengthLeft and StrengthRight explained above this value indicates the number of bars to the left & right to make a new swing lo/hi. The previous touches have their own strength setting. This allows you to pick up the minor swing los/hi's for the touches and the major swing los/his for the S&R levels. Next, you can choose the radius for the yellow dots and whether you want to show the previous touches or not. You can customize the color and styles of the lines and dots in the color section of the indicator settings.
Higher timeframe Support/Resistance
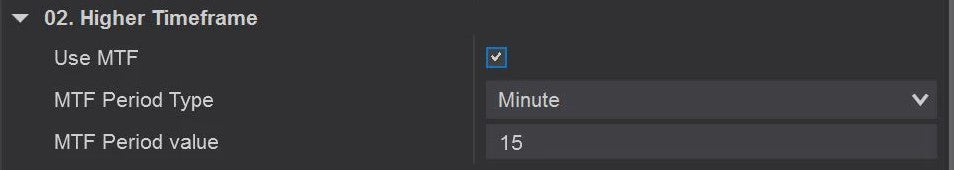
The indicator allows you to plot support & resistance levels or supply & demand zones from a higher timeframe on the current chart.
For example, you could plot support & resistance levels from a 15min timeframe onto a 1min chart. Simply enable the Use MTF checkbox in the settings and select the timeframe you would like to use.

Alerts
The indicator supports 2 kinds of alerts which can be enabled/disabled separately The first alert is generated when a new zone is created. The second alert is for when an existing zone gets broken. Each alert can have its own sound file and can be enabled separately
Change log
11-nov-2023 v1.0.0.0
- first release
Customers also look at
The following products are often combined with the orderflow footprint indicator
Join us on discord
https://launchpass.com/tradedevils-indicators1/member
Want to chat with us and other traders? Got questions on our indicators ? Or want to know more about our products? Then join us on discord for just $1 a year
