

Overview
Most Fibonacci traders are aware of the important 50%, 61.8%, 65%, and -23.6% are very important Fibonacci levels. Traders like Sam from TradeDevils, Tim from eminimind and David Halsey from eminiaddict based their entire trading strategies on those Fibonacci levels. These levels often act as key support/resistance levels used to anticipate potential price movements, market turning points, and points of profit-taking.
Installation / Free Trial
Please:
1) Send us your Sierra Chart Account name so we can give you access
2) Make sure you are running SierraChart version 2555 or higher
3) when you got access, goto Studies->Click on Add Custom Study and then add the TDU AutoFibs to your chart

As traders who use retracements as part of their core strategy will acknowledge, manually drawing and redrawing these retracements all the time is a cumbersome and repetitive task. Not only that but it's easy to overlook or miss important levels particularly when you are searching for confluence across multiple timeframes.
The TDU Auto Fib indicator makes Fibonacci trading much simpler by automatically identifying and drawing all the relevant Fibonacci retracements for you. Not only that but tick by tick, the indicator will keep your fibs updated in real-time helping you focus only on the most important levels while you trade.
A problem many Fibonacci traders face is being able to keep their charts clean and readable. As you build up your retracements across different timeframes, your chart can quickly become cluttered making it difficult to understand. To attempt to solve this we have added the Fibonacci cluster setting allowing you to draw the most relevant Fibonacci levels on the right end of the chart allowing you to hide all those unnecessary 'on chart' retracement lines, making your chart clean again.
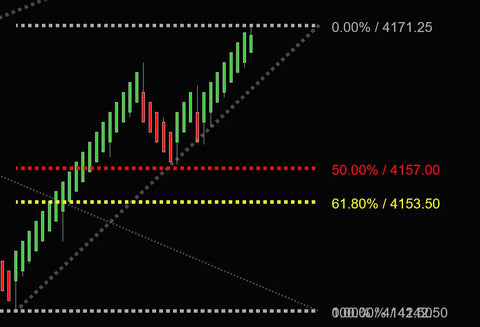
Shows all relevant Fibonacci retracements and extensions
The indicator examines all previous swing points and draws all the relevant Fibonacci retracements and extensions from those swing points. You can choose to only show the Fibonacci retracements/extensions which are close to the current price so you don't get overwhelmed by all those retracements. The Fibonacci retracements and extensions will then be shown/hidden automatically as the prices move.
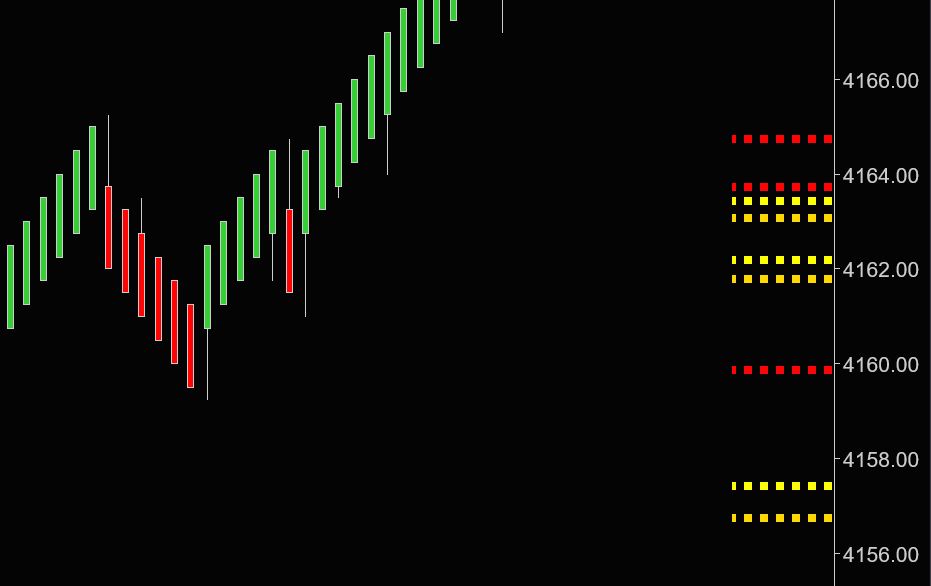
Fibonacci cluster
In case you don't like to see all the Fibonacci lines on your chart you can choose to hide them and just show the Fibonacci cluster. The Fibonacci cluster shows all relevant Fibonacci retracements and extensions on the right end of the chart. That way you never miss one but still, your chart looks clean.
The Fibonacci cluster also gives you a clue how big a level is. Bigger levels are drawn thicker while smaller Fibonacci levels are drawn thinner.
Key Features
- Automatically finds and draws all relevant Fibonacci retracements and extensions in real-time
- Automatically hides retracements that are 'broken' in real-time
- Can show Fibonacci retracements on the chart
- Can plot a Fibonacci cluster on the right end of the chart to avoid any line clutter
- Option to only show the Fibonacci retracements and extensions which are closest to the current price
- Works on any instrument
- Works on any timeframe
- Works with any bar type
Media
