
Trade With Institutional Precision Using Automated Structure For Total Market Clarity.
You Are The Liquidity. Let's Fix That.
Most retail traders don't fail because they lack discipline. They fail because their charts are entirely disconnected from how the market actually functions.
You spot a textbook breakout. You enter the trade. Then price immediately reverses, sweeps your stop loss, and rockets back in your original direction. This isn't bad luck—it's algorithmic liquidity hunting. While you are trading MACD crosses and lagging averages, institutional algorithms are targeting structural weakness.
The TDU Market Structure Indicator for Sierra Chart is built specifically to solve this visibility problem. It abandons lagging mathematics and instead plots the actual "Smart Money" footprints on your chart. When an institution steps in to break market structure, change the character of the trend, or leave a massive order block behind, you see it instantly.
Stop guessing where support and resistance are. Start trading alongside the large institutions instead of offering up your capital to them.
You're Trading Illusions.
We Map Institutional Footprints.
Retail traders rely on lagging oscillators. Institutional algorithms rely on liquidity sweeps and structural breaks. Stop trading against the bank.
Trading Against The Current
You take setups based on conventional wisdom, only to realize you are buying exactly where the "Smart Money" is aggressively selling. Your standard indicators cannot see this institutional volume.
The Brutal Liquidity Sweep
You place a logical stop loss. The market violently spikes down, stops you out to the tick, and immediately runs to your profit target. You weren't wrong; you were just used as liquidity.
Objective Market Structure
The TDU Market Structure Indicator algorithmically maps major price turning points, order blocks, and fair value gaps, allowing you to ride the coattails of institutional algorithms instead of fighting them.
Expose The Hidden Geometry Of The Market.

Raw Output: Objective Institutional Market Structure Identified Live.
The Architecture Of The Edge
A complete suite of Smart Money Concepts, natively engineered into one C++ tool for Sierra Chart.
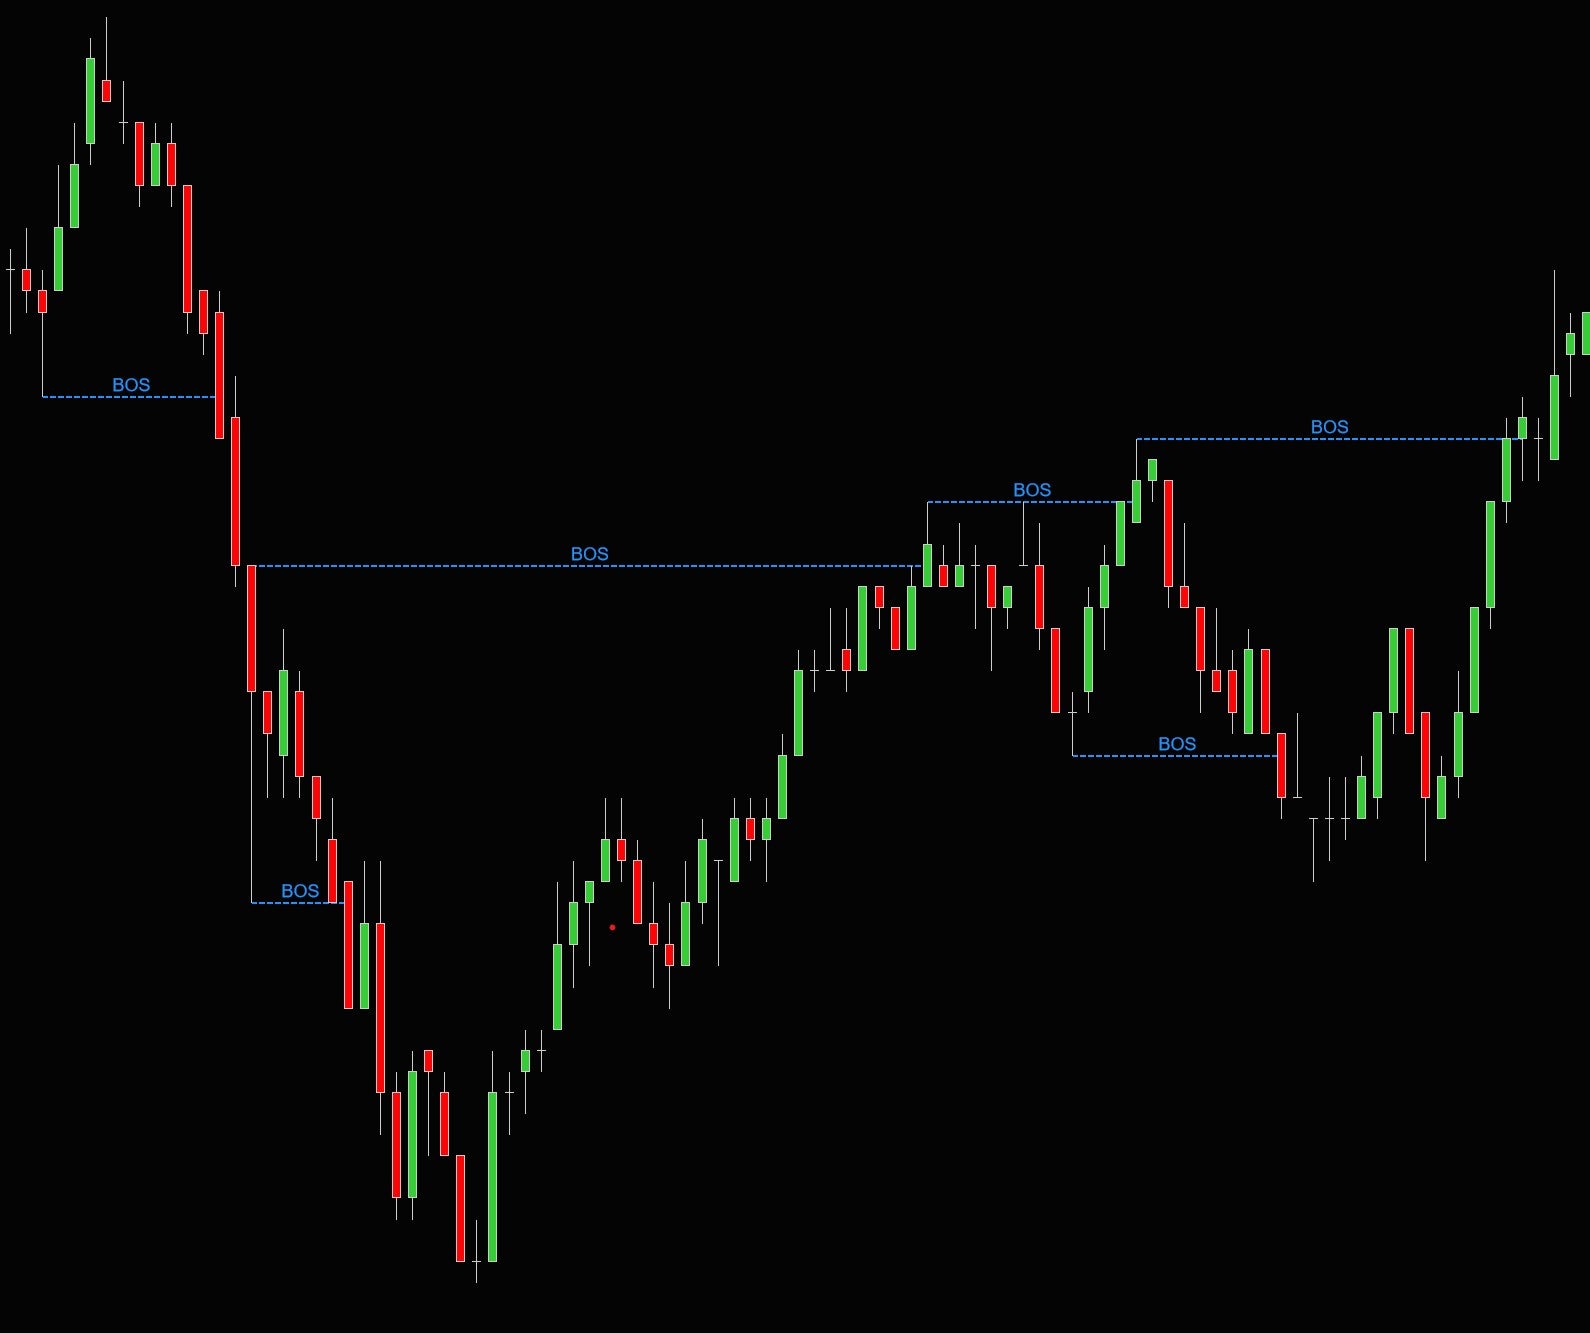
Identify True Trend Changes
The algorithm instantly isolates major turning points via Break of Structure (BOS) and Change of Character (ChoCh) markers, so you can enter macro shifts early and stop buying into dead trends.
Target Institutional Footprints
Automatically map active Order Blocks and Supply/Demand zones directly onto the chart, so you can place your limit orders exactly where banks are defending their massive positions.
Exploit Price Magnets
Visualize Fair Value Gaps (FVGs) where the market moved too quickly and left a void, ensuring you have high-probability, magnetic targets to exit your trades for maximum risk-to-reward ratios.
Filter Weak Targets
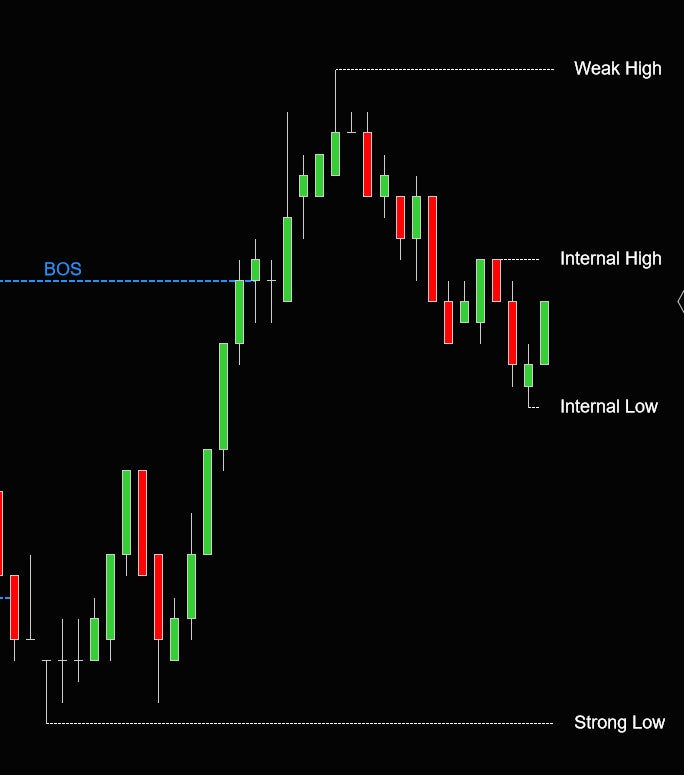
Continuously track Strong vs. Weak highs and lows based on their ability to break market structure, allowing you to identify vulnerable price levels to attack while protecting your stops behind structurally proven liquidity walls.
Catch Momentum Shifts Instantly.
Stop relying on lagging moving averages to tell you the trend has changed. The indicator uses a sophisticated algorithm to spot major price turning points instantly, labeling a Break of Structure (BOS) for trend continuation and a Change of Character (ChoCh) for early reversal warnings, so you can enter positions with sniper-like precision while retail is still waiting for confirmation.
- Instantly verify when a pullback becomes a reversal.
- Visualize integrated volume profiles strictly inside the BOS zone.
- Monitor micro-structure alongside macro market moves.
Trade The Bank's Hidden Levels.
Order blocks show you exactly where the big banks and institutions likely entered the market. These zones often act as powerful areas where price will bounce. The indicator automatically draws these forward until they are mitigated or broken, giving you a massive edge by allowing you to stack your bids and offers exactly where the market makers do.
- Automatically identify high-probability institutional entry zones.
- Detect "Breaker Blocks" when a support zone flips to resistance.
- Dramatically improve your Risk/Reward ratios.

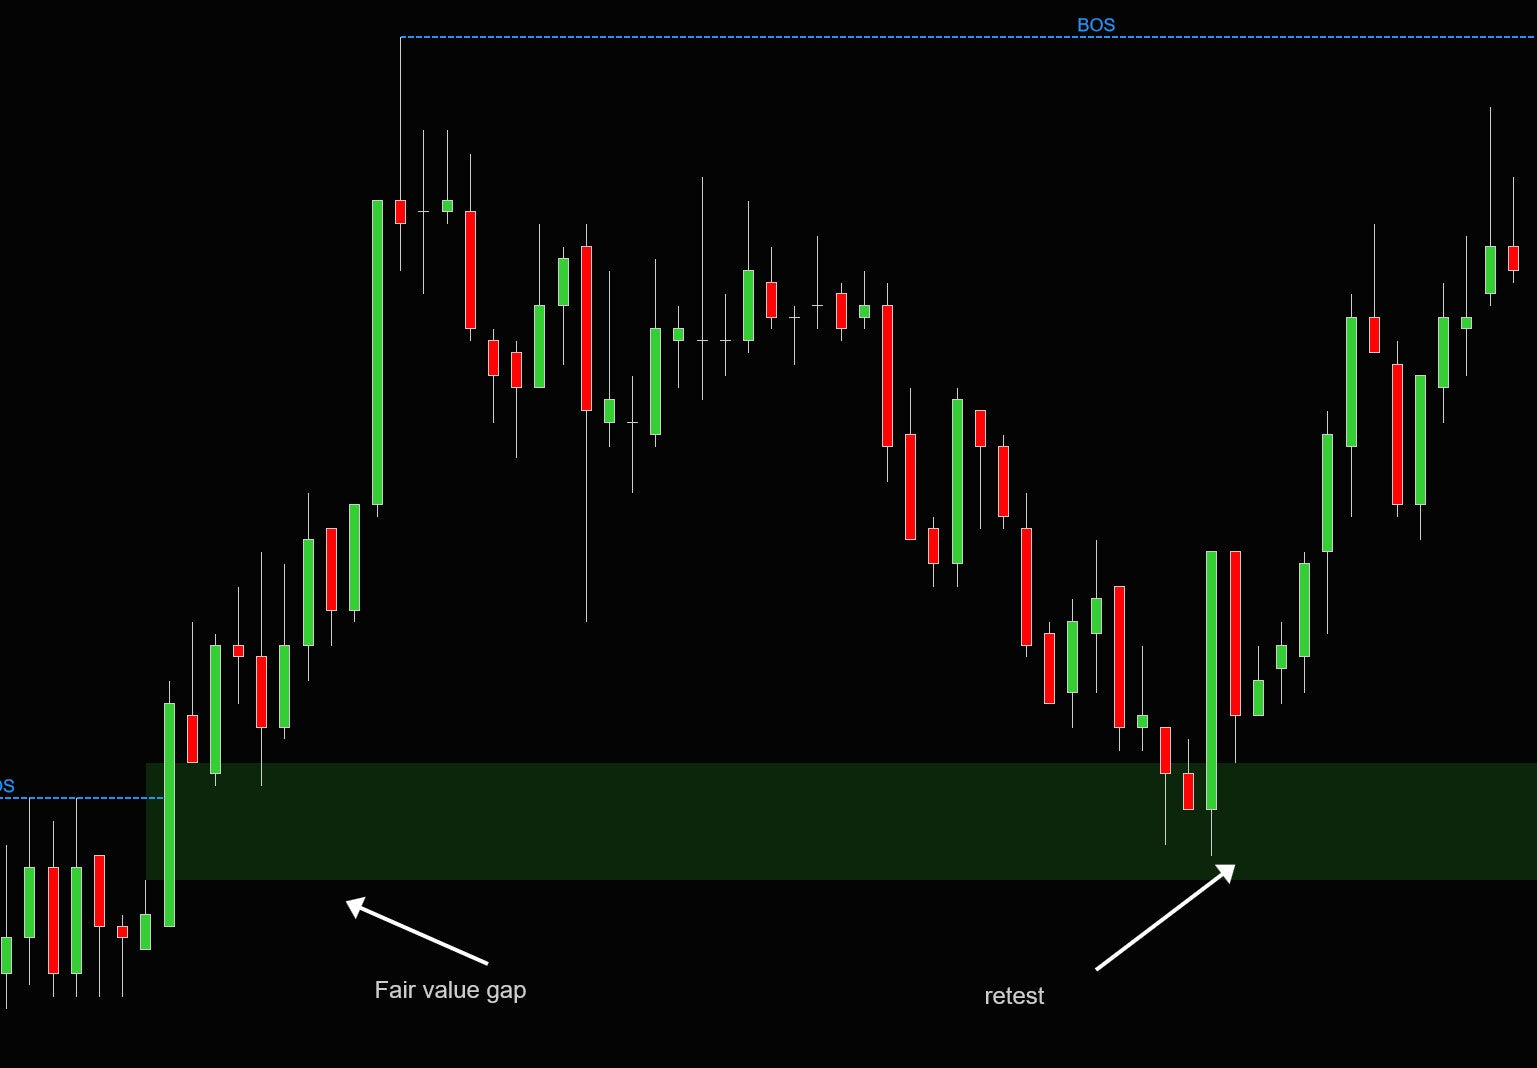
Exploit Fair Value Gaps.
A Fair Value Gap (FVG) is an algorithmic void left when the market moves with extreme, explosive velocity. Price acts as a magnet to these zones, returning to rebalance the inefficiency. By visualizing these gaps automatically, you can set pinpoint profit targets or identify high-probability bounce zones for trend continuation.
- Stop guessing where to take profit.
- Identify the exact ticks where the market is mathematically unbalanced.
- Combine FVGs with Order Blocks for ultimate confluence.
Target Weakness. Defend Strength.
Not every swing high or low is equal. A Strong High is one that successfully pushed price to a new algorithmic low. A Weak High is one that failed its objective. By automatically categorizing these pivots, you can systematically target the "weak" liquidity levels for breakouts, while resting your stops securely behind the "strong" levels institutions are defending.
- Stop getting swept out at random pivot points.
- Know exactly which levels the algorithms will hunt next.
- Define structure context mechanically, zero subjectivity.
The Nerd Vault
Automatically maps major trend continuations (BOS) and early warnings of structural failure (ChoCh) instantly as bars close.
Algorithmically differentiates pivots based on their ability to create new structural extremes.
Identifies and extends institutional entry zones forward until mitigated, highlighting flipped S/R zones (Breakers).
Calculates three-bar inefficiencies and draws structural magnets directly onto the price action.
Integrates granular volume profile math to identify the highest traded price levels inside a structural breakout.
Allows tracking of internal, secondary swings inside the larger macro market movements.
The TDU Market Structure Indicator is heavily engineered to act as the visual foundation for your systematic Smart Money Concept execution in Sierra Chart.
- Consistent Logic Rules: Remove human bias from determining what constitutes a valid order block or structural break.
- Zero-Lag Native Rendering: Because it is compiled specifically for Sierra Chart's OpenGL environment, it handles immense data processing without freezing your DOM.
- Clear Setup Definitions: Define your setups mathematically (e.g., "Only enter a long if price sweeps a Weak Low, taps a bullish Order Block, and prints a bullish ChoCh").
- 21-oct-2023 (v1.0.0.0) - Initial core release of the TDU Market Structure Indicator for Sierra Chart.
Frequently Asked Questions
Everything you need to know about licensing, platform architecture, and trials.
General Info & Trials
Licensing & Billing
Platforms & Technical
Hardware & Specs
Ready to Automate Your Edges?
Stop guessing. Start executing with algorithmic precision.