Market Structure Smart Money Concepts Indicators Full Documentation
TDU Market Structure — Smart Money Concepts for NinjaTrader 8
The most complete Smart Money Concepts (SMC) indicator for NinjaTrader 8. Break of Structure, Change of Character, Supply & Demand Zones, Order Blocks, Fair Value Gaps, Volume Profiles, Fibonacci, and more — all on one chart.
Follow the smart money. This indicator brings institutional-grade Smart Money Concepts to NinjaTrader 8 — detecting Break of Structure, Change of Character, supply/demand zones, order blocks, fair value gaps, volume profiles, Fibonacci retracements, equal highs/lows, and trendline liquidity. With full multi-timeframe support, a right-click easy access menu, and 16 exportable plots for strategies and AlgoStudio Pro.
Table of Contents
- Why Choose This Indicator
- Detection Methods
- Break of Structure (BOS)
- Change of Character (ChoCh)
- Swing Structure
- Internal Structure
- Supply & Demand Zones
- Order Blocks
- Fair Value Gaps
- Fibonacci Retracements
- Volume Profile
- Equal Highs & Lows
- Trendline Liquidity
- Trend Display & Paint Bars
- Multi-Timeframe Support
- Easy Access Toolbar Menu
- Alerts
- Strategy & AlgoStudio Pro Support
- Complete Settings Reference
- Video Training
- Version History
Why Choose This Indicator
All SMC Features In One Indicator
BOS, ChoCh, Supply/Demand, Order Blocks, FVG, Volume Profiles, Fibonacci, Equal Highs/Lows, Trendline Liquidity, Breaker Blocks — all in a single indicator. No need for multiple addons.
Follow The Big Money
Detects institutional moves by identifying Break of Structure and Change of Character patterns. Know the trend, find entries at supply/demand zones, order blocks, and fair value gaps.
Multi-Timeframe On One Chart
Display market structure from 4H, 1H, 15min, and 5min all on one 5-minute chart. See the big picture and fine-grain detail simultaneously. No competitor offers this.
Best Value + Free Trial
Full 7-day free trial with every feature unlocked. No credit card required. Lifetime license at a fraction of the cost of competing products.
Detection Methods
TDU Market Structure offers two detection algorithms for identifying swing highs and lows. The detection method you choose is fundamental — it determines how the indicator finds the structural pivots that drive every downstream feature: BOS, ChoCh, supply/demand zones, order blocks, Fibonacci levels, and more. Choosing the right method for your trading style and instrument is the first step to getting the most out of this indicator.
Why Detection Method Matters
Every SMC feature in this indicator depends on accurate swing detection. If swings are too sensitive, you get noise — too many false BOS signals, cluttered supply/demand zones, and unreliable order blocks. If swings are too insensitive, you miss important structural changes. The two detection methods let you find the right balance for your instrument, timeframe, and trading style.
PriceAction Mode
Uses pullback-based detection with configurable thresholds. The indicator identifies a new swing when price pulls back by a minimum amount from a recent high or low. You control the minimum pullback size using three measurement options:
-
ATR: Pullback must exceed
BOSATRMultiplier× ATR(BOSATRPeriod). This adapts automatically to volatility — larger pullbacks are required on volatile instruments. - Percentage: Pullback must exceed a fixed percentage of the previous swing range. Good for consistent relative measurements.
- Ticks: Pullback must exceed a fixed number of ticks. Best when you want absolute control over minimum swing size.
PriceAction mode gives you the most granular control. Use it when you want to fine-tune swing sensitivity for a specific instrument or when you need pullback-based detection that adapts to volatility via ATR.
Fractal Mode (Default)
Uses fractal-based swing detection. A fractal high is confirmed when there are N bars on each side with lower highs — the high stands out as a local peak. A fractal low is confirmed when there are N bars on each side with higher lows. The FractalSize parameter controls how many confirming bars are needed on each side (default: 4).
This method is simpler to configure and produces more consistent results across different instruments and timeframes. A higher FractalSize (e.g. 6–8) filters out minor swings and focuses on major structure. A lower value (e.g. 2–3) captures more swings for scalping or micro-structure analysis.
| Setting | Type | Default | Description |
|---|---|---|---|
SmcDetectionMethod |
TDUMarketStructureDetectionType | Fractal | Detection algorithm: PriceAction or Fractal |
FractalSize |
int | 4 | Number of bars on each side for fractal detection (Fractal mode only) |
BOSPullBackType |
TDUMarketStructurePullbackMode | ATR | Pullback measurement: ATR, Percentage, or Ticks (PriceAction mode only) |
BOSATRPeriod |
int | 14 | ATR period for pullback detection (PriceAction + ATR mode) |
BOSATRMultiplier |
double | 2.0 | ATR multiplier for minimum pullback (PriceAction + ATR mode) |
BOSPullbackPercentage |
double | 30 | Minimum pullback as percentage of swing range (PriceAction + Percentage mode) |
BOSPullbackTicks |
double | 80 | Minimum pullback in ticks (PriceAction + Ticks mode) |
Break of Structure (BOS)
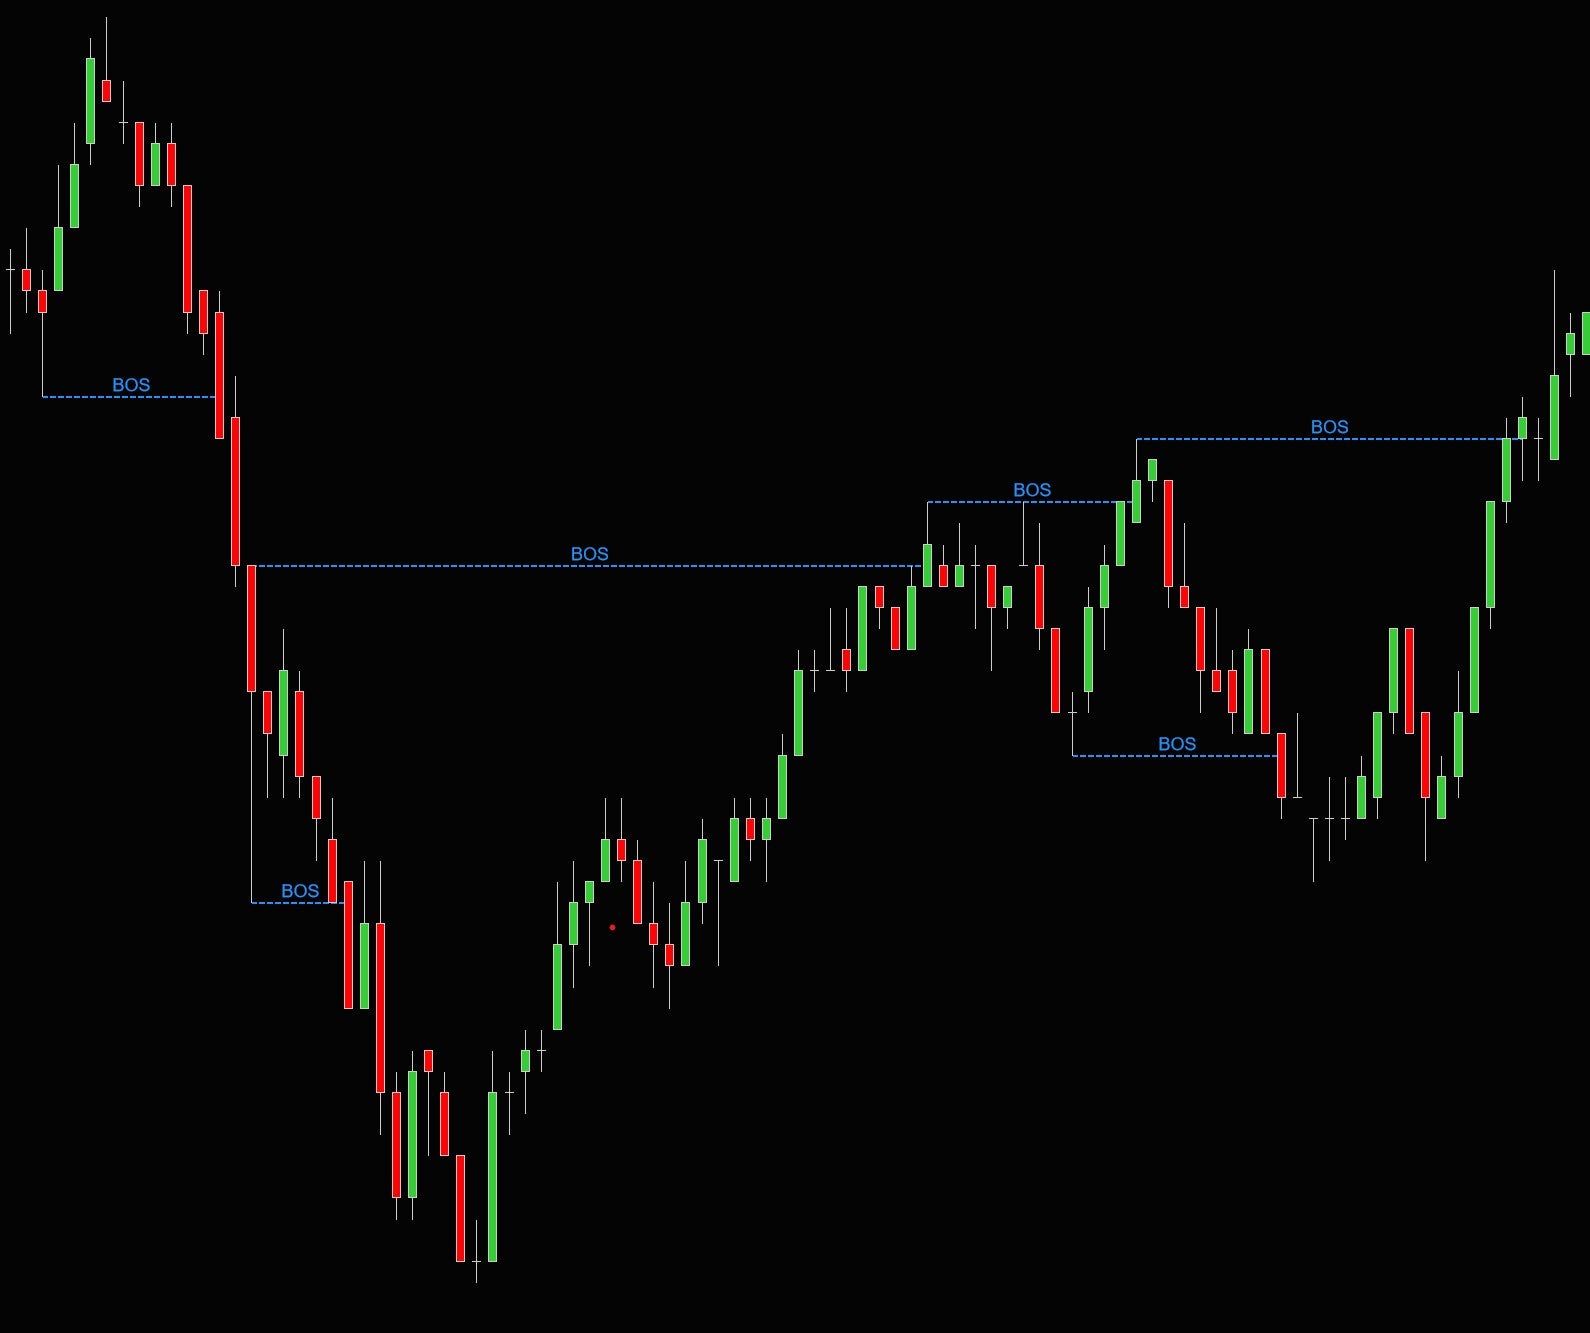
A Break of Structure (BOS) is the cornerstone of Smart Money Concepts trading. It occurs when price breaks through a significant swing high or swing low, confirming the prevailing trend direction. A BOS to the upside (price breaks above a prior swing high) confirms a bullish trend. A BOS to the downside (price breaks below a prior swing low) confirms a bearish trend.
In SMC theory, institutions move price in a structured way — creating a series of higher highs and higher lows (bullish) or lower highs and lower lows (bearish). Each time price breaks past a prior swing point, it signals that large capital is continuing to drive the trend. The BOS is your confirmation that the trend is intact.
Macro vs. Micro BOS
The indicator detects both macro BOS (main structure) and micro BOS (smaller moves within the main trend). Macro BOS uses the main swing detection algorithm and captures the dominant trend. Micro BOS detects smaller structural breaks between major swings — useful for fine-tuning entries or scalping within a larger move. On multi-timeframe setups, macro BOS on a higher timeframe gives you the direction while micro BOS on a lower timeframe helps you time entries.
Why BOS Matters for Your Trading
BOS is not a trade entry signal — it is a directional filter. It tells you which side of the market to be on. Once a bullish BOS occurs, you know the smart money is pushing price up, and you should be looking for long opportunities. Once a bearish BOS occurs, you should only look for shorts. This single filter eliminates the majority of losing trades by keeping you aligned with the dominant order flow.
- Wait for a BOS to confirm the trend direction (bullish or bearish)
- After BOS, wait for a pullback into a demand zone (bullish) or supply zone (bearish)
- Look for confluence: does the pullback also touch an order block, fair value gap, or Fibonacci level?
- Enter your trade at the confluence zone with a stop-loss behind the zone
- Target the weak swing high (bullish) or weak swing low (bearish)
Structure Mapping
Controls how BOS lines are drawn on the chart. Candle_Close maps the BOS line to the closing price of the breakout candle — this is the stricter setting and produces fewer false breaks. Candle_Wick maps the line to the wick (high/low) and detects breaks earlier, including intra-bar wicks that don't close beyond the level. Most traders prefer Candle_Close for a more reliable signal.
Display Types
Choose how BOS labels appear on the chart: None (hidden), LineOnly (horizontal line only), Text (line + BOS label), or TextAndTimeFrame (line + label + timeframe, ideal for multi-timeframe setups where you need to know which timeframe generated the BOS).
| Setting | Type | Default | Description |
|---|---|---|---|
BOSDisplayType |
TDUMarketStructureDisplayType | Text | How BOS lines are displayed |
BOSStructureMapping |
TDUMarketStructureMapping | Candle_Close | Map BOS lines to candle close or wick |
NumberOfBOSToDisplay |
int | 0 | Max BOS lines to show (0 = all) |
TrendBosCount |
int | 1 | Number of BOS needed to confirm a trend change |
BOSAlert |
bool | false | Enable/disable BOS alerts |
BOSAlertSound |
string | Alert2.wav | Sound file for BOS alerts |
BullishBOSColor |
Stroke | DodgerBlue, Solid, 2 | Bullish BOS line color and style |
BearishBOSColor |
Stroke | DodgerBlue, Solid, 2 | Bearish BOS line color and style |
MicroBullishBOSColor |
Stroke | DimGray, Dash, 1 | Micro bullish BOS line color and style |
MicroBearishBOSColor |
Stroke | DimGray, Dash, 1 | Micro bearish BOS line color and style |
BOSFont |
SimpleFont | Arial, 12 | Font for macro BOS labels |
MicroBOSFont |
SimpleFont | Arial, 10 | Font for micro BOS labels |
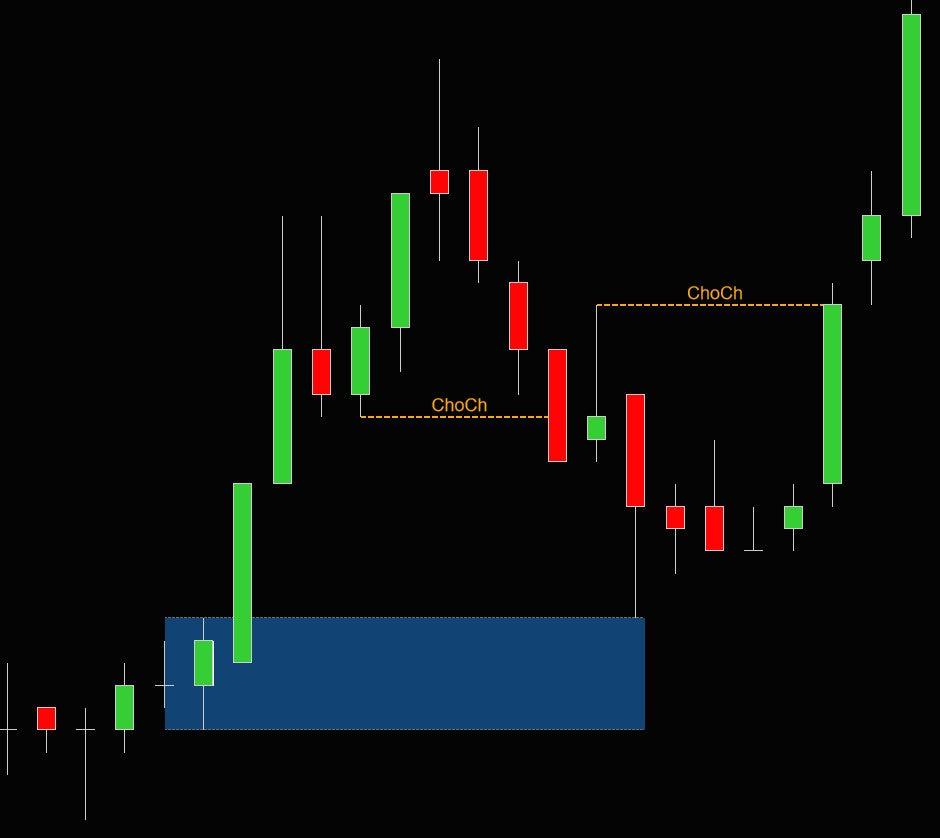
Change of Character (ChoCh)
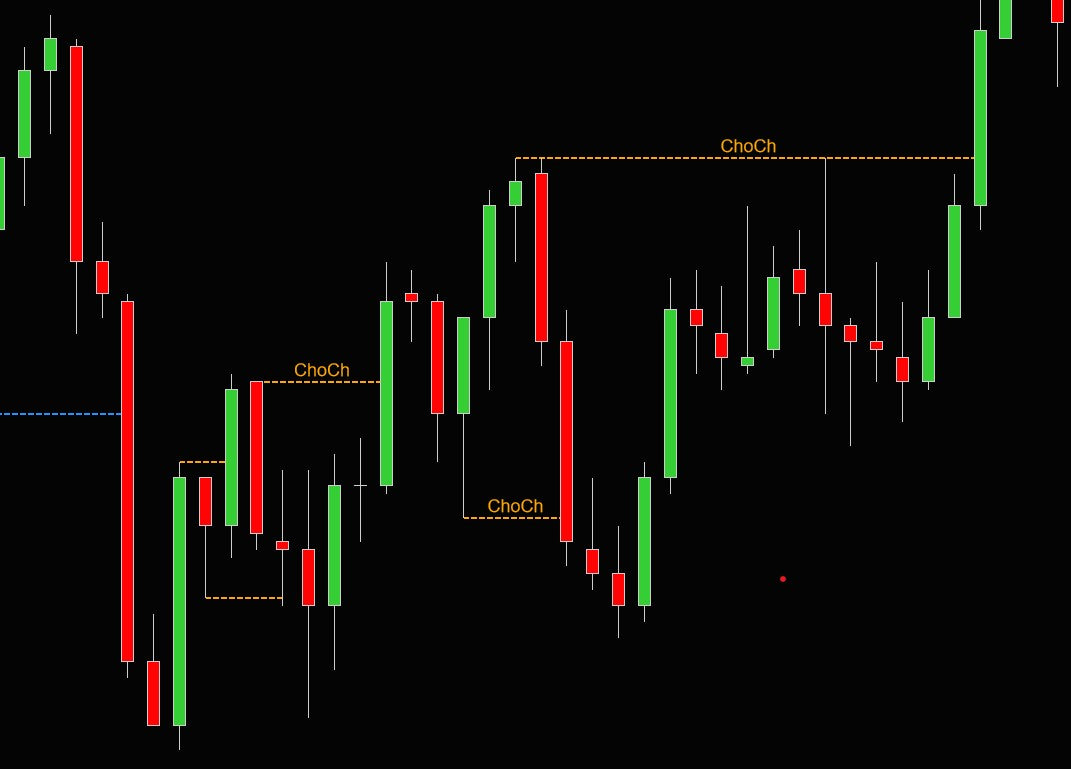
A Change of Character (ChoCh) signals a shift in the internal market substructure — it marks the point where the smaller trend within the bigger trend changes direction. Think of it as an early warning system: ChoCh often shows the first signs that the trend is about to pull back or potentially reverse. While a full trend reversal requires a BOS confirmation, the ChoCh is frequently the first clue that momentum is shifting.
The indicator detects both macro ChoCh (larger structural shifts) and micro ChoCh (small moves within the internal structure). Macro ChoCh captures significant turning points, while micro ChoCh helps you spot the earliest signs of directional change on lower timeframes.
ChoCh vs. BOS: Understanding the Difference
BOS and ChoCh serve different purposes. A BOS confirms the trend — it tells you the big players are still pushing in the same direction. A ChoCh signals a potential change — the first break against the current internal structure. In a bullish trend (higher highs, higher lows), a ChoCh occurs when price breaks below an internal low for the first time. This doesn't necessarily mean the trend has reversed, but it means the internal momentum has shifted and a pullback or reversal may be starting.
Why ChoCh Matters for Your Trading
ChoCh is one of the most powerful tools for timing entries. By combining higher-timeframe BOS (for direction) with lower-timeframe ChoCh (for timing), you can enter trades at optimal points rather than chasing price after a breakout. ChoCh also helps you recognize when a pullback is ending and the trend is about to resume.
- Identify the trend on a higher timeframe using BOS (e.g., bearish BOS on 1H chart)
- Drop to a lower timeframe (e.g., 5min) and wait for a bullish ChoCh — this is the pullback starting
- Wait for a bearish ChoCh on the same lower timeframe — this means the pullback is ending
- Now the lower timeframe is re-aligned with the higher timeframe trend
- Enter short at a supply zone, order block, or FVG that coincides with the bearish ChoCh
| Setting | Type | Default | Description |
|---|---|---|---|
ChoChDisplayType |
TDUMarketStructureDisplayType | Text | How ChoCh lines are displayed |
ChoChStructureMapping |
TDUMarketStructureMapping | Candle_Close | Map ChoCh lines to candle close or wick |
NumberOfChoChToDisplay |
int | 0 | Max ChoCh lines to show (0 = all) |
ChoChAlert |
bool | false | Enable/disable ChoCh alerts |
ChoChAlertSound |
string | Alert2.wav | Sound file for ChoCh alerts |
BullishChOfChColor |
Stroke | Orange, Solid, 2 | Bullish ChoCh line color and style |
BearishChOfChColor |
Stroke | Orange, Solid, 2 | Bearish ChoCh line color and style |
MicroBullishChOfChColor |
Stroke | DimGray, Dash, 2 | Micro bullish ChoCh color and style |
MicroBearishChOfChColor |
Stroke | DimGray, Dash, 2 | Micro bearish ChoCh color and style |
ChoChFont |
SimpleFont | Arial, 12 | Font for macro ChoCh labels |
MicroChoChFont |
SimpleFont | Arial, 10 | Font for micro ChoCh labels |
Swing Structure

Swing structure is the backbone of market analysis in Smart Money Concepts. The indicator identifies the most recent significant swing high and swing low, and classifies each as strong or weak. This classification is critical because it tells you where price is likely headed and where it is likely to hold.
- A strong high occurs when a new low was formed after the high — it was created by significant institutional capital pushing price down from that level. Strong highs are protected levels that the market is unlikely to break easily.
- A weak high is the most recent high that failed to produce a new low after it. It sits above the current price as a target — a level that the market is likely to revisit and sweep through.
- A strong low occurs when a new high was formed after the low — it was defended by buyers and the market moved higher from it.
- A weak low is the most recent low that failed to produce a new high. It sits below as a target, attracting price toward it.
Why Strong/Weak Matters
The strong/weak classification gives you a built-in target and stop-loss framework. In a bullish trend, the strong low acts as your support (place stops behind it) and the weak high acts as your target (price is drawn toward it). In a bearish trend, the strong high is resistance and the weak low is the target. This removes guesswork from where to place stops and targets.
- After a BOS confirms the trend, identify the current strong and weak levels
- In a bullish trend: enter longs on pullbacks to demand zones with stops behind the strong low, targeting the weak high
- In a bearish trend: enter shorts on rallies to supply zones with stops behind the strong high, targeting the weak low
- When the weak level gets taken out, the structure updates — a new strong/weak pair forms, giving you your next trade setup
HH/LL Labels
Show Higher High (HH), Higher Low (HL), Lower High (LH), and Lower Low (LL) labels at swing points. These labels make it easy to visually confirm the trend at a glance: a bullish trend shows a sequence of HH and HL, while a bearish trend shows LH and LL. When the sequence breaks (e.g., a LL appears in a bullish sequence), it signals a potential trend change. This is the most fundamental way to read price structure.
Fractals
Show fractal up/down markers at the exact bars where the indicator detected a swing pivot based on the FractalSize parameter. Fractals are visual confirmation of where the detection algorithm found significant swing points. They help you verify that the indicator is correctly identifying the structure you see on the chart.
| Setting | Type | Default | Description |
|---|---|---|---|
ShowSwingHighLow |
bool | true | Show strong/weak swing high/low labels |
ShowHHLL |
bool | true | Show HH/HL/LH/LL labels at swing points |
ShowFractals |
bool | false | Show fractal up/down markers |
FractalSize |
int | 4 | Bars on each side for fractal detection |
StrongSwingHiColor |
Stroke | White, Dash, 1 | Strong swing high line color |
StrongSwingLowColor |
Stroke | White, Dash, 1 | Strong swing low line color |
WeakSwingHiColor |
Stroke | White, Dash, 1 | Weak swing high line color |
WeakSwingLowColor |
Stroke | White, Dash, 1 | Weak swing low line color |
SwingHighLowFont |
SimpleFont | Arial, 12 | Font for swing high/low labels |
HHLLTextColor |
Stroke | White | HH/LL label text color |
HHLLFont |
SimpleFont | Arial, 12 | Font for HH/LL labels |
HHLLOffset |
int | 20 | Vertical offset in pixels for HH/LL labels |
FractalUpColor |
Stroke | Lime, Solid, 1 | Fractal up marker color |
FractalDownColor |
Stroke | Red, Solid, 1 | Fractal down marker color |
Internal Structure
Internal structure shows the highs and lows within the current swing range. While the main swing structure tracks the macro trend (the big moves), internal structure tracks the smaller micro movements happening between the most recent swing high and swing low. Internal highs and lows are drawn as horizontal lines on the chart, giving you a layered view of price behavior.
What Internal Structure Tracks
Imagine price is in a bullish trend, moving from a swing low toward a swing high. Along the way, it doesn't move in a straight line — it makes small pullbacks and pushes. Internal structure captures these smaller highs and lows within the current move. This is the structure that ChoCh signals are based on: when price breaks an internal low in a bullish move, that's a ChoCh, signaling a possible pullback or reversal of the micro trend.
Why Internal Structure Matters
Internal structure bridges the gap between the macro view (BOS, major swings) and the micro view (individual candles). It helps you understand where price is within the current structural leg:
- Entry timing: After a BOS confirms direction, internal structure shows you exactly where the pullback is within the move. Wait for price to pull back to an internal low (bullish trend) or internal high (bearish trend) for better entry prices.
- Pullback depth: Internal highs and lows reveal how deep the current pullback has gone. If price breaks through multiple internal levels, the pullback is more severe and you may want to wait for a ChoCh to re-confirm direction before entering.
- Risk management: Place stops behind internal structure levels for tighter risk, or behind the main swing structure for wider stops with more room.
| Setting | Type | Default | Description |
|---|---|---|---|
ShowInternalHighLow |
bool | true | Show internal structure high/low markers |
InternalHiColor |
Stroke | White, Dash, 1 | Internal high line color |
InternalLowColor |
Stroke | White, Dash, 1 | Internal low line color |
InternalHighLowFont |
SimpleFont | Arial, 12 | Font for internal high/low labels |
Supply & Demand Zones
Supply and demand zones are the primary entry zones in Smart Money Concepts trading. They highlight the exact price areas where institutional buying or selling was strong enough to create a structural break. When price returns to these zones, the same institutional interest often reactivates, making them powerful areas for trade entries.
Unlike traditional support and resistance (which are single lines), supply and demand zones are price ranges — they capture the full area where institutional activity occurred. The indicator draws these zones forward from where they formed and keeps them on the chart until they are tested or broken.
Why Supply/Demand Zones Form
Institutional traders cannot fill large orders at a single price — they need a range of prices and enough volume to execute their positions. When a large buy order absorbs all available sell orders in a price range, it creates a demand zone. When a large sell order absorbs all available buy orders, it creates a supply zone. The structural break (BOS or ChoCh) that follows is evidence that the institutional order was large enough to move the market.
When price returns to these zones, any remaining unfilled institutional orders may still be waiting. This is why zones often produce strong reactions — the original order flow resumes.
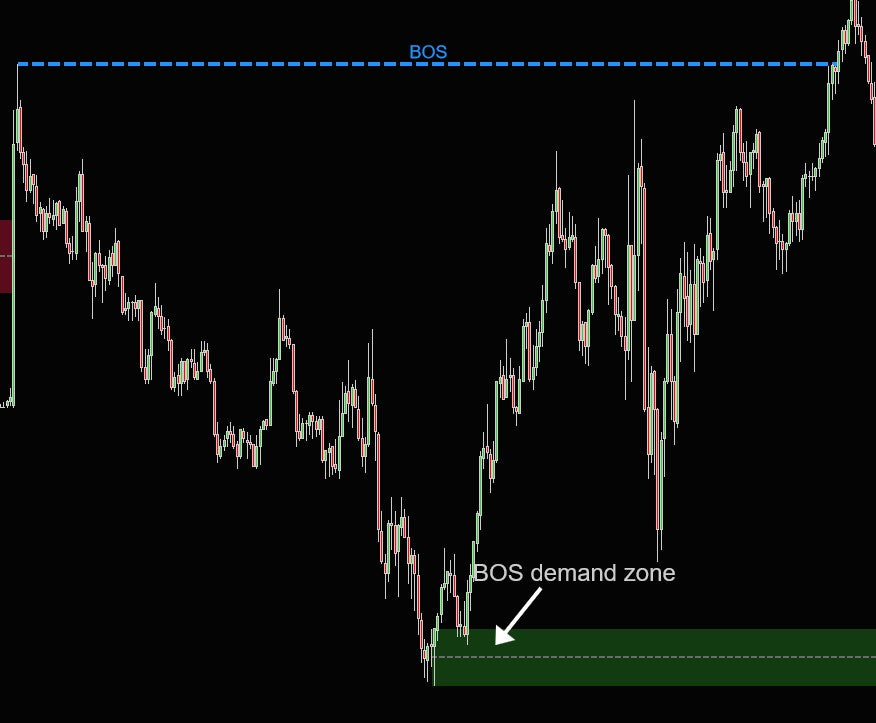
BOS Supply/Demand Zones
These are the strongest zones. They are drawn from the lowest point (demand) or highest point (supply) between the start of the swing and the BOS break. Because a BOS confirms the trend, these zones mark where the trend-confirming institutional activity happened. BOS demand zones in a bullish trend and BOS supply zones in a bearish trend are the highest-probability entry zones.
ChoCh Supply/Demand Zones
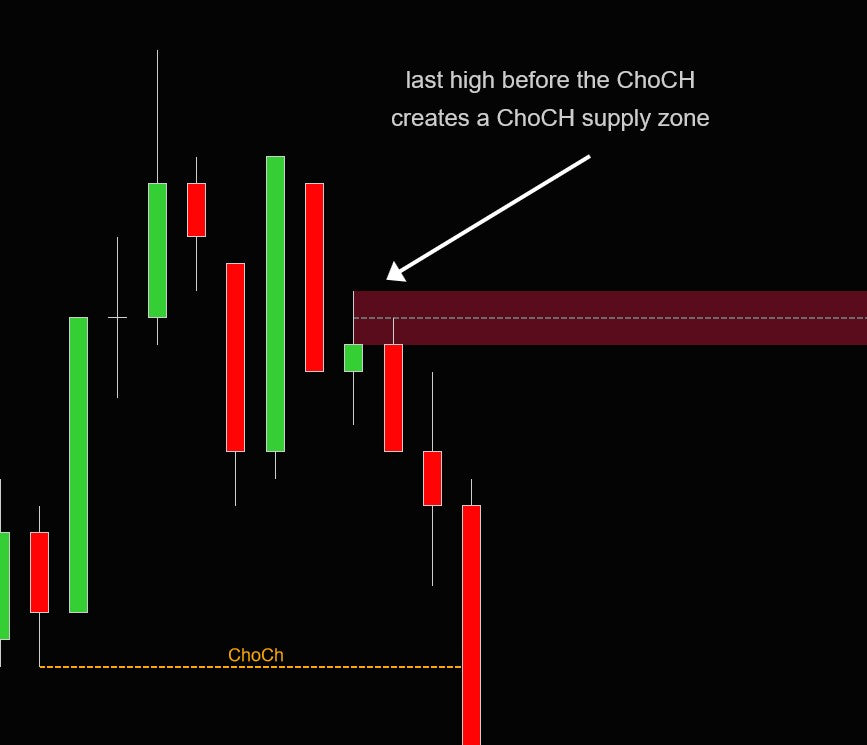
Drawn from the last high or low before the ChoCh was made. These zones are weaker than BOS zones because a ChoCh represents a potential shift rather than a confirmed trend. However, ChoCh zones are useful for counter-trend entries or for aggressive traders who want to enter early before the trend is fully confirmed.
- After a bullish BOS, wait for price to pull back into a demand zone (buy zone)
- Look for confirmation on a lower timeframe: a bullish ChoCh or micro BOS within the zone
- Enter long with your stop-loss below the demand zone
- Target the weak swing high or the next supply zone above
- The zone is invalidated if price closes through it — exit the trade
Premium vs. Discount
Every swing range has a midpoint (50% level). Price above the midpoint is in premium territory — expensive relative to the range. Price below the midpoint is at a discount. In a bullish trend, look for entries at demand zones in the discount area (below 50%). In a bearish trend, look for entries at supply zones in the premium area. The PremiumDiscount break type uses this midpoint to determine when zones are broken.
Breaker Blocks
When a supply/demand zone is broken through, the polarity flips — the zone becomes a breaker block. A broken demand zone (where buyers previously stepped in) becomes a bearish breaker block (now acting as resistance). A broken supply zone becomes a bullish breaker block (now acting as support). This concept is based on the idea that the institutional orders that once defended the zone have been overwhelmed, and the area now represents a reference point for the winning side. Enable with ShowSupplyDemandZonesBreakerBlocks.
Zone Types
Candle draws zones using the full candle body — wider zones that capture more area. Wick draws zones using wicks only — tighter zones that focus on the extremes. Wick zones are more precise but may get broken more often. Candle zones give more breathing room.
Break Detection
Controls when a zone is considered broken:
- Wick: Zone breaks when any wick penetrates through it. Most sensitive — removes zones early.
- Close: Zone breaks only when a candle closes through it. More conservative — ignores intra-bar spikes.
- PremiumDiscount (default): Zone breaks at the 50% midpoint. This is the most nuanced option — a zone is only invalid when price has moved through the premium/discount midpoint, meaning the majority of the zone has been consumed.
| Setting | Type | Default | Description |
|---|---|---|---|
SupplyDemandDisplayType |
TDUMarketStructureSupplyDemandDisplayType | None | Show zones for: None, Bos, ChoCh, or Both |
ShowSupplyDemandZonesBreakerBlocks |
bool | false | Show breaker blocks when zones are broken |
HideBrokenSupplyDemandZones |
bool | true | Hide zones after they are broken |
NumberOfSDZones |
int | 3 | Max zones to display (0 = all) |
SupplyDemandType |
TDUMarketStructureSupplyDemandType | Wick | Zone boundary type: Candle or Wick |
SupplyDemandBreakType |
TDUMarketStructureSDBroken | PremiumDiscount | When zones are considered broken |
SupplyBackgroundColor |
Stroke | Orange, Solid, 15% | Supply zone background |
SupplyOutlineColor |
Stroke | Orange, Solid, 100% | Supply zone outline |
DemandBackgroundColor |
Stroke | DodgerBlue, Solid, 25% | Demand zone background |
DemandOutlineColor |
Stroke | DodgerBlue, Solid, 100% | Demand zone outline |
SupplyDemandCenter |
Stroke | DimGray, Dash | Zone midline color |
BreakerSupplyBackgroundColor |
Stroke | Crimson, Solid, 15% | Breaker supply background |
BreakerSupplyOutlineColor |
Stroke | Crimson, Dash, 100% | Breaker supply outline |
BreakerDemandBackgroundColor |
Stroke | ForestGreen, Solid, 25% | Breaker demand background |
BreakerDemandOutlineColor |
Stroke | ForestGreen, Dash, 100% | Breaker demand outline |
BreakerSupplyDemandCenter |
Stroke | White, Dash | Breaker block midline color |
Order Blocks
Order blocks are one of the most important concepts in Smart Money Concepts trading. They represent consolidation zones where institutional traders accumulated or distributed large positions before an aggressive move. After this move, price often returns to retest the order block — providing high-probability entry opportunities with tight risk.
The theory behind order blocks: institutional traders split large orders across multiple small bars to avoid moving the market. This creates a tight consolidation (the base bars), followed by an aggressive breakout (the thrust bar) once the position is filled. The order block zone marks where the institutional position was built.
Why Order Blocks Work
When an institution builds a position in a consolidation range, not all of the intended order may be filled. When price returns to the order block, the remaining unfilled orders may still be waiting. Additionally, the institution has a vested interest in defending this price level — if price breaks through their entry, they're at a loss. This creates a natural support or resistance effect at order block levels.
Order blocks that coincide with supply/demand zones or fair value gaps create confluence — multiple reasons for price to react at the same level. These are the highest-probability entries in SMC trading.
- After a bullish BOS, look for demand order blocks (consolidation before an upward thrust) within the pullback zone
- Wait for price to return to the order block zone
- Enter long when price touches or enters the order block, especially if it aligns with a demand zone or FVG
- Place your stop-loss below the order block zone
- Target the weak swing high or the next supply zone
- If the order block gets broken through, it becomes invalid — or a breaker block if enabled
Detection Parameters
The indicator identifies order blocks using a base-thrust pattern. Base bars are the small-range consolidation candles where accumulation occurred — you control the minimum and maximum count (MinBaseBars, MaxBaseBars) and the maximum range as a percentage of the average bar range (BaseBarMaxPercentage). The thrust bar is the aggressive breakout candle — you control its minimum range as a percentage of the average (ThrustBarMinPercentage). Enable PaintBaseBars to color the base bars on the chart for easy visual identification.
Order Block States
Order blocks transition through four states as price interacts with them:
- Active — untested, price has not returned to the zone. These are the freshest and often the strongest.
- Tested — price revisited the zone but respected it (did not break through). Tested blocks confirm that institutional interest is still present.
- Broken — price broke through the zone, invalidating the institutional defense. The position was overwhelmed.
- Breaker — a broken order block that flips polarity. A broken demand block becomes resistance, a broken supply block becomes support. Breaker blocks represent reference points where the winning side took control.
| Setting | Type | Default | Description |
|---|---|---|---|
ShowOrderBlocks |
bool | false | Enable order block detection |
ShowOrderBlockBreakerBlocks |
bool | false | Show breaker blocks for broken order blocks |
ShowTestedOrderBlocks |
bool | true | Show order blocks that have been tested |
ShowBrokenOrderBlocks |
bool | false | Show broken order blocks |
NumberOfOrderBlocksToShow |
int | 5 | Max order blocks to display (0 = all) |
MinBaseBars |
int | 1 | Minimum number of base (consolidation) bars |
MaxBaseBars |
int | 3 | Maximum number of base bars |
BaseBarMaxPercentage |
double | 50 | Maximum range of base bar as % of average |
ThrustBarMinPercentage |
double | 100 | Minimum range of thrust bar as % of average |
PaintBaseBars |
bool | true | Color the base bars on the chart |
OrderBlockDemandBackgroundColor |
Stroke | DodgerBlue, Solid, 30% | Demand block background |
OrderBlockDemandOutlineStroke |
Stroke | DodgerBlue, Solid, 100% | Demand block outline |
OrderBlockSupplyBackgroundColor |
Stroke | Indigo, Solid, 30% | Supply block background |
OrderBlockSupplyOutlineStroke |
Stroke | Indigo, Solid, 100% | Supply block outline |
OrderBlockBaseBarStroke |
Stroke | White, Dash | Base bar marker style |
OrderBlockMidlineColor |
Stroke | White, Dash | Order block midline color |
OrderBreakerBlockDemandBackgroundColor |
Stroke | ForestGreen, Solid, 30% | Demand breaker block background |
OrderBreakerBlockDemandOutlineStroke |
Stroke | ForestGreen, Solid, 100% | Demand breaker block outline |
OrderBreakerBlockSupplyBackgroundColor |
Stroke | Crimson, Solid, 30% | Supply breaker block background |
OrderBreakerBlockSupplyOutlineStroke |
Stroke | Crimson, Solid, 100% | Supply breaker block outline |
OrderBreakerBlockMidlineColor |
Stroke | White, Dash, 30% | Breaker block midline color |
Fair Value Gaps

Fair Value Gaps (FVG) are a 3-candle pattern that reveals market imbalances. An FVG forms when the third candle does not fully overlap the first candle, leaving a price gap on the second (middle) candle. This gap represents an area where the market moved so aggressively that normal two-sided price discovery didn't occur — one side completely overwhelmed the other.
Markets tend toward efficiency. When an imbalance (FVG) is created, price has a natural tendency to return and "fill" the gap, restoring fair value. This creates high-probability entry opportunities: after an FVG forms and price moves away, wait for the retest of the gap to enter in the direction of the original move.
Why Fair Value Gaps Matter
FVGs are among the most reliable entry zones in SMC trading because they are rooted in market microstructure. The gap represents unfilled orders and an absence of traded volume at certain prices. When price returns to fill the gap:
- Sellers who missed the initial move get an opportunity to enter (bearish FVG)
- Buyers who missed the initial move get an opportunity to enter (bullish FVG)
- The institutional orders that created the original move may still have unfilled portions at these levels
The indicator shows bullish FVGs (gap below current price, formed during an upward move) and bearish FVGs (gap above current price, formed during a downward move). The MinGapTicks setting filters out insignificant gaps caused by normal price noise.
- Identify the trend direction using BOS
- In a bullish trend, look for bullish FVGs that form during impulse moves up
- Wait for price to pull back into the FVG zone (the gap area on the middle candle)
- Enter long when price touches the FVG, especially if it overlaps with a demand zone or order block
- Place your stop-loss below the FVG or below the first candle of the 3-candle pattern
- If the FVG gets fully filled and price continues through it, the gap has failed — exit or look for a breaker block setup
Breaker Blocks
When a fair value gap is broken through (price fills the gap and continues beyond it), the FVG can flip into a breaker block. A broken bullish FVG becomes a bearish breaker, and a broken bearish FVG becomes a bullish breaker. This polarity flip works the same way as supply/demand breaker blocks. Enable with ShowFairValueGapBreakerBlocks.
MinGapTicks to filter these out.
| Setting | Type | Default | Description |
|---|---|---|---|
ShowFairValueGaps |
bool | false | Enable fair value gap detection |
MinGapTicks |
int | 5 | Minimum gap size in ticks |
NumberOfGapsToShow |
int | 3 | Max FVGs to display (0 = all) |
ShowFairValueGapBreakerBlocks |
bool | false | Show breaker blocks for broken FVGs |
BullishGapOutlineColor |
Stroke | DodgerBlue, Solid, 100% | Bullish FVG outline |
BullishGapBackgroundColor |
Stroke | DodgerBlue, Solid, 25% | Bullish FVG background |
BearishGapOutlineColor |
Stroke | Orange, Solid, 100% | Bearish FVG outline |
BearishGapBackgroundColor |
Stroke | Orange, Solid, 15% | Bearish FVG background |
FairValueGapMidlineColor |
Stroke | White, Dash, 25% | FVG midline color |
BullishGapBreakerBlockBackgroundColor |
Stroke | ForestGreen, Solid, 25% | Bullish FVG breaker background |
BullishGapBreakerBlockOutlineColor |
Stroke | ForestGreen, Dash, 100% | Bullish FVG breaker outline |
BearishGapBreakerBlockBackgroundColor |
Stroke | Crimson, Solid, 15% | Bearish FVG breaker background |
BearishGapBreakerBlockOutlineColor |
Stroke | Crimson, Dash, 100% | Bearish FVG breaker outline |
FairValueGapBreakerMidlineColor |
Stroke | White, Dash, 25% | FVG breaker midline color |
Fibonacci Retracements
The indicator automatically draws Fibonacci retracement levels across each BOS swing range, showing you key price levels where pullbacks are statistically likely to find support or resistance. Up to 6 customizable levels are available, each with its own color. Set a level to 0 to disable it.
Why Fibonacci Works in Trading
Fibonacci retracement levels have been used by traders for decades because they consistently identify areas where price stalls during pullbacks. While the mathematical reasons are debated, the practical reality is clear: so many traders (retail and institutional) watch these levels that they become self-fulfilling. Orders cluster at Fibonacci levels, creating real support and resistance.
In SMC trading, Fibonacci levels serve a specific purpose: they help you identify the premium/discount zones within a swing. Price above the 50% level is in premium territory (expensive), price below is at a discount (cheap). Smart money buys at a discount and sells at a premium.
Key Levels
- 50% (Equilibrium): The midpoint of the swing. This is the boundary between premium and discount. Many traders watch this level as a minimum retracement target.
- 61.8% (Golden Ratio): The most widely watched Fibonacci level. Pullbacks to this level often produce strong reactions. A pullback that holds here suggests the trend is healthy.
- 78.6%: A deep retracement that often marks the last line of defense. If price reaches this level and holds, it often produces explosive continuation moves. If it breaks, the structure may be invalidating.
- 88.6%: The deepest standard retracement. Reactions here are less common but can produce significant moves when they occur.
- After a BOS, the indicator automatically draws Fib levels across the swing range
- Wait for price to pull back into the discount zone (below 50% for bullish, above 50% for bearish)
- Look for confluence: does a demand zone, order block, or FVG align with a Fibonacci level?
- The more confluences at a single level, the higher the probability of a reaction
- Enter at the confluence level with stops behind the 100% level (full retracement = structure broken)
Display Modes
- Normal: Draws individual horizontal lines at each Fibonacci level, with optional percentage labels
- Cluster: Groups nearby levels into shaded visual clusters, making it easier to identify confluence zones where multiple Fib levels stack together
| Setting | Type | Default | Description |
|---|---|---|---|
ShowFibRetracements |
bool | false | Enable Fibonacci retracement levels |
ShowFibNumbers |
bool | true | Show percentage labels on Fibonacci lines |
FibonacciType |
TDUMarketStructureFibonacciType | Normal | Display mode: Normal or Cluster |
FibRetracement1 |
double | 50 | First retracement level (%) |
FibRetracement2 |
double | 61.8 | Second retracement level (%) |
FibRetracement3 |
double | 78.6 | Third retracement level (%) |
FibRetracement4 |
double | 88.6 | Fourth retracement level (%) |
FibRetracement5 |
double | 0 | Fifth retracement level (%, 0 = disabled) |
FibRetracement6 |
double | 0 | Sixth retracement level (%, 0 = disabled) |
FibRetracement1Color |
Stroke | Crimson, Dash | Level 1 line color |
FibRetracement2Color |
Stroke | Yellow, Dash | Level 2 line color |
FibRetracement3Color |
Stroke | DodgerBlue, Dash | Level 3 line color |
FibRetracement4Color |
Stroke | Violet, Dash | Level 4 line color |
FibRetracement5Color |
Stroke | Orange, Dash | Level 5 line color |
FibRetracement6Color |
Stroke | Magenta, Dash | Level 6 line color |
FibRetracementAnchorStroke |
Stroke | DimGray, Dash | Anchor line connecting swing points |
Volume Profile
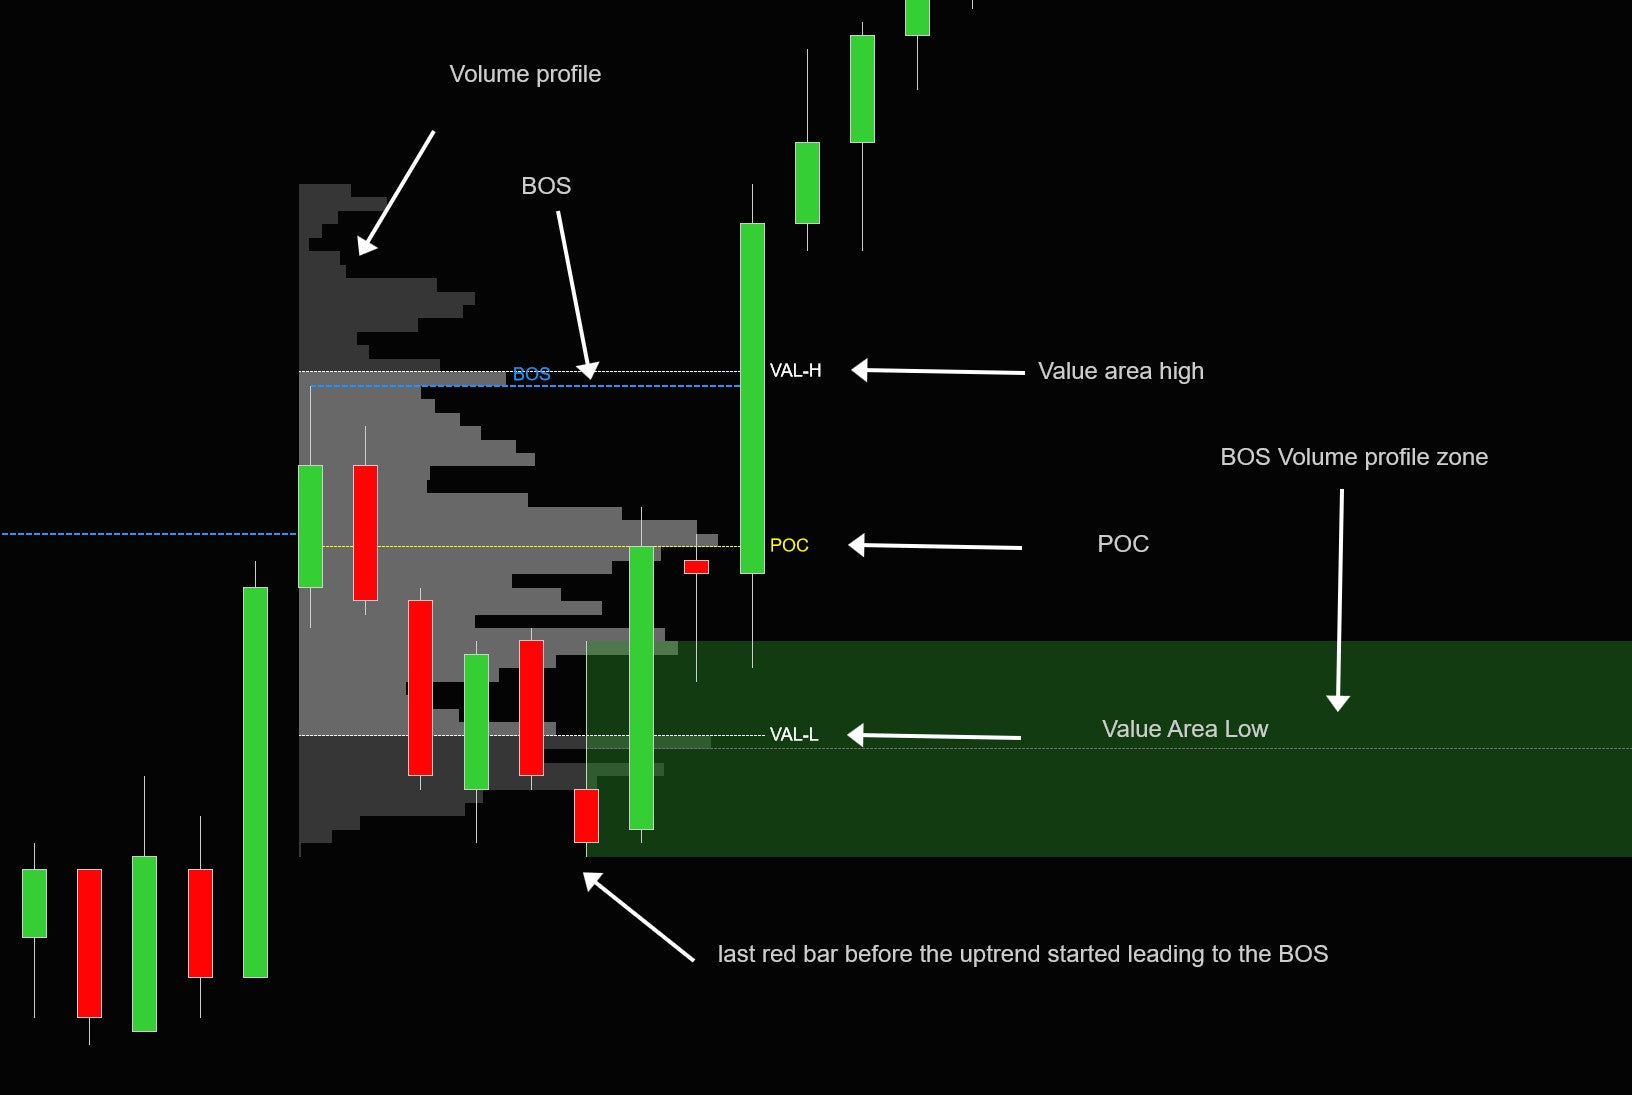
Volume profile adds a powerful volume-based dimension to your SMC analysis. For each BOS, the indicator builds a volume profile showing the distribution of traded volume from the start of the swing to the structural break. This reveals exactly where institutional activity was concentrated during each structural move — information that pure price-based analysis cannot provide.
While price tells you what happened, volume tells you how much conviction was behind it. Levels where heavy volume traded act as magnets and barriers for future price action.
Why Volume Profile Matters
Volume profile transforms each BOS swing from a simple price range into a detailed map of institutional participation. High-volume levels (near the POC) represent areas of acceptance — where the market spent the most time and agreed on fair value. Low-volume levels represent areas of rejection — where price moved through quickly. When price returns to these levels:
- High-volume levels (POC, value area) tend to attract price and act as support/resistance
- Low-volume levels offer little resistance — price can move through them quickly
Key Concepts
- POC (Point of Control): The single price level where the most volume traded during the BOS. This is the market's "fair value" for that swing. Price gravitates toward the POC when it re-enters the range.
- Value Area: The price range containing 68% (configurable) of all volume during the BOS. This represents the core acceptance zone. Price inside the value area is in equilibrium; price outside is in imbalance.
- VP Order Blocks: The indicator identifies the last red bar touching the value area low (bullish BOS) or last green candle touching the value area high (bearish BOS). These are areas where the last counter-trend activity occurred before the BOS — making them high-confluence entry zones when retested.
- After a bullish BOS, look at the volume profile of the swing — identify the POC and value area low
- If price pulls back to the value area low, this is a high-probability long entry — especially if it aligns with a demand zone or Fibonacci level
- The POC acts as a magnet: in a pullback, price often stops at or near the POC before continuing
- VP order blocks at the value area edges are the strongest confluence zones — they combine volume analysis with price structure
- If price breaks below the value area low and stays there, the institutional acceptance zone has shifted — the trade thesis may be invalid
Display Modes
- Off: Volume profile disabled
- ProfileAndLevels: Full volume histogram displayed within each BOS range, plus POC and value area lines. Best for detailed analysis.
- LevelsOnly: Just the POC and value area high/low lines without the histogram. Cleaner view for traders who want the key levels without visual clutter.
| Setting | Type | Default | Description |
|---|---|---|---|
ShowBOSVolumeProfile |
TDUMarketStructureVolumeProfileType | Off | Volume profile display mode |
ShowBOSVolumeProfileOrderBlocks |
bool | false | Show value area high/low order blocks |
HideBOSBrokenVolumeProfileOrderBlocks |
bool | false | Hide broken VP order blocks |
NumberOfVolumeProfiles |
int | 0 | Max volume profiles to show (0 = all) |
ValueAreaPercentage |
double | 68 | Percentage of volume for value area calculation |
VolumeProfileWidth |
double | 90 | Width of volume profile histogram (%) |
VolumeProfileFont |
SimpleFont | Arial, 8 | Font for volume profile labels |
ValueAreaStroke |
Stroke | White, Solid, 20% | Value area histogram color |
VolumeAreaStroke |
Stroke | DarkGray, Solid, 10% | Volume area (outside VA) histogram color |
POCStroke |
Stroke | Yellow, Dash | Point of Control line color |
VALStroke |
Stroke | White, Dash | Value area low/high line color |
VPVALLowStroke |
Stroke | ForestGreen, Dash, 25% | VA low order block color |
VPVALHighStroke |
Stroke | Crimson, Dash, 15% | VA high order block color |
VPOutlineStroke |
Stroke | DimGray, Dash | VP order block midline color |
Equal Highs & Lows
Equal highs and equal lows are a powerful liquidity concept in Smart Money trading. They occur when two or more swing points cluster at nearly the same price level (within a configurable tick tolerance). These levels are significant because they represent liquidity pools — large clusters of stop-loss orders placed by retail traders.
The Liquidity Theory Behind Equal Highs/Lows
When price forms two or more highs at the same level, retail traders see a "double top" and place sell stop-losses just above. When price forms two or more lows at the same level, they see a "double bottom" and place buy stop-losses just below. These stop orders create pools of resting liquidity that institutional traders can target.
Institutions need liquidity to fill large orders. Equal highs provide a known pool of sell-side liquidity (stop-loss buy orders from shorts). Equal lows provide a known pool of buy-side liquidity (stop-loss sell orders from longs). The institution pushes price through the equal level to trigger these stops, absorbs the liquidity to fill their position, and then reverses.
Why Equal Highs/Lows Matter
Recognizing equal highs and lows helps you understand where the smart money is likely to go next. In a bullish trend, equal highs above current price are targets — they will likely be swept. In a bearish trend, equal lows below are targets. This knowledge helps you set realistic targets and avoid placing your own stops at these obvious liquidity levels.
- Identify equal highs/lows on the chart — the indicator marks them automatically
- Expect price to eventually sweep through these levels (take the liquidity)
- After the sweep, watch for a reversal signal (ChoCh, order block retest, or FVG) — this is often where the real move begins
- Avoid placing your own stops at equal levels — they're obvious targets for stop hunts
- Use equal highs/lows as targets for existing trades: in a bullish trend, target the equal highs above
The indicator automatically detects equal highs and equal lows by comparing consecutive swing points. A horizontal dashed line connects the equal levels on the chart. The EqualLowMaxDifference setting controls how close (in ticks) two swing points need to be to qualify as "equal."
| Setting | Type | Default | Description |
|---|---|---|---|
ShowEqualLowsHighs |
bool | true | Enable equal highs/lows detection |
EqualLowMaxDifference |
int | 2 | Maximum distance in ticks for levels to be considered equal |
EqualLowColor |
Stroke | ForestGreen, Dash | Equal low line color |
EqualHighColor |
Stroke | Crimson, Dash | Equal high line color |
EqualLowHighFont |
SimpleFont | Arial, 10 | Font for equal high/low labels |
Trendline Liquidity
Trendline liquidity is a concept that combines classical technical analysis with Smart Money liquidity theory. The indicator automatically draws trendlines through swing points — connecting higher lows in a bullish trend and lower highs in a bearish trend. But unlike traditional TA where trendlines are support/resistance, SMC views these trendlines as liquidity zones.
Why Trendlines Attract Liquidity
Trendlines are one of the most widely followed technical analysis tools. Millions of retail traders draw the same trendlines and place their stop-loss orders just beyond them:
- In a bullish trend, traders go long at the rising trendline and place stops just below it — creating buy-side liquidity underneath
- In a bearish trend, traders go short at the falling trendline and place stops just above it — creating sell-side liquidity above
Institutions know exactly where these stops are clustered. When they need liquidity to fill a large position, they push price through the trendline to trigger the stops, absorb the resulting orders, and then move price in their intended direction.
Why Trendline Liquidity Matters
Understanding trendline liquidity helps you avoid one of the most common retail trading mistakes: using trendlines as simple support/resistance and getting stopped out on the trendline break. Instead, you can anticipate the sweep and position yourself to trade the reversal after the liquidity grab.
- Identify the trendline the indicator has drawn — this marks a known liquidity zone
- When price approaches the trendline, expect a potential break (liquidity sweep) rather than a clean bounce
- After the trendline breaks, watch for a quick reversal back above/below the trendline
- If the break is a sweep (price quickly returns), this is a high-probability entry in the original trend direction
- Combine with order blocks or FVGs near the trendline for stronger confluence
- If price breaks the trendline and stays beyond it with a BOS, the trend may actually be changing — respect the structure
| Setting | Type | Default | Description |
|---|---|---|---|
ShowTrendLineLiquidity |
bool | true | Enable trendline liquidity detection |
BullishTrendLineColor |
Stroke | ForestGreen, Dash | Bullish trendline color |
BearishTrendLineColor |
Stroke | Crimson, Dash | Bearish trendline color |
TrendLineLiquidityFont |
SimpleFont | Arial, 10 | Font for trendline labels |
Trend Display & Paint Bars
The indicator can display the current trend direction as a text overlay on the chart. The position is configurable (TopLeft, TopRight, BottomLeft, BottomRight, or Off). When multi-timeframe is enabled, the timeframe label is shown alongside the trend.
Paint Bars colors the chart candles based on the detected trend direction. Bullish trend bars are colored green (LimeGreen), bearish trend bars are colored red.
| Setting | Type | Default | Description |
|---|---|---|---|
TrendPosition |
TDUMarketStructureTrendPosition | TopLeft | Where to show the trend text (TopLeft, TopRight, BottomLeft, BottomRight, Off) |
PositionX |
int | 20 | Horizontal offset in pixels for trend display |
PositionY |
int | 50 | Vertical offset in pixels for trend display |
PaintBars |
bool | false | Color candles based on trend direction |
BullishTrendBar |
Stroke | LimeGreen, Solid | Bullish trend candle color |
BearishTrendBar |
Stroke | Red, Solid | Bearish trend candle color |
TextColor |
Stroke | White, Solid | Trend display text color |
Font |
SimpleFont | Arial, 12 | Trend display text font |
ButtonText |
string | "SMC" | Text shown on the chart toolbar button |
Multi-Timeframe Support

One of the most powerful features: display market structure from a higher timeframe directly on your current chart. See the 4H BOS and supply/demand zones on a 5-minute chart, for example.
Enable MTF in the indicator settings, select the desired timeframe (e.g., 60-minute, 4-hour), and the indicator will calculate and display structure from that timeframe overlaid on your chart.
| Setting | Type | Default | Description |
|---|---|---|---|
UseMTF |
bool | false | Enable multi-timeframe mode |
MTFBarPeriodPeriodType |
BarsPeriodType | Minute | MTF timeframe period type |
MTFBarPeriodPeriodValue |
int | 15 | MTF timeframe period value |
MTFBarsToLoad |
int | 1000 | Number of MTF bars to load for calculation |
TradingHoursInstance |
TradingHours | (Instrument default) | Trading hours template for MTF data series |
Easy Access Toolbar Menu
Right-click the "SMC" button on the chart toolbar to access the easy access menu. This menu lets you toggle every major feature on/off without opening the indicator settings dialog. Changes take effect immediately.
The menu is organized into logical groups matching the indicator’s feature categories. You can also use the mousewheel to cycle through options.
Structure
Show BOS Show Micro BOS Show ChoCh Show Micro ChoCh Show Strong/Weak Hi/Lo Show HH/LL Show Internal Hi/Lo Show FractalsZones & Blocks
Show Supply/Demand (None/BOS/ChoCh/Both) Show SD Breaker Blocks Show Order Blocks Show OB Breaker Blocks Show Tested Order Blocks Show Broken Order Blocks Paint Base BarsGaps & Levels
Show Fair Value Gaps Show FVG Breaker Blocks Show Fibonacci Show Fib Numbers Fib Type (Normal/Cluster)Volume Profile
Show Volume Profile (Off/Profile+Levels/Levels Only) Show VP Order Blocks Hide Broken VP Order BlocksOther Features
Show Equal Lows/Highs Show Trendline Liquidity Show Trend Paint BarsDisplay
BOS Display (None/Line/Text/Text+TF) ChoCh Display (None/Line/Text/Text+TF) BOS Mapping (Close/Wick) ChoCh Mapping (Close/Wick)Alerts
BOS Alert On/Off ChoCh Alert On/OffGeneral
Enable/Disable IndicatorAlerts
The indicator supports real-time alerts for Break of Structure and Change of Character events. Alerts trigger a sound file when a new BOS or ChoCh is detected.
BOS Alerts
Enable with BOSAlert = true. Configurable sound file (default: Alert2.wav). Triggers on both bullish and bearish BOS.
ChoCh Alerts
Enable with ChoChAlert = true. Configurable sound file (default: Alert2.wav). Triggers on both bullish and bearish ChoCh.
Strategy & AlgoStudio Pro Support
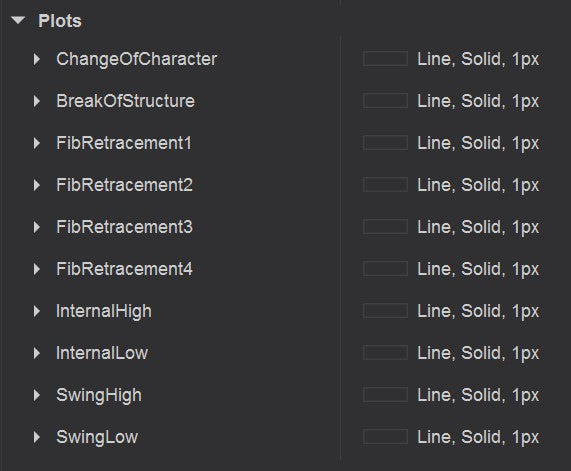
The indicator exports 16 plots for use in AlgoStudio Pro, NinjaScript strategies, Strategy Builder, or your own custom code. All plots are updated in real-time.
| Plot # | Name | Description |
|---|---|---|
| 0 | ChangeOfCharacter | ChoCh direction: 1 = bullish, -1 = bearish, 0 = none |
| 1 | BreakOfStructure | BOS direction: 1 = bullish, -1 = bearish, 0 = none |
| 2 | FibonacciLevel1 | Price at Fibonacci level 1 (default 50%) |
| 3 | FibonacciLevel2 | Price at Fibonacci level 2 (default 61.8%) |
| 4 | FibonacciLevel3 | Price at Fibonacci level 3 (default 78.6%) |
| 5 | FibonacciLevel4 | Price at Fibonacci level 4 (default 88.6%) |
| 6 | FibonacciLevel5 | Price at Fibonacci level 5 (if configured) |
| 7 | FibonacciLevel6 | Price at Fibonacci level 6 (if configured) |
| 8 | InternalHigh | Current internal structure high price |
| 9 | InternalLow | Current internal structure low price |
| 10 | SwingHigh | Current major swing high price |
| 11 | SwingLow | Current major swing low price |
| 12 | OrderBlockPrice | Price of nearest active order block |
| 13 | OrderBlockDistanceTicks | Distance in ticks to nearest order block |
| 14 | FVGPrice | Price of nearest active fair value gap |
| 15 | FVGDistanceTicks | Distance in ticks to nearest FVG |
Code Example
// Access TDU Market Structure plots from a NinjaScript strategy
var smc = TDUMarketStructure();
double swingHigh = smc.SwingHigh[0];
double swingLow  = smc.SwingLow[0];
int    bosSignal = (int)smc.BreakOfStructure[0]; // 1=bull, -1=bear, 0=none
double nearestOB = smc.OrderBlockPrice[0];
Complete Settings Reference
Below is a comprehensive reference of every configurable setting, organized by property group.
| Setting | Type | Default | Description |
|---|---|---|---|
| 00. TradeDevils | |||
Version |
string | (current) | Indicator version (read-only) |
Website |
string | www.tradedevils-indicators.com | Support website (read-only) |
Email |
string | Your license email | |
ContactId |
long | Your license contact ID | |
| 01. General | |||
SmcDetectionMethod |
Enum | Fractal | Detection algorithm: PriceAction or Fractal |
TrendPosition |
Enum | TopLeft | Trend display position (TopLeft / TopRight / BottomLeft / BottomRight / Off) |
TrendBosCount |
int | 1 | Number of BOS needed to confirm a trend change |
PositionX |
int | 20 | Trend display horizontal offset (pixels) |
PositionY |
int | 50 | Trend display vertical offset (pixels) |
PaintBars |
bool | false | Color candles based on trend direction |
BullishTrendBar |
Stroke | LimeGreen, Solid | Bullish trend candle color |
BearishTrendBar |
Stroke | Red, Solid | Bearish trend candle color |
| 02. Multi Timeframe | |||
UseMTF |
bool | false | Enable multi-timeframe mode |
MTFBarPeriodPeriodType |
BarsPeriodType | Minute | MTF timeframe period type |
MTFBarPeriodPeriodValue |
int | 15 | MTF timeframe period value |
TradingHoursInstance |
TradingHours | (instrument default) | Trading hours template for MTF data series |
MTFBarsToLoad |
int | 1000 | Number of MTF bars to load for calculation |
| 03. Swing Structure | |||
ShowSwingHighLow |
bool | true | Show strong/weak swing high/low labels |
ShowHHLL |
bool | true | Show HH/HL/LH/LL labels at swing points |
ShowFractals |
bool | false | Show fractal up/down markers |
FractalSize |
int | 4 | Bars on each side for fractal detection |
BOSDisplayType |
Enum | Text | BOS display: None / LineOnly / Text / TextAndTimeFrame |
BOSStructureMapping |
Enum | Candle_Close | Map BOS lines to candle close or wick |
NumberOfBOSToDisplay |
int | 0 | Max BOS lines to show (0 = all) |
BOSPullBackType |
Enum | ATR | Pullback measurement: ATR, Percentage, or Ticks |
BOSATRPeriod |
int | 14 | ATR period for pullback detection |
BOSATRMultiplier |
double | 2.0 | ATR multiplier for minimum pullback threshold |
BOSPullbackPercentage |
double | 30 | Minimum pullback as percentage of swing range |
BOSPullbackTicks |
double | 80 | Minimum pullback in ticks |
BOSAlert |
bool | false | Enable BOS alerts |
BOSAlertSound |
string | Alert2.wav | Sound file for BOS alerts |
BullishBOSColor |
Stroke | DodgerBlue, Solid, 2 | Bullish BOS line color and style |
BearishBOSColor |
Stroke | DodgerBlue, Solid, 2 | Bearish BOS line color and style |
BOSFont |
SimpleFont | Arial, 12 | Font for macro BOS labels |
MicroBullishBOSColor |
Stroke | DimGray, Dash, 1 | Micro bullish BOS line color and style |
MicroBearishBOSColor |
Stroke | DimGray, Dash, 1 | Micro bearish BOS line color and style |
MicroBOSFont |
SimpleFont | Arial, 10 | Font for micro BOS labels |
StrongSwingHiColor |
Stroke | White, Dash, 1 | Strong swing high line color |
StrongSwingLowColor |
Stroke | White, Dash, 1 | Strong swing low line color |
WeakSwingHiColor |
Stroke | White, Dash, 1 | Weak swing high line color |
WeakSwingLowColor |
Stroke | White, Dash, 1 | Weak swing low line color |
SwingHighLowFont |
SimpleFont | Arial, 12 | Font for swing high/low labels |
HHLLTextColor |
Stroke | White | HH/LL label text color |
HHLLFont |
SimpleFont | Arial, 12 | Font for HH/LL labels |
HHLLOffset |
int | 20 | Vertical offset in pixels for HH/LL labels |
FractalUpColor |
Stroke | Lime, Solid, 1 | Fractal up marker color |
FractalDownColor |
Stroke | Red, Solid, 1 | Fractal down marker color |
| 04. Internal Market Structure | |||
ShowInternalHighLow |
bool | true | Show internal structure high/low markers |
ChoChDisplayType |
Enum | Text | ChoCh display: None / LineOnly / Text / TextAndTimeFrame |
ChoChStructureMapping |
Enum | Candle_Close | Map ChoCh lines to candle close or wick |
NumberOfChoChToDisplay |
int | 0 | Max ChoCh lines to show (0 = all) |
ChoChAlert |
bool | false | Enable ChoCh alerts |
ChoChAlertSound |
string | Alert2.wav | Sound file for ChoCh alerts |
BullishChOfChColor |
Stroke | Orange, Solid, 2 | Bullish ChoCh line color and style |
BearishChOfChColor |
Stroke | Orange, Solid, 2 | Bearish ChoCh line color and style |
ChoChFont |
SimpleFont | Arial, 12 | Font for macro ChoCh labels |
MicroBullishChOfChColor |
Stroke | DimGray, Dash, 2 | Micro bullish ChoCh color and style |
MicroBearishChOfChColor |
Stroke | DimGray, Dash, 2 | Micro bearish ChoCh color and style |
MicroChoChFont |
SimpleFont | Arial, 10 | Font for micro ChoCh labels |
InternalHiColor |
Stroke | White, Dash, 1 | Internal high line color |
InternalLowColor |
Stroke | White, Dash, 1 | Internal low line color |
InternalHighLowFont |
SimpleFont | Arial, 12 | Font for internal high/low labels |
| 05. Supply / Demand | |||
SupplyDemandDisplayType |
Enum | None | Show zones for: None / Bos / ChoCh / Both |
ShowSupplyDemandZonesBreakerBlocks |
bool | false | Show breaker blocks when zones are broken |
HideBrokenSupplyDemandZones |
bool | true | Hide zones after they are broken |
NumberOfSDZones |
int | 3 | Max zones to display (0 = all) |
SupplyDemandType |
Enum | Wick | Zone boundary type: Candle or Wick |
SupplyDemandBreakType |
Enum | PremiumDiscount | When zones break: Wick / Close / PremiumDiscount |
SupplyBackgroundColor |
Stroke | Orange, Solid, 15% | Supply zone background |
SupplyOutlineColor |
Stroke | Orange, Solid, 100% | Supply zone outline |
DemandBackgroundColor |
Stroke | DodgerBlue, Solid, 25% | Demand zone background |
DemandOutlineColor |
Stroke | DodgerBlue, Solid, 100% | Demand zone outline |
SupplyDemandCenter |
Stroke | DimGray, Dash | Zone midline color |
BreakerSupplyBackgroundColor |
Stroke | Crimson, Solid, 15% | Breaker supply background |
BreakerSupplyOutlineColor |
Stroke | Crimson, Dash, 100% | Breaker supply outline |
BreakerDemandBackgroundColor |
Stroke | ForestGreen, Solid, 25% | Breaker demand background |
BreakerDemandOutlineColor |
Stroke | ForestGreen, Dash, 100% | Breaker demand outline |
BreakerSupplyDemandCenter |
Stroke | White, Dash | Breaker block midline color |
| 06. Fibonacci Retracements | |||
ShowFibRetracements |
bool | false | Enable Fibonacci retracement levels |
ShowFibNumbers |
bool | true | Show percentage labels on Fibonacci lines |
FibonacciType |
Enum | Normal | Display mode: Normal or Cluster |
FibRetracement1 |
double | 50 | First retracement level (%) |
FibRetracement2 |
double | 61.8 | Second retracement level (%) |
FibRetracement3 |
double | 78.6 | Third retracement level (%) |
FibRetracement4 |
double | 88.6 | Fourth retracement level (%) |
FibRetracement5 |
double | 0 | Fifth retracement level (%, 0 = disabled) |
FibRetracement6 |
double | 0 | Sixth retracement level (%, 0 = disabled) |
FibRetracement1Color |
Stroke | Crimson, Dash | Level 1 line color |
FibRetracement2Color |
Stroke | Yellow, Dash | Level 2 line color |
FibRetracement3Color |
Stroke | DodgerBlue, Dash | Level 3 line color |
FibRetracement4Color |
Stroke | Violet, Dash | Level 4 line color |
FibRetracement5Color |
Stroke | Orange, Dash | Level 5 line color |
FibRetracement6Color |
Stroke | Magenta, Dash | Level 6 line color |
FibRetracementAnchorStroke |
Stroke | DimGray, Dash | Anchor line connecting swing points |
| 07. Fair Value Gaps | |||
ShowFairValueGaps |
bool | false | Enable fair value gap detection |
MinGapTicks |
int | 5 | Minimum gap size in ticks |
NumberOfGapsToShow |
int | 3 | Max FVGs to display (0 = all) |
ShowFairValueGapBreakerBlocks |
bool | false | Show breaker blocks for broken FVGs |
BullishGapOutlineColor |
Stroke | DodgerBlue, Solid, 100% | Bullish FVG outline |
BullishGapBackgroundColor |
Stroke | DodgerBlue, Solid, 25% | Bullish FVG background |
BearishGapOutlineColor |
Stroke | Orange, Solid, 100% | Bearish FVG outline |
BearishGapBackgroundColor |
Stroke | Orange, Solid, 15% | Bearish FVG background |
FairValueGapMidlineColor |
Stroke | White, Dash, 25% | FVG midline color |
BullishGapBreakerBlockBackgroundColor |
Stroke | ForestGreen, Solid, 25% | Bullish FVG breaker background |
BullishGapBreakerBlockOutlineColor |
Stroke | ForestGreen, Dash, 100% | Bullish FVG breaker outline |
BearishGapBreakerBlockBackgroundColor |
Stroke | Crimson, Solid, 15% | Bearish FVG breaker background |
BearishGapBreakerBlockOutlineColor |
Stroke | Crimson, Dash, 100% | Bearish FVG breaker outline |
FairValueGapBreakerMidlineColor |
Stroke | White, Dash, 25% | FVG breaker midline color |
| 08. Order Blocks | |||
ShowOrderBlocks |
bool | false | Enable order block detection |
ShowOrderBlockBreakerBlocks |
bool | false | Show breaker blocks for broken order blocks |
ShowTestedOrderBlocks |
bool | true | Show order blocks that have been tested |
ShowBrokenOrderBlocks |
bool | false | Show order blocks that have been broken |
NumberOfOrderBlocksToShow |
int | 5 | Max order blocks to display (0 = all) |
MinBaseBars |
int | 1 | Minimum number of base (consolidation) bars |
MaxBaseBars |
int | 3 | Maximum number of base bars |
BaseBarMaxPercentage |
double | 50 | Maximum range of base bar as % of average |
ThrustBarMinPercentage |
double | 100 | Minimum range of thrust bar as % of average |
PaintBaseBars |
bool | true | Color the base bars on the chart |
OrderBlockDemandBackgroundColor |
Stroke | DodgerBlue, Solid, 30% | Demand block background |
OrderBlockDemandOutlineStroke |
Stroke | DodgerBlue, Solid, 100% | Demand block outline |
OrderBlockSupplyBackgroundColor |
Stroke | Indigo, Solid, 30% | Supply block background |
OrderBlockSupplyOutlineStroke |
Stroke | Indigo, Solid, 100% | Supply block outline |
OrderBlockBaseBarStroke |
Stroke | White, Dash | Base bar marker style |
OrderBlockMidlineColor |
Stroke | White, Dash | Order block midline color |
OrderBreakerBlockDemandBackgroundColor |
Stroke | ForestGreen, Solid, 30% | Demand breaker block background |
OrderBreakerBlockDemandOutlineStroke |
Stroke | ForestGreen, Solid, 100% | Demand breaker block outline |
OrderBreakerBlockSupplyBackgroundColor |
Stroke | Crimson, Solid, 30% | Supply breaker block background |
OrderBreakerBlockSupplyOutlineStroke |
Stroke | Crimson, Solid, 100% | Supply breaker block outline |
OrderBreakerBlockMidlineColor |
Stroke | White, Dash, 30% | Breaker block midline color |
| 09. Volume Profile | |||
ShowBOSVolumeProfile |
Enum | Off | Volume profile display: Off / ProfileAndLevels / LevelsOnly |
ShowBOSVolumeProfileOrderBlocks |
bool | false | Show value area high/low order blocks |
HideBOSBrokenVolumeProfileOrderBlocks |
bool | false | Hide broken VP order blocks |
NumberOfVolumeProfiles |
int | 0 | Max profiles to show (0 = all) |
ValueAreaPercentage |
double | 68 | Percentage of volume for value area |
VolumeProfileWidth |
double | 90 | Histogram width (%) |
VolumeProfileFont |
SimpleFont | Arial, 8 | VP label font |
ValueAreaStroke |
Stroke | White, Solid, 20% | Value area histogram color |
VolumeAreaStroke |
Stroke | DarkGray, Solid, 10% | Outside VA histogram color |
POCStroke |
Stroke | Yellow, Dash | Point of Control line color |
VALStroke |
Stroke | White, Dash | Value area low/high line color |
VPVALLowStroke |
Stroke | ForestGreen, Dash, 25% | VA low order block color |
VPVALHighStroke |
Stroke | Crimson, Dash, 15% | VA high order block color |
VPOutlineStroke |
Stroke | DimGray, Dash | VP order block midline color |
| 10. Equal Lows / Highs | |||
ShowEqualLowsHighs |
bool | true | Enable equal highs/lows detection |
EqualLowMaxDifference |
int | 2 | Max distance in ticks for equal levels |
EqualLowColor |
Stroke | ForestGreen, Dash | Equal low line color |
EqualHighColor |
Stroke | Crimson, Dash | Equal high line color |
EqualLowHighFont |
SimpleFont | Arial, 10 | Equal high/low label font |
| 11. Trendline Liquidity | |||
ShowTrendLineLiquidity |
bool | true | Enable trendline liquidity detection |
BullishTrendLineColor |
Stroke | ForestGreen, Dash | Bullish trendline color |
BearishTrendLineColor |
Stroke | Crimson, Dash | Bearish trendline color |
TrendLineLiquidityFont |
SimpleFont | Arial, 10 | Trendline label font |
| 12. Visual | |||
TextColor |
Stroke | White, Solid | General text color |
Font |
SimpleFont | Arial, 12 | General text font |
ButtonText |
string | "SMC" | Toolbar button text |
Video Training
Watch these videos to see TDU Market Structure in action. Learn how to configure the indicator, interpret signals, and build complete trading strategies using Smart Money Concepts.
Latest Updates
Latest Updates
Latest Updates
Training Course
Version History
v1.0.1.15+ — Added fractal detection mode, breaker blocks, trendline liquidity, equal highs/lows, micro structure
v1.0.1.12 (17-May-2023) — Fixed dropdown menu appearing multiple times after saving workspace
v1.0.1.11 (9-May-2023) — Fixed volume profile not shown or disappearing
v1.0.1.9 (30-Mar-2023) — Improved performance, fixed exception/error
v1.0.1.8 (20-Mar-2023) — Added plots for FVGs and Order Blocks, added 2 extra Fibonacci retracement levels
v1.0.1.3 (26-Oct-2022) — Fixed performance issues
v1.0.1.0 (23-Aug-2022) — BOS/ChoCh alerts in dropdown menu, structure mapping always visible, MTF trend display fix
v1.0.0.9 (8-Aug-2022) — Removed empty menu spots, added trend display position, fixed overlapping labels, added swing high/low + internal high/low plots
v1.0.0.8 (7-Aug-2022) — Enable/disable indicator from menu, timeframe on button and trend display
v1.0.0.7 (7-Aug-2022) — Added dropdown menu, fair value gaps, order blocks, trend change count, improved BOS/ChoCh detection, many color/font options
v1.0.0.3 (28-Apr-2022) — ATR/percentage/ticks pullback modes, display types, ChoCh/BOS count limits, supply/demand zone limits, Fibonacci plots
v1.0.0.2 (23-Apr-2022) — Various bugfixes
v1.0.0.1 (31-Mar-2022) — Initial release
Ready to Trade with Smart Money?
Start your free 7-day trial today. Full access to every feature — no credit card required.
Start Free Trial