

Stop Guessing Where The Market Will Turn And Trade High-Probability Setups With Automated Zones That Reveal Exactly Where Price Is Most Likely To Bounce Or Break
You Aren't Trading the Market. You're Trading Your Imagination.
Most traders don't fail because of poor execution. They fail because their support and resistance zones are entirely subjective.
You draw a box based on a few recent wicks. You take the reversal. But price plows straight through, and in hindsight, the trap was obvious—you missed the true institutional liquidity pool sitting just a few ticks away, blinded by your own hand-drawn lines.
The Support / Resistance (Supply & Demand) Indicator is built specifically to fix this fatal flaw. It continuously scans the market to identify exact historical price reactions, calculating true mathematical supply and demand zones in real-time. It doesn't rely on your bias; it relies on cold, hard touch-data.
Every zone is mapped automatically and objectively. What you see is verified institutional structure—no subjective rectangles, no missing the higher-timeframe walls, and no guessing if a breakout is real or just a trap.
You're Trading Illusions.
We Map Institutional Liquidity.
Retail traders rely on messy, subjective rectangles. Institutional algorithms rely on verifiable touch data. Stop guessing where the zones are.
Drawing By Hand Is Dead
You clutter your charts with rectangles that may or may not matter. Two traders will draw two completely different demand zones on the same chart, leading to inconsistent, emotional trading.
Trading Into Invisible Walls
You enter a perfect 1-minute setup, only to be instantly crushed because you traded directly into a 1-hour supply zone you forgot to draw. Your lack of situational awareness destroys your edge.
Verified Supply & Demand
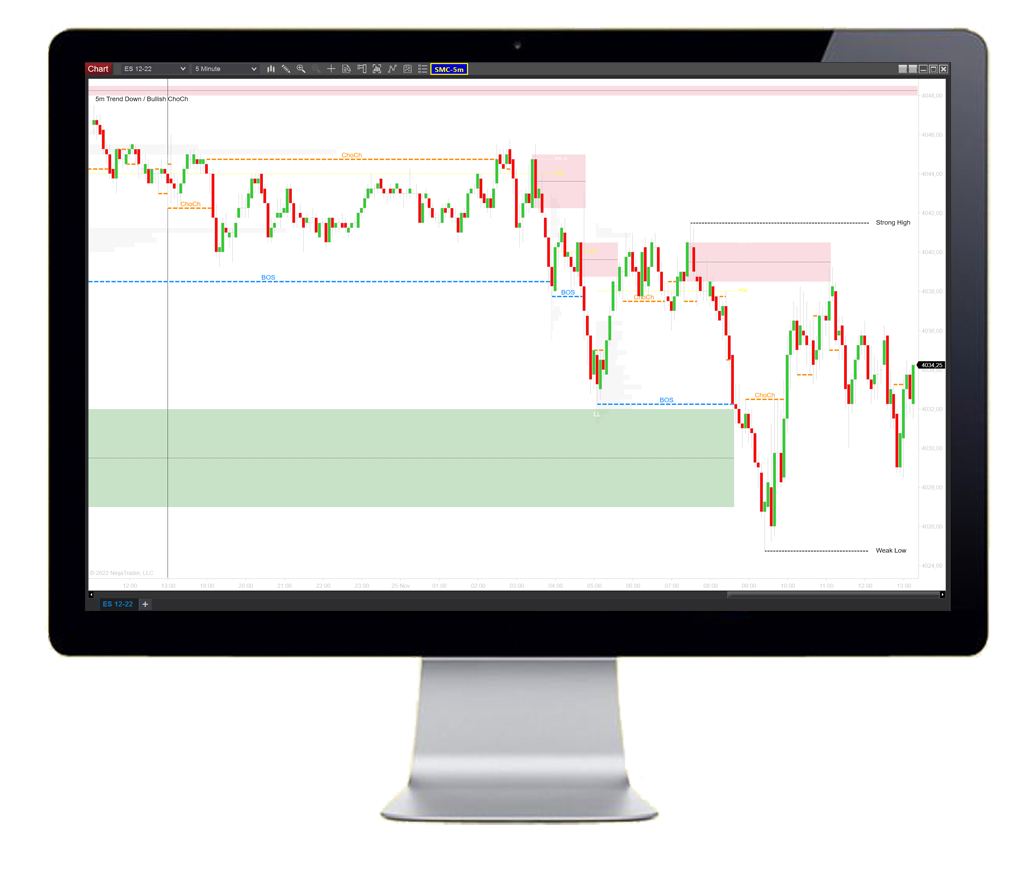
The Support & Resistance Indicator mathematically verifies and plots historical reaction zones across multiple timeframes simultaneously, ensuring you only trade high-probability levels.
Watch Once & NEVER Miss a Zone.

Raw Output: Objective Touch Verification and Mathematical Market Turns.
The Architecture Of The Indicator
Everything you need to automate your structural analysis, packed into one zero-lag C# tool.
Eliminate Chart Clutter
Stop manually updating zones. The algorithm dynamically plots active Supply and Demand regions and cleanly removes them when invalidated, so you can maintain a crystal-clear chart and focus purely on your execution strategy.
Demand Objective Verification
Track exactly how many times a zone has been tested with automated visual touch markers, so you stop taking weak trades and only risk capital when the market proves a level's historical strength.
Master Multi-Timeframe Awareness
Overlay macro support and resistance zones directly onto your micro execution chart, ensuring you never accidentally trade into a higher-timeframe brick wall and get crushed by unseen liquidity.
Automate The Edge
Built for quants. Export real-time zone data and breakout metrics directly into Bloodhound or custom NinjaScript strategies, allowing you to build emotionless execution algorithms that trade your supply and demand edges automatically, 24/7.

Catch Mathematical Second Chances.
Stop chasing price. When the market returns to a validated level, the indicator highlights the exact zone for a high-probability bounce, so you can execute mean-reversion trades with exceptionally tight, well-defined risk.
- Identify exact locations where institutional buyers defend their entries.
- Visually confirm historical retest zones.
- Tighten stops around proven mathematical boundaries.
Exploit Structural Shifts.
Old resistance becomes new support. The software tracks "broken" levels and maps their polarity shifts, ensuring you are positioned perfectly to catch the massive momentum acceleration when a ceiling becomes a floor.
- Choose between wick "pierce" or full candle close breakout logic.
- Capitalize on new trend formations the second a zone fractures.
- Stop guessing if a breakout is a trap.


Dictate Zone Calculation.
Adapt the math to your specific trading style. Toggle between Wick, Body (Close), or Average calculations to define the depth of your zones, giving you total control over how strictly or loosely you want to filter market noise.
- Use Line & Close for razor-thin, precise entry points.
- Use Wick & Average to capture broader institutional liquidity pools.
- Filter out minor price wobbles effortlessly.
See The Invisible Walls.
Execute on the 1-minute chart while seeing exactly where the 1-hour and 4-hour levels reside. The MTF engine automatically scales higher timeframe zones down to your execution chart, so you never blindly short into a macro demand level again.
- Overlay higher timeframe zones simultaneously.
- Maintain situational awareness without clicking between tabs.
- Align your micro entries with macro institutional flow.

Never Miss A Tactical Shift.
Stop burning your retinas staring at static charts. Configure precise audio alerts for when new zones form or major levels break, so you can monitor multiple assets simultaneously and reclaim your focus, knowing the system will alert you exactly when an opportunity strikes.
- Walk away from the monitors without missing a setup.
- Receive instant notification the millisecond a level fractures.
- Focus purely on order execution, not chart monitoring.
The Nerd Vault
Real-time calculation and rendering of Support/Resistance and Supply/Demand levels.
Built-in momentum indicator logic to show when the market is structurally overextended.
Custom "Left/Right" pivot settings to find significant market turns and ignore the noise.
Choose if a zone definitively breaks on a price "pierce" or requires a full candle close.
Visual dots highlight exactly how many times a historical level held firm against price.
Project and display higher-timeframe big-picture levels directly on your fast intraday charts.
For advanced quantitative traders, this indicator exports raw plot data directly into memory, ready to be digested by NinjaScript strategies or Bloodhound logic trees.
- Support/Resistance Zone Plots: Continuously outputs the exact upper and lower price boundaries of active zones.
- Touch Counter: Outputs an integer representing exactly how many times a zone has been tested by price action.
- Breakout Signal: Emits a discrete signal when a defined zone experiences a structural break.
- Polarity Shift Logic: Exposes data when an old resistance zone flips to new support, enabling instant structural awareness.
- 11-Nov-2023 (v1.0.0.0) - Initial core release of the Support / Resistance (Supply & Demand) Indicator.
Frequently Asked Questions
Everything you need to know about licensing, platform architecture, and trials.
General Info & Trials
Licensing & Billing
Platforms & Technical
Tools & Automation
Hardware & Specs
Ready to Automate Your Edges?
Stop drawing. Start executing.