
Stop Drawing Random Lines. Automatically Plot The Institutional Levels That Define The Day'S Trend Before The First Hour Is Even Over.
Morning Chop Is Slaughtering You.
Most traders don't fail because they lack a setup. They fail because they trade the morning session completely blind to institutional positioning.
You take a breakout at 9:45 AM. The momentum looks real. Then price slams into an invisible brick wall and reverses your position for a brutal loss. In hindsight, the trap was obvious—you were fighting the extreme boundary of the market's Initial Balance.
The Initial Balance & Opening Range Indicator is built specifically to map this hidden battlefield. The first 30 to 60 minutes of trading set the tone for the entire session. By precisely tracking the Premarket levels, the 30-Minute Opening Range, and the 60-Minute Initial Balance, you instantly see where the "big money" is staking its ground.
When you know exactly where the institutional boundaries are drawn, you stop getting chopped up in the morning noise. You fade the extreme edges, and you ride the mathematical extensions. Stop trading blindly into the buzzsaw.
You're Trading Illusions.
We Map The Institutional Blueprint.
Retail traders guess at direction based on lagging indicators. Professionals wait for the first hour to print, and then execute around validated boundaries.
Getting Chopped Early
You enter the market right after the bell, getting whipped back and forth by high-frequency volume. You burn through your daily loss limit before the true trend of the day is even established.
Fading The Wrong Move
You try to short a massive rally, unaware that price just shattered the Initial Balance boundary. What you thought was resistance was actually the launchpad for an aggressive 200% trend extension.
Algorithmic Boundaries
Our software automatically frames the session. It renders precise Opening Range and Initial Balance zones, along with mathematical extensions, so you only execute when the odds are heavily stacked in your favor.
Understand the Market Open.

Raw Output: Price action cleanly respecting the automated 100% IB Extension boundary.
The Architecture Of The Indicator
Everything you need to map institutional positioning, packed into one zero-lag tool.
Track Institutional Footprints
Identify the exact high and low boundaries forged in the premarket and opening 60 minutes, so that you can stop fighting the tape and start trading in harmony with smart money positioning.
Predict Exhaustion Targets
Automatically plot highly accurate 100% to 600% Initial Balance extension levels the moment the session breaks out, so that you know exactly where a runaway trend is mathematically likely to reverse or stall.
Eliminate Morning Guesswork
Stop manually drawing lines that become obsolete five minutes later. Customize your specific market session times, and the algorithm handles the rest dynamically, so that you never miss a critical support or resistance boundary during peak volatility.
Automate Your Edge
Every plot and boundary line is exposed via data outputs natively compatible with advanced trading systems and Algo Studio Pro, so that your automated strategies can execute flawlessly based on true session structure.
Define The Morning Battlefield.
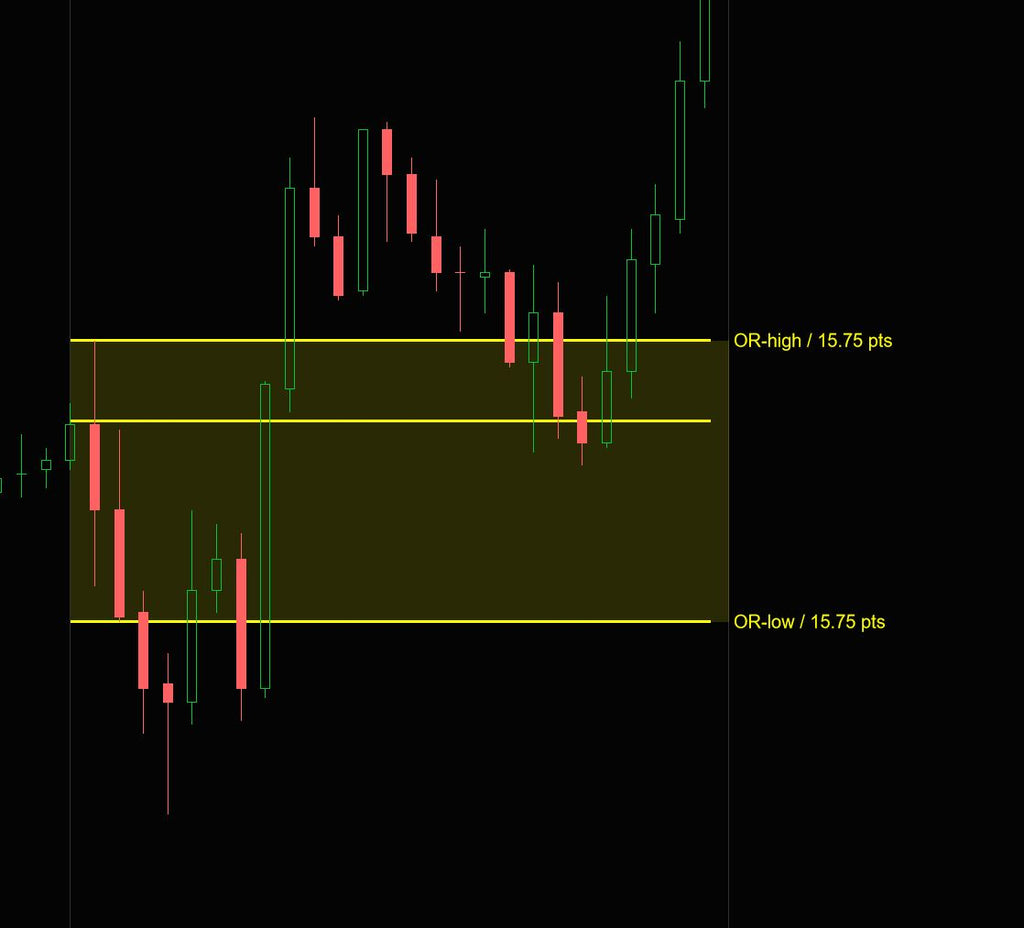
The Opening Range is the price "box" created in the vital first 30 minutes. Stop guessing if the day will be trending or range-bound. By mapping this core zone instantly, you can spot trap zones early and only execute when price definitively breaks free from the morning chop.
- Visualize the exact 30-minute highs and lows.
- Use optional background shading for instant market phase recognition.
- Protect capital by staying flat inside heavy chop zones.
Map Institutional Boundaries.
The Initial Balance shows you the true range established by institutional players in the first hour before the rest of the day unfolds. Capitalize on high-probability reversal zones by trading fading setups directly off these proven, algorithmic boundaries.
- Track where the "big money" establishes support.
- Pinpoint structural ceilings where early rallies die.
- Works universally across Futures, Forex, Crypto, and Stocks.


Project Exhaustion Targets.
When the market inevitably shatters the Initial Balance, it moves in predictable, calculated distances. The indicator dynamically renders these "extensions" ahead of time, giving you precise target levels so you know exactly where to take profits before the market pulls back.
- Automatically plots 100% to 400% price target zones.
- Identify where explosive trend days will hit a wall.
- Remove the emotion from your trade management and take-profit decisions.
The Nerd Vault
Draws premarket, session, and opening ranges seamlessly as price action develops.
Automatically calculates and plots 100% to 600% mathematical price targets.
Define precise start and end times tailored exactly to your specific traded market.
Toggle optional background shading to instantly recognize distinct market phases.
Engineered to work flawlessly on Futures, Forex, Crypto, and Stocks.
Functions completely independent of timeframe: works on Tick, Renko, Volume, and Time charts.
For quantitative and algorithmic traders, this indicator is built to be a silent workhorse. It continuously exports its critical calculated levels directly to memory, ready to be digested by your automated execution tools.
- Strategy Support: Includes clean, stable data outputs natively built for use with automated trading systems.
- Algo Studio Pro Ready: 100% fully integrated with Algo Studio Pro for seamless, no-code genetic algorithm testing and automated strategy execution based on IB and OR boundaries.
- 06-jun-2025 (v1.0.0.1) - First major release deployed to the Quantower platform architecture.
Frequently Asked Questions
Everything you need to know about licensing, platform architecture, and trials.
General Info & Trials
Licensing & Billing
Platforms & Technical
Tools & Automation
Hardware & Specs
Ready to Automate Your Edges?
Stop drawing. Start executing.