Volume Profile Indicator Full Documentation
The Best Volume Profile Indicator for NinjaTrader 8
See where the real volume sits. The most advanced volume profile indicator on the market — with auto profile splitting, HVN/LVN detection, TPO overlay, day-type classification, naked POC tracking, Initial Balance, single prints, and 22 exportable plots for your strategies.

Stop guessing where support and resistance are. This indicator shows you exactly where volume was traded — by price level, by session, with full buyer/seller breakdown. See the POC, Value Area, VWAP, high and low volume nodes, and the profile shape — all updating in real time. Whether you're scalping 5-minute bars or building swing trade levels from weekly profiles, this is the volume profile tool that professional NinjaTrader traders reach for.
1. Video Overview
See the indicator in action. Watch how it renders on live NinjaTrader 8 charts, switch between profile types and color modes, and use the key levels for real trading decisions.
Product Overview
Feature Deep Dive
2. Why Traders Choose This Indicator
A standard volume bar tells you how much was traded on a candle. The volume profile tells you where. It breaks down each session's volume by price level — revealing exactly where buyers and sellers were most active. That's the difference between watching the scoreboard and watching the game.
◈ Find Support & Resistance That Actually Works
High-volume price levels act as magnets. Price slows down, consolidates, or reverses at these levels because that's where the most trading interest exists. Low-volume areas? Price accelerates through them. The profile shows you both — so you know where to trade and where to avoid.
◈ Know Who's In Control — Buyers or Sellers
With Buy/Sell and Delta color modes, every price level in the profile is colored by who dominated — aggressive buyers or aggressive sellers. Instantly see the directional story behind the volume distribution. This isn't just structure — it's order flow context.
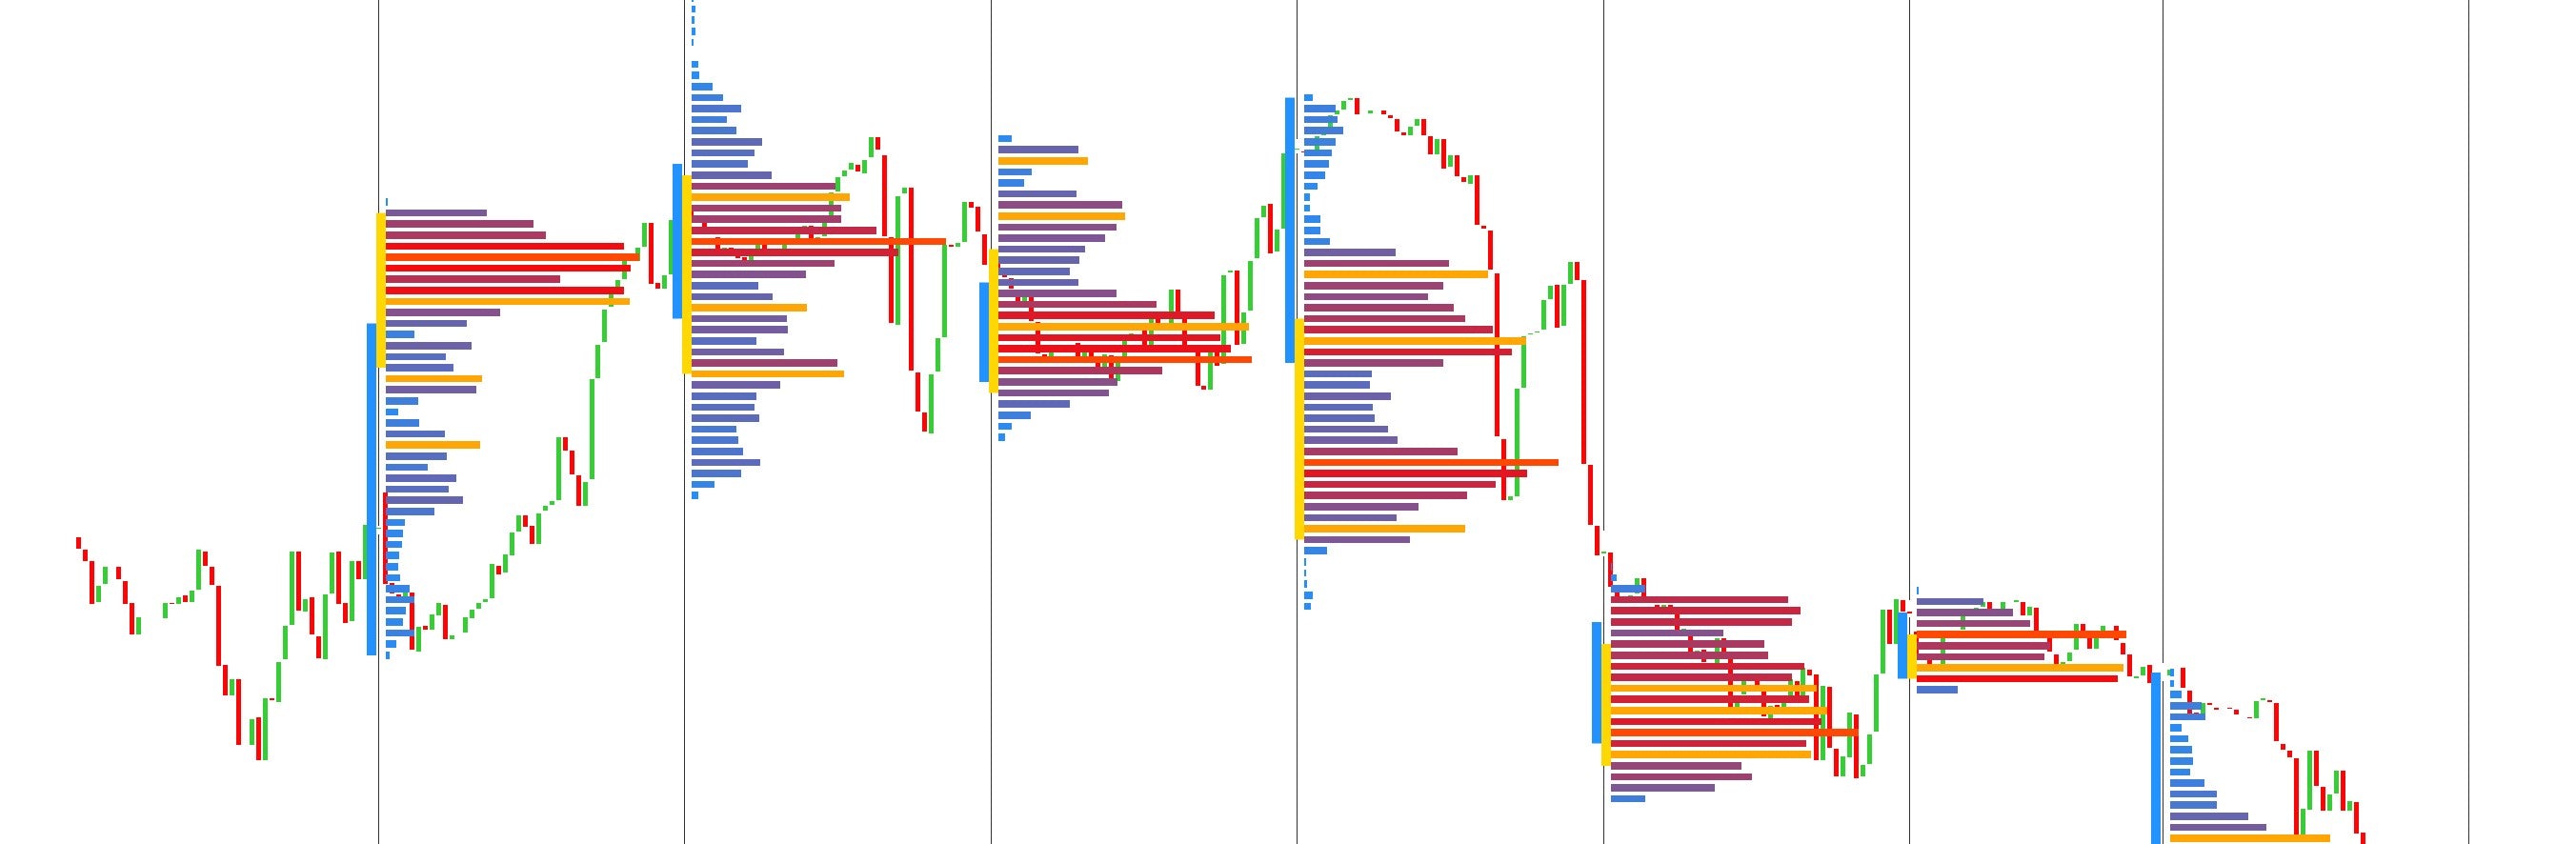
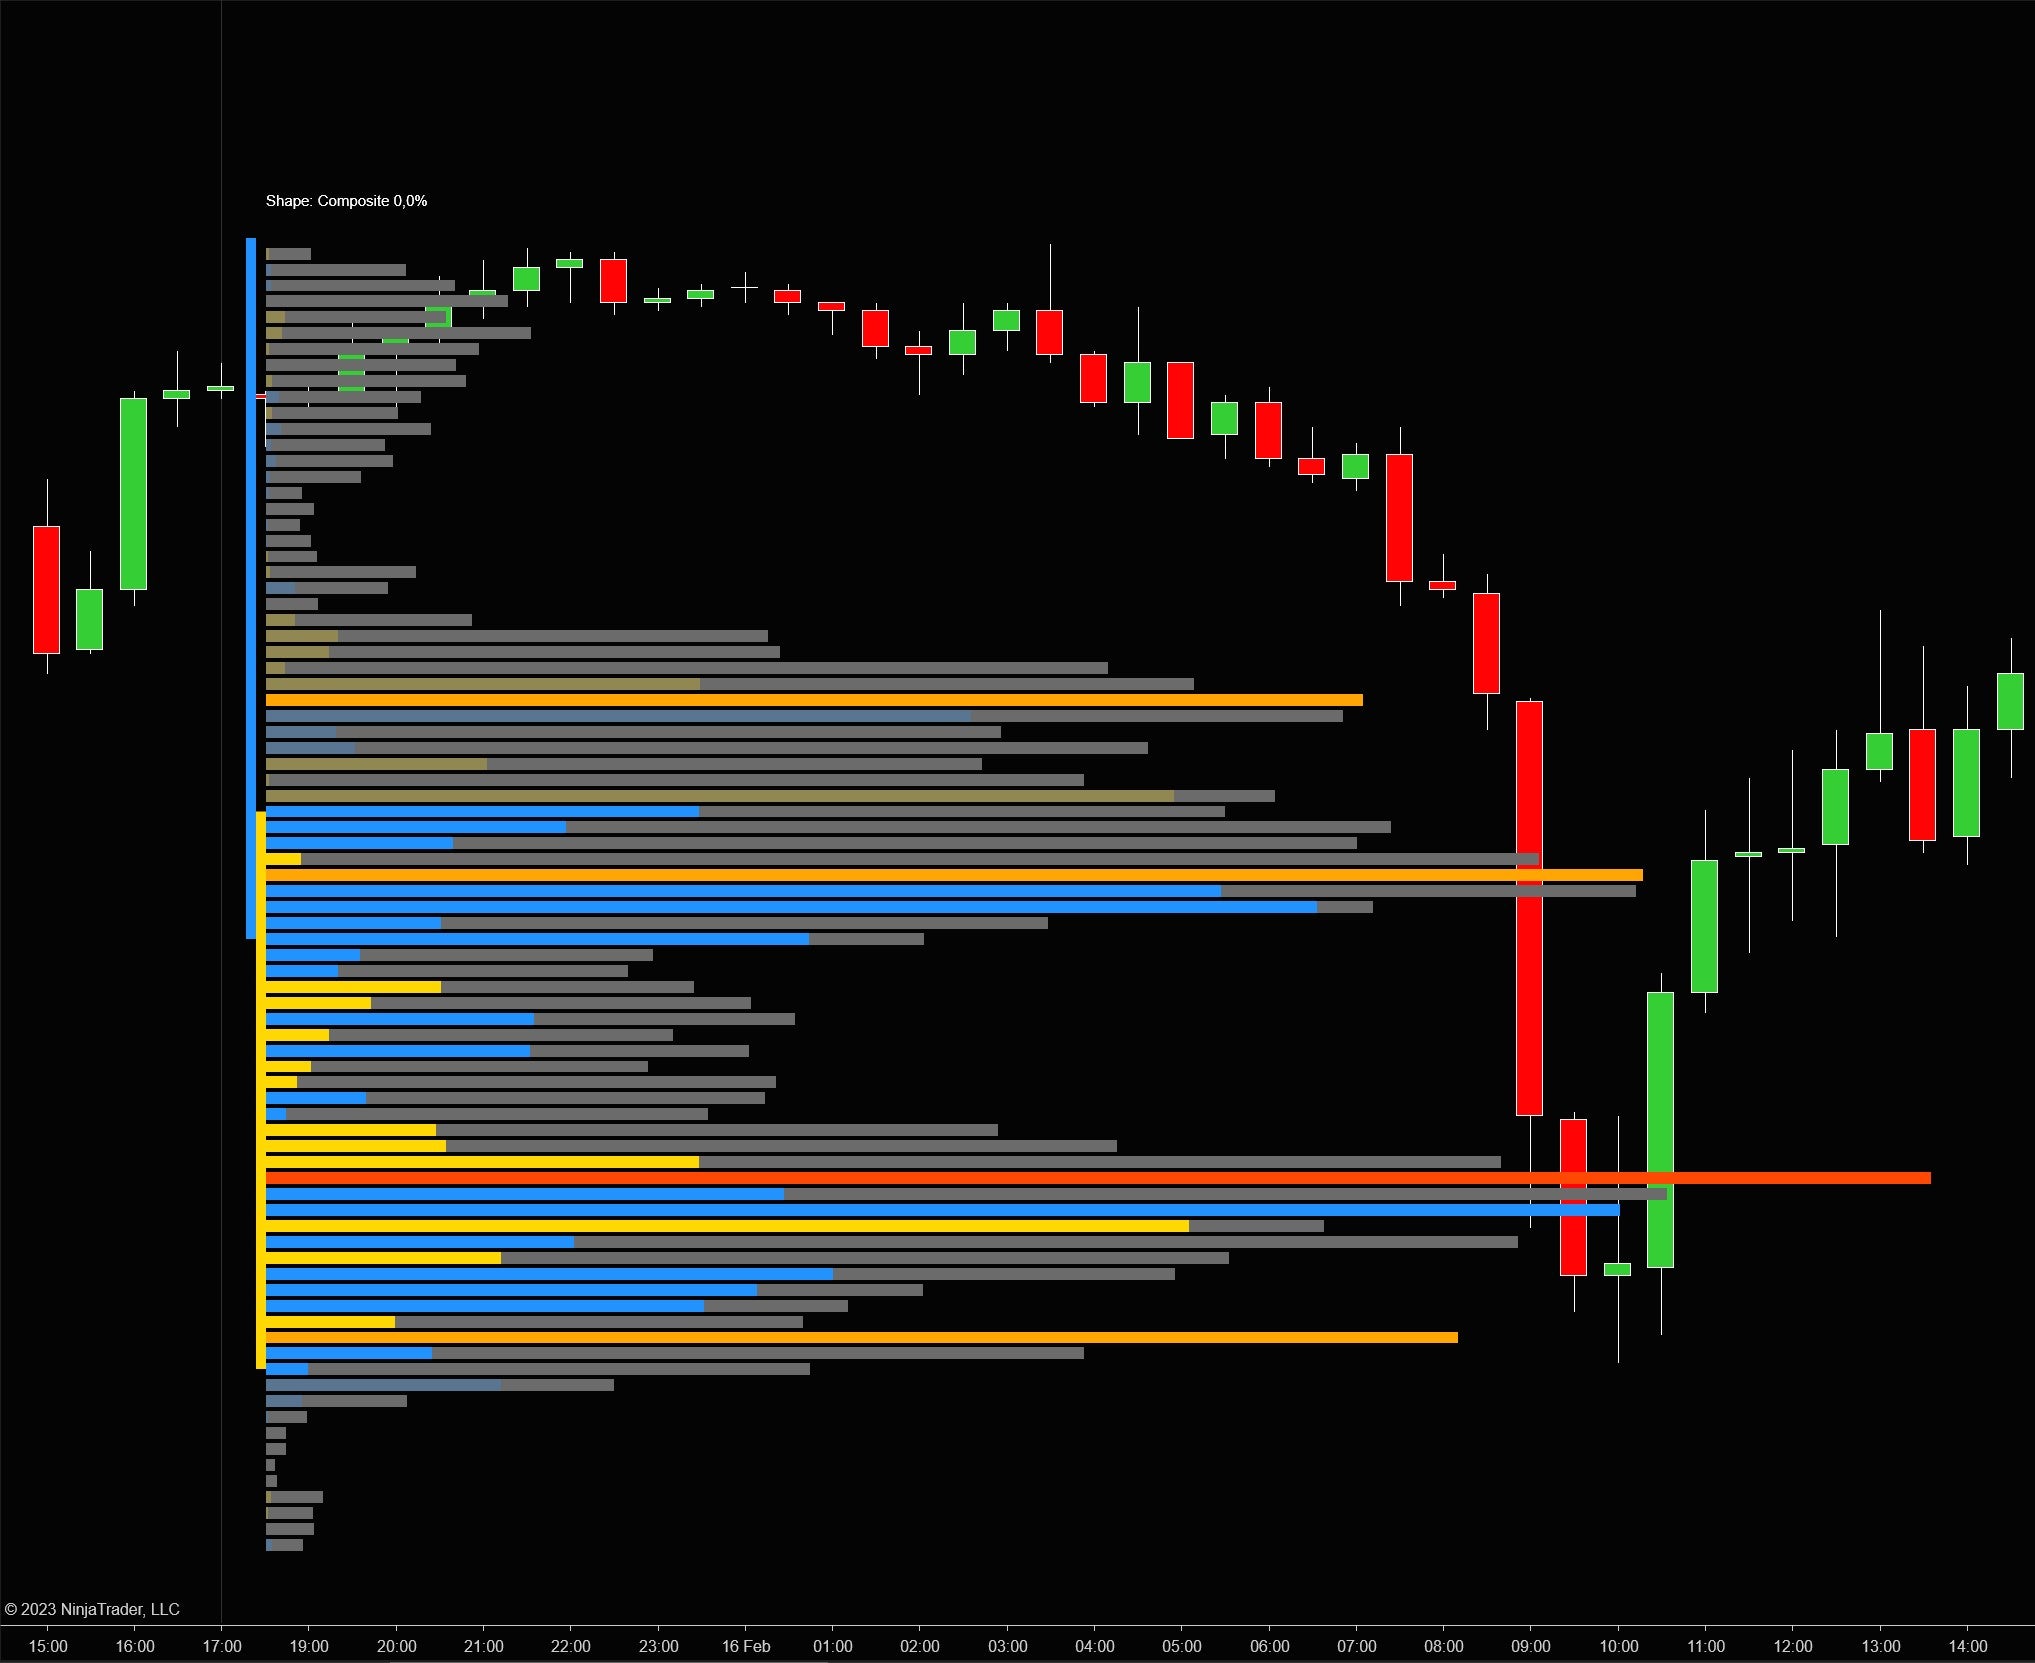
◈ Auto-Split Composite Profiles
When the market shifts value during a session (morning range vs. afternoon breakout), a single profile gives you a misleading picture. Our indicator automatically detects composite shapes and splits them into sub-profiles, each with its own POC and Value Area. No other NinjaTrader volume profile does this.
◈ Build Strategies on Volume Profile Data
28 exportable NinjaScript plots give you programmatic access to every key level — POC, VAH, VAL, VWAP, HVN/LVN prices, TPO levels, developing-trace series, and Initial Balance high/low — for both the current and previous session. Use them in AlgoStudio Pro, Market Analyzer, or your own custom strategies.
Volume Profile Gives You the Edge
- Identify support & resistance by volume — not by arbitrary lines or lagging indicators. High-volume levels are where the market actually found agreement.
- Find breakout zones before they trigger — Low Volume Nodes are thin-air zones. When price enters one, it accelerates. Know where these are before the move.
- Read market sentiment from the shape — A bell curve (B-shape) means balance. A P-shape means buyers drove price up from lows. A D-shape means sellers pushed it down. The profile tells you the story.
- Know fair value at a glance — The POC is where the most volume traded — it's fair value. VWAP is the volume-weighted average cost. These are the levels institutions watch.
3. Ten Profile Types — Every Timeframe Covered
Choose how the volume data is grouped. By trading session? By custom time window? By bar count? Across a custom date range? A rolling N-day window? By what's visible on your screen? Switch instantly from the chart toolbar.
Each profile gets its own POC, Value Area, VWAP, HVN/LVN detection, and pivot lines.
Daily Session
A fresh volume profile for each trading day. The most popular choice for intraday traders. See where today's volume is concentrating and use yesterday's levels as support and resistance.
Trade it: Yesterday's POC is a magnet. Yesterday's VAH/VAL are natural reversal zones. A break outside yesterday's value area signals a potential trend day.
Weekly Session
An entire week of volume aggregated into one profile. Smooths out daily noise and reveals the dominant price levels for the week.
Trade it: Weekly POC + daily POC at the same price = high-confidence level. Weekly profiles are perfect for swing trade planning.

Monthly Session
One profile per calendar month. The big picture view. Monthly profiles reveal structural levels built over weeks of trading — the levels that drive the largest moves.
Trade it: When price deviates far from the monthly POC, mean-reversion setups are attractive. Monthly VAH/VAL mark institutional interest zones.
Custom Session (Up to 5)
Define up to 5 custom time windows per day with start and end times. Build profiles for the Asian session, the European open, the US cash session, the close — whatever matters to your strategy.
Trade it: Compare overnight vs. regular session volume. Levels where session profiles overlap are especially strong.
Fixed Interval
Automatically divides each session into equal-duration time blocks. Set the start time, end time, and duration in minutes. Watch how volume distribution evolves as the session progresses.
Trade it: A POC that shifts higher across consecutive intervals confirms an uptrend. Compare morning vs. afternoon blocks to anticipate the close.

Visible Range
A single dynamic profile for everything visible on your chart. Scroll or zoom and the profile recalculates automatically. Zero configuration — instant analysis of whatever you're looking at.
Trade it: Zoom into a range, a pullback, or a breakout and instantly see where volume concentrated. Perfect for quick ad-hoc analysis.

Every X Bars
A new profile every N bars. Works on any bar type — time, range, Renko, tick. Set it to 6 bars on a 5-minute chart for 30-minute profiles, or 12 for 60-minute profiles.
Trade it: Ideal for range/Renko traders who can't use time-based sessions. Get rolling volume profiles on any bar type.
All Bars
One massive profile spanning all loaded data. The ultimate macro view showing where volume concentrated across your entire chart. The all-bars POC is the ultimate fair value reference.
Trade it: Price above the all-bars POC = long-term bullish bias. Below it = bearish. Use the all-bars VAH/VAL as macro range boundaries.
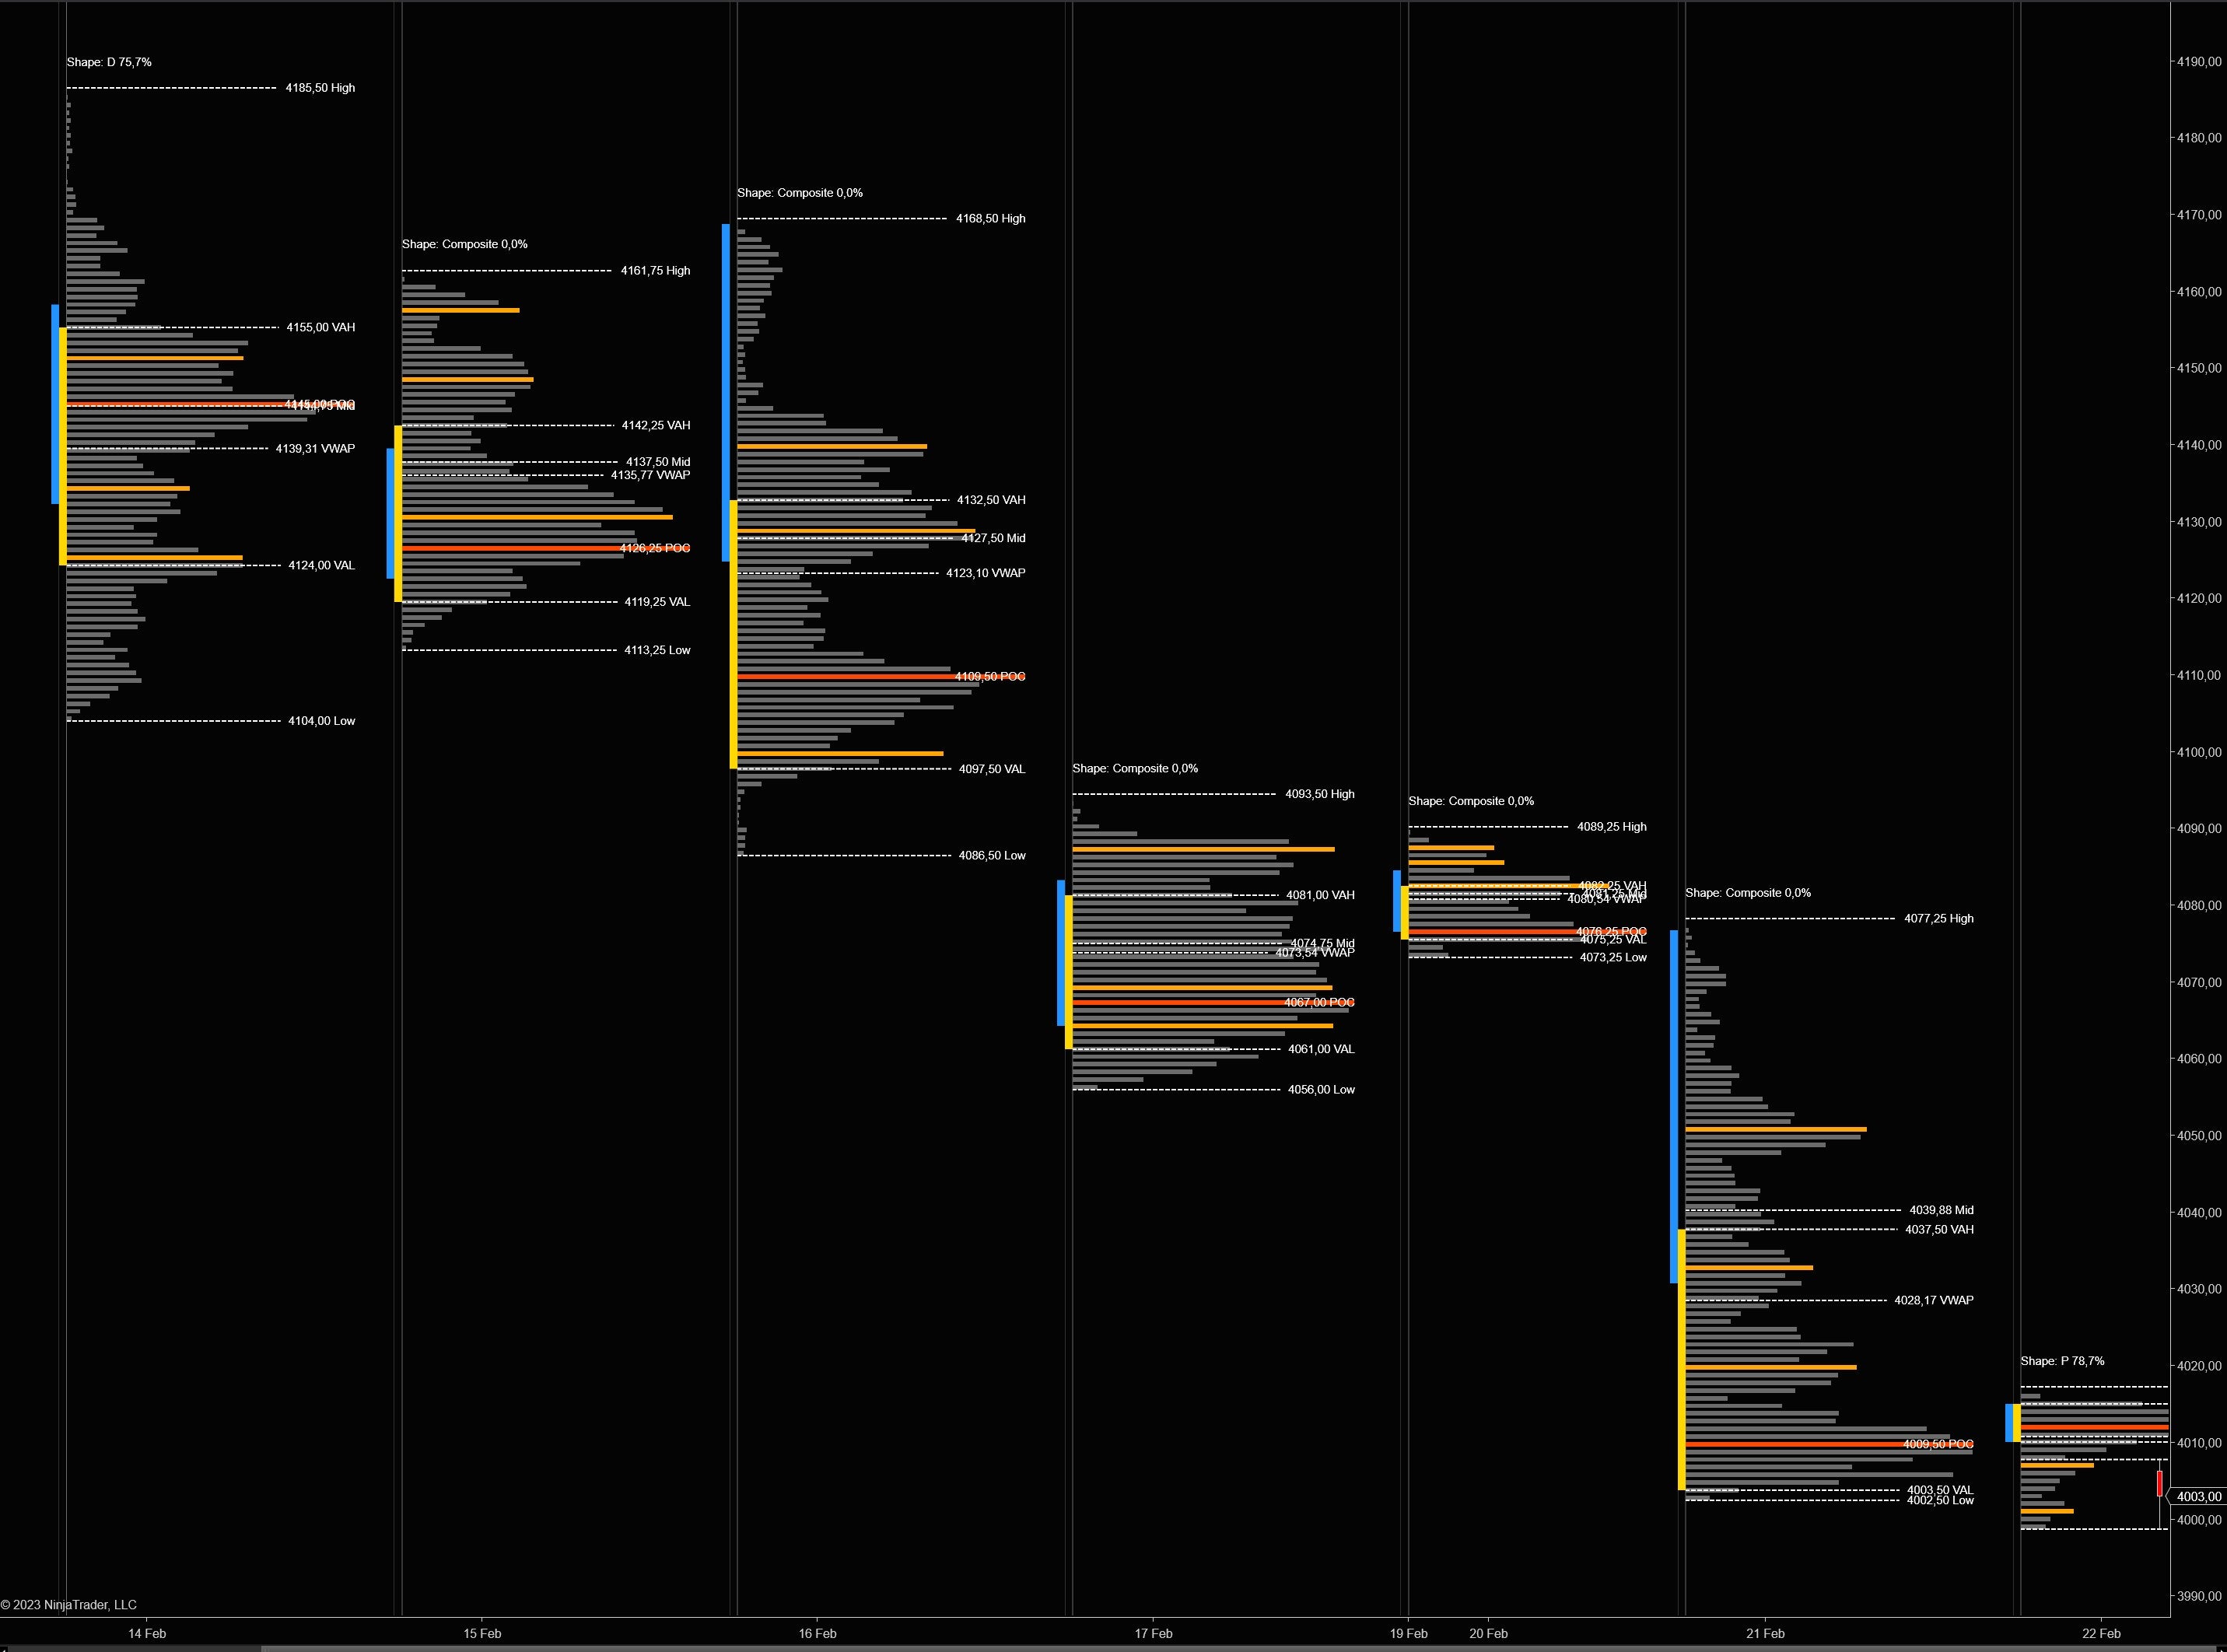
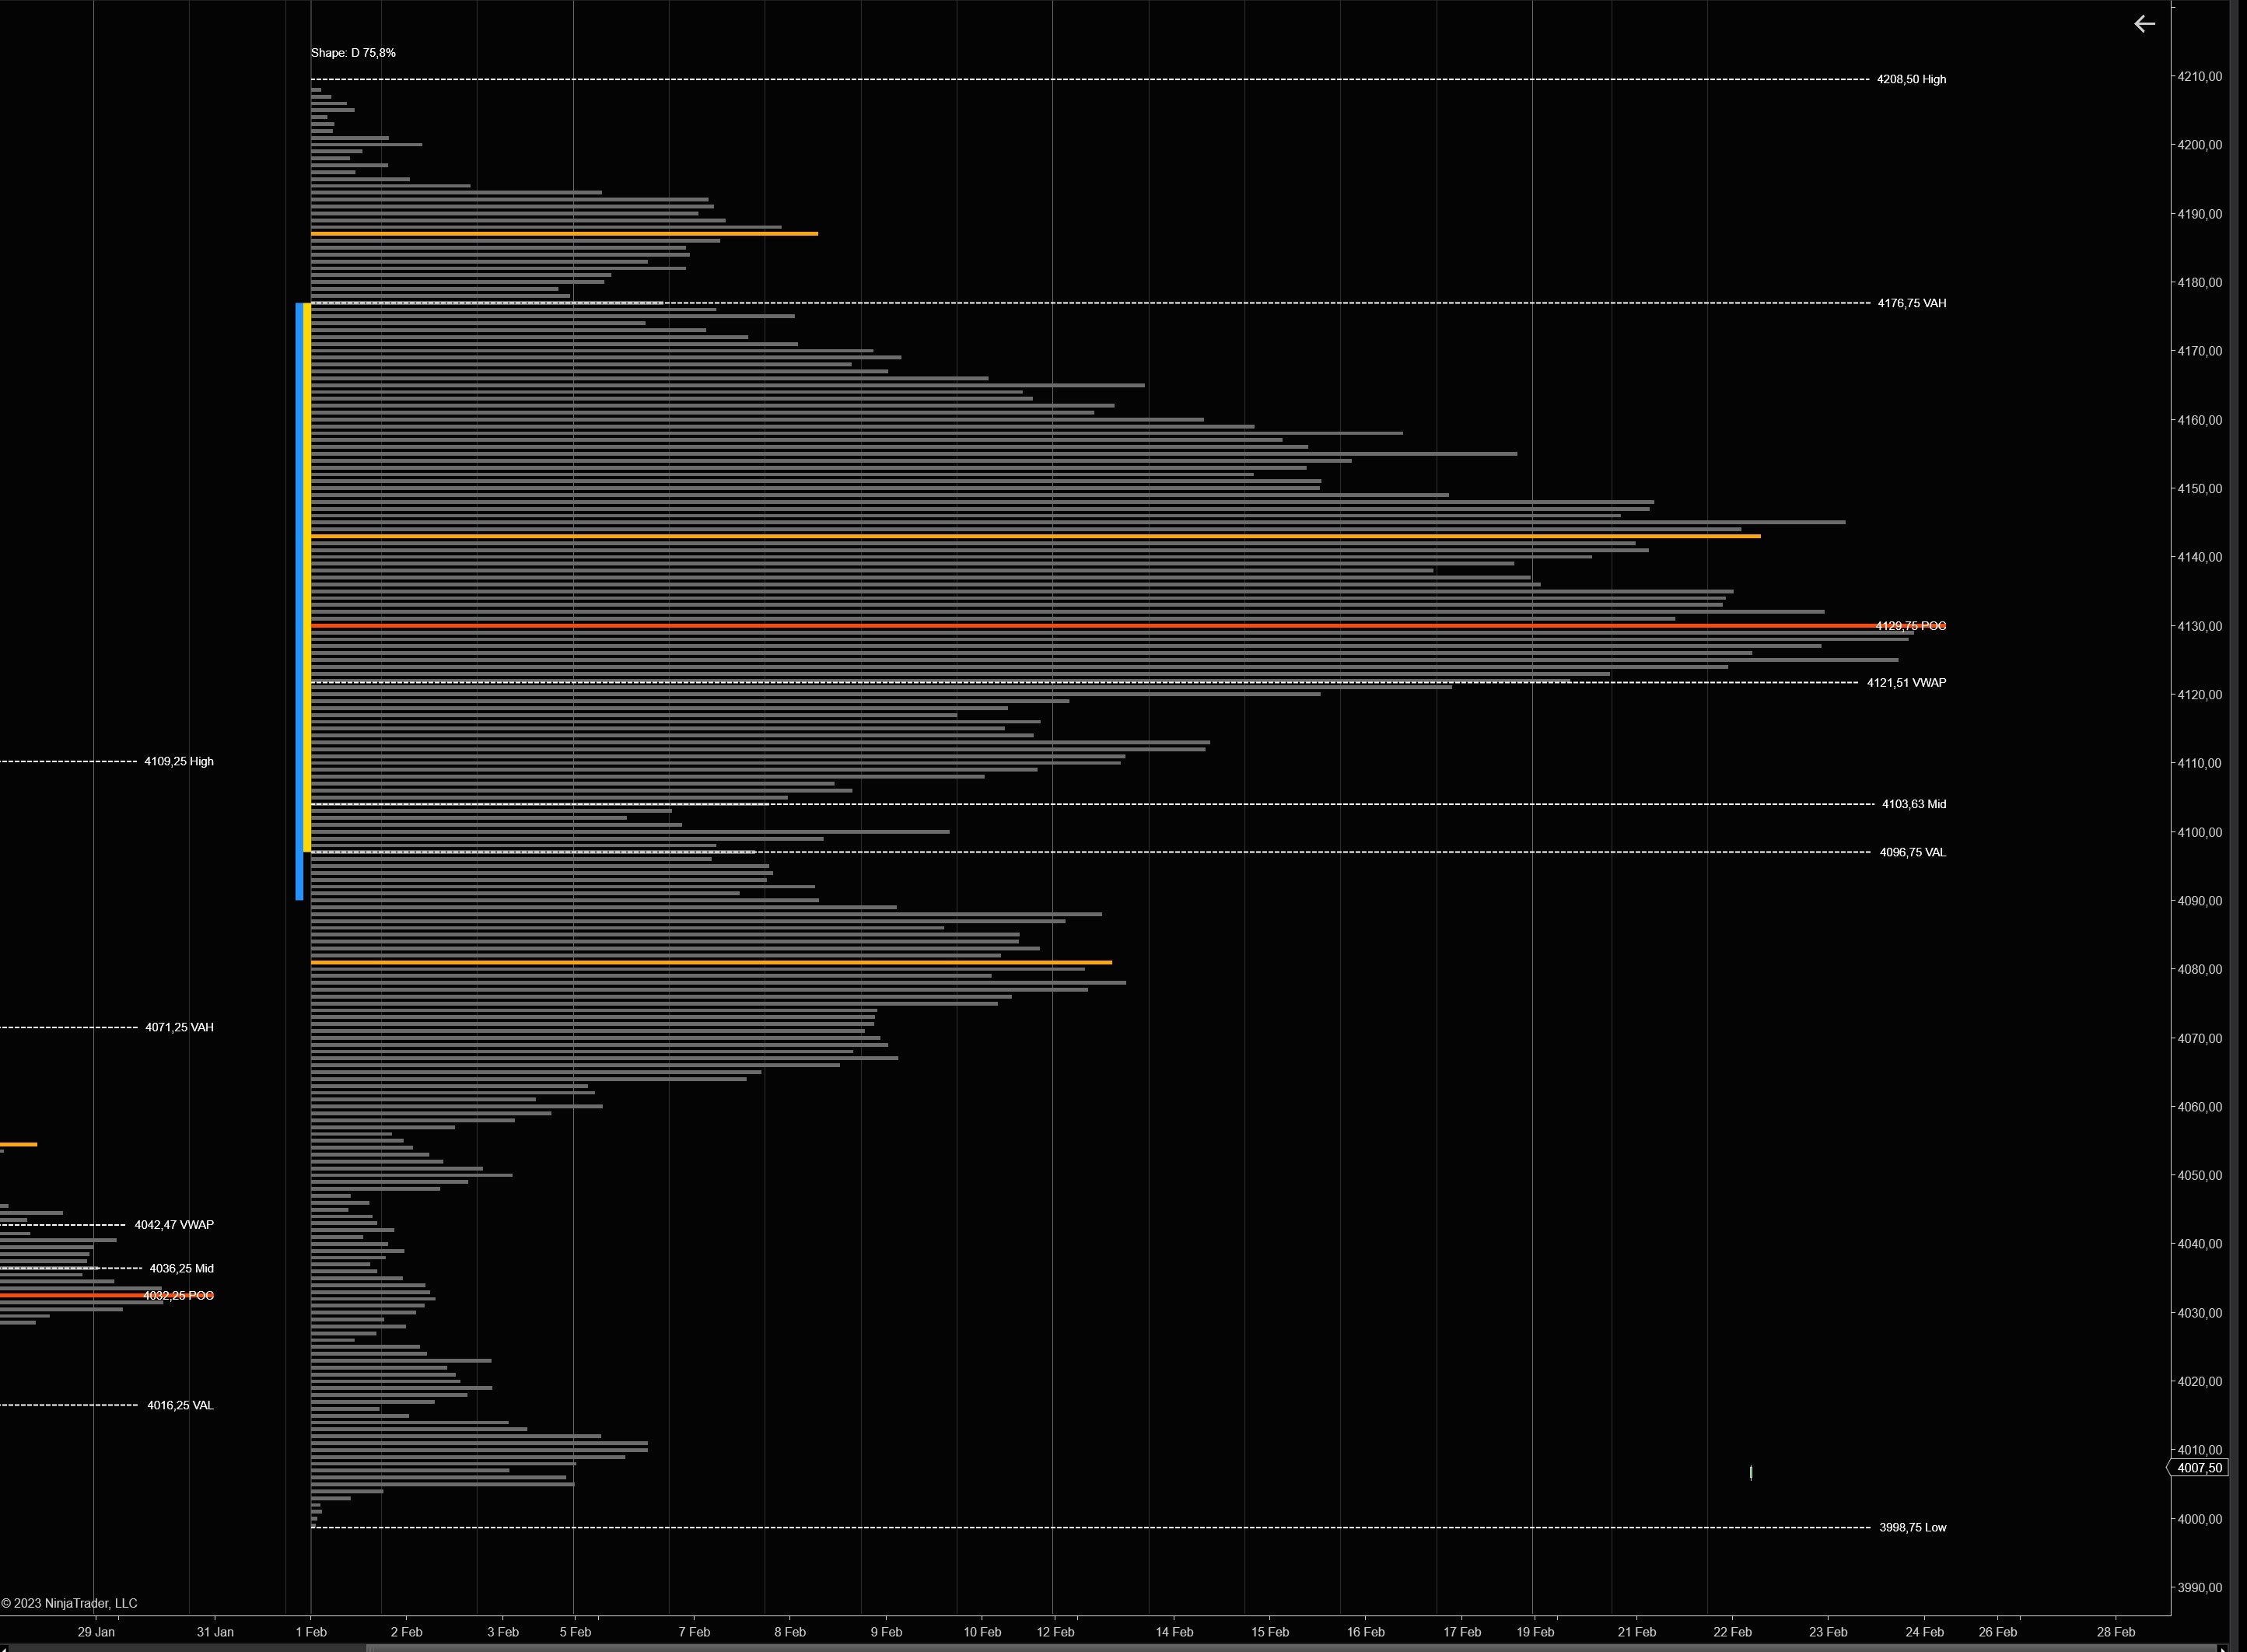
Composite Date Range NEW
Pick any two dates and get a single composite profile aggregating every tick of volume in that window. Earnings cycles, FOMC weeks, the week of a CPI print, the entire Q1 — define the period that matters and study where the market actually traded.
Trade it: The composite POC across an event window is the institutional anchor for that regime. Levels where the composite VAH/VAL align with current daily levels are exceptionally strong.
Rolling N Days NEW
An always-current macro profile covering the last N trading days. Set N (default 5) and the profile rolls forward each day — yesterday drops off, today gets added. Perfect for short-cycle institutional fair value.
Trade it: The rolling-5 POC is "the level the market keeps coming back to this week." Use it as a bias filter: above = bullish, below = bearish. Combine with daily levels for high-confidence setups.
Number of previous profiles to show setting to limit how many profiles render. Set to 0 for all, or a number like 3–5 to keep things fast and focused. Composite and Rolling-N modes always render a single profile, so they remain fast on any timeframe.4. Five Color Modes — See What Matters
The color mode determines what each volume bar tells you at a glance. From clean monochrome to full delta visualization, pick the view that matches your trading style.
Mono
Clean, single-color profile. No directional information — just pure volume distribution shape. The minimalist's choice. Great for shape analysis and screenshots.

Heatmap
Volume intensity as a smooth color gradient — from cool (low volume) to hot (high volume). The profile becomes a thermal image of activity. Instantly spot the "hot zones" where traders are most active.
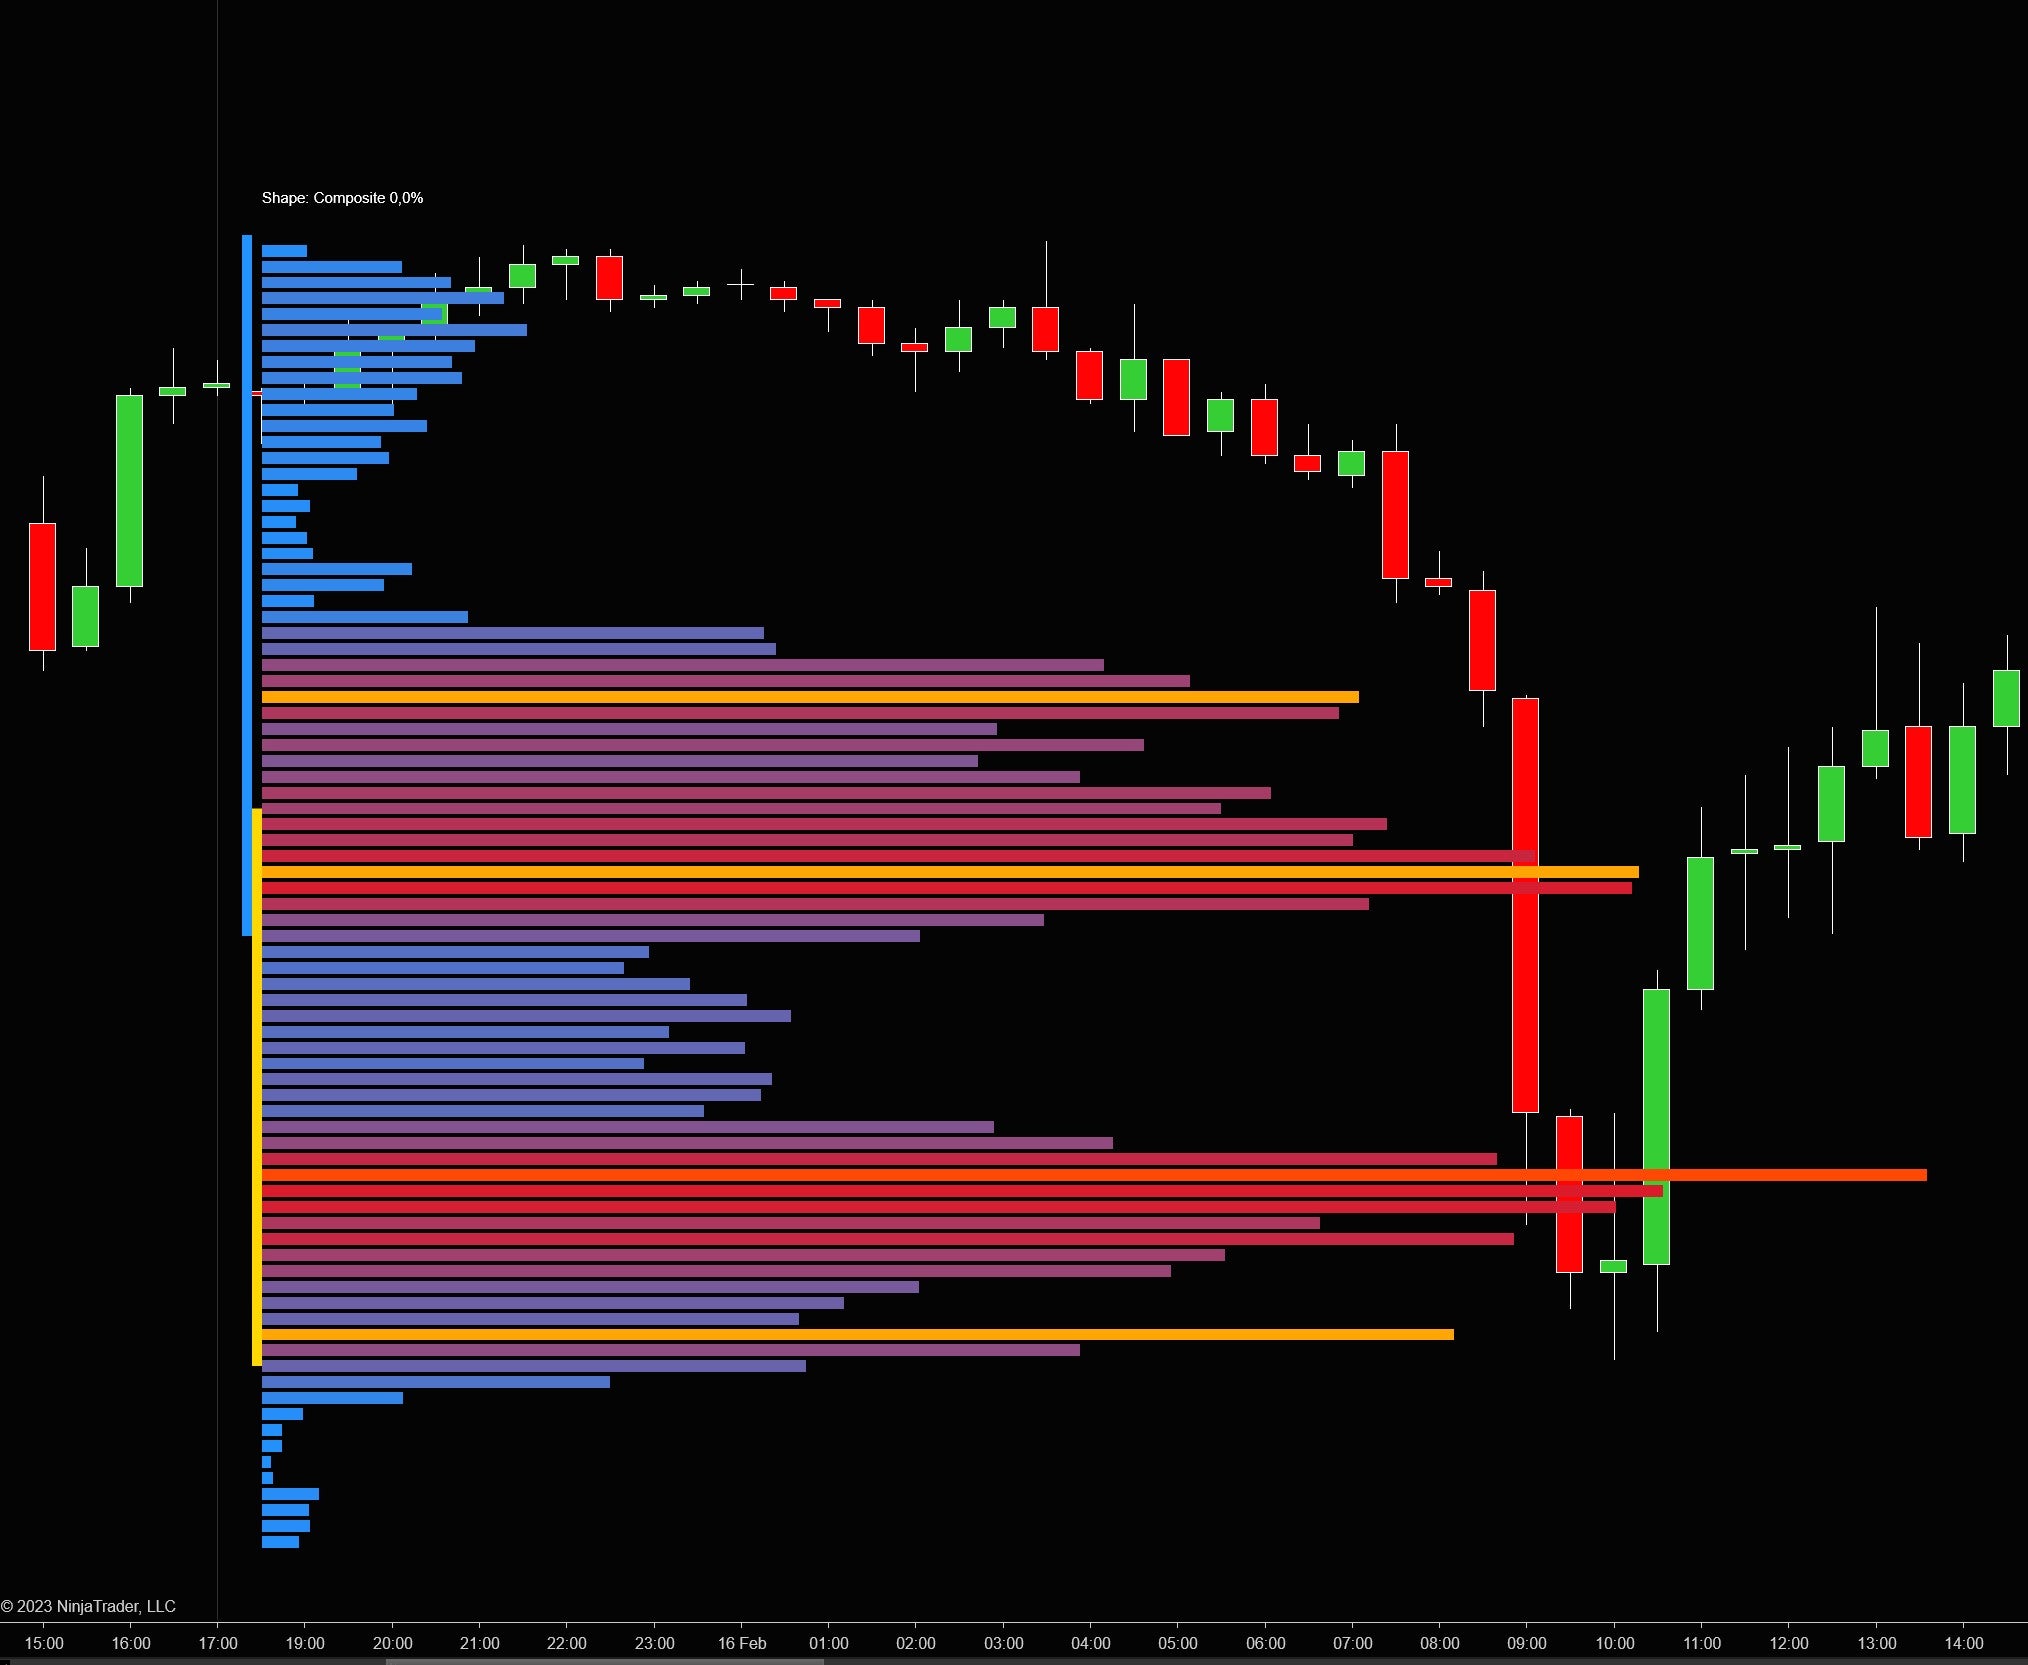
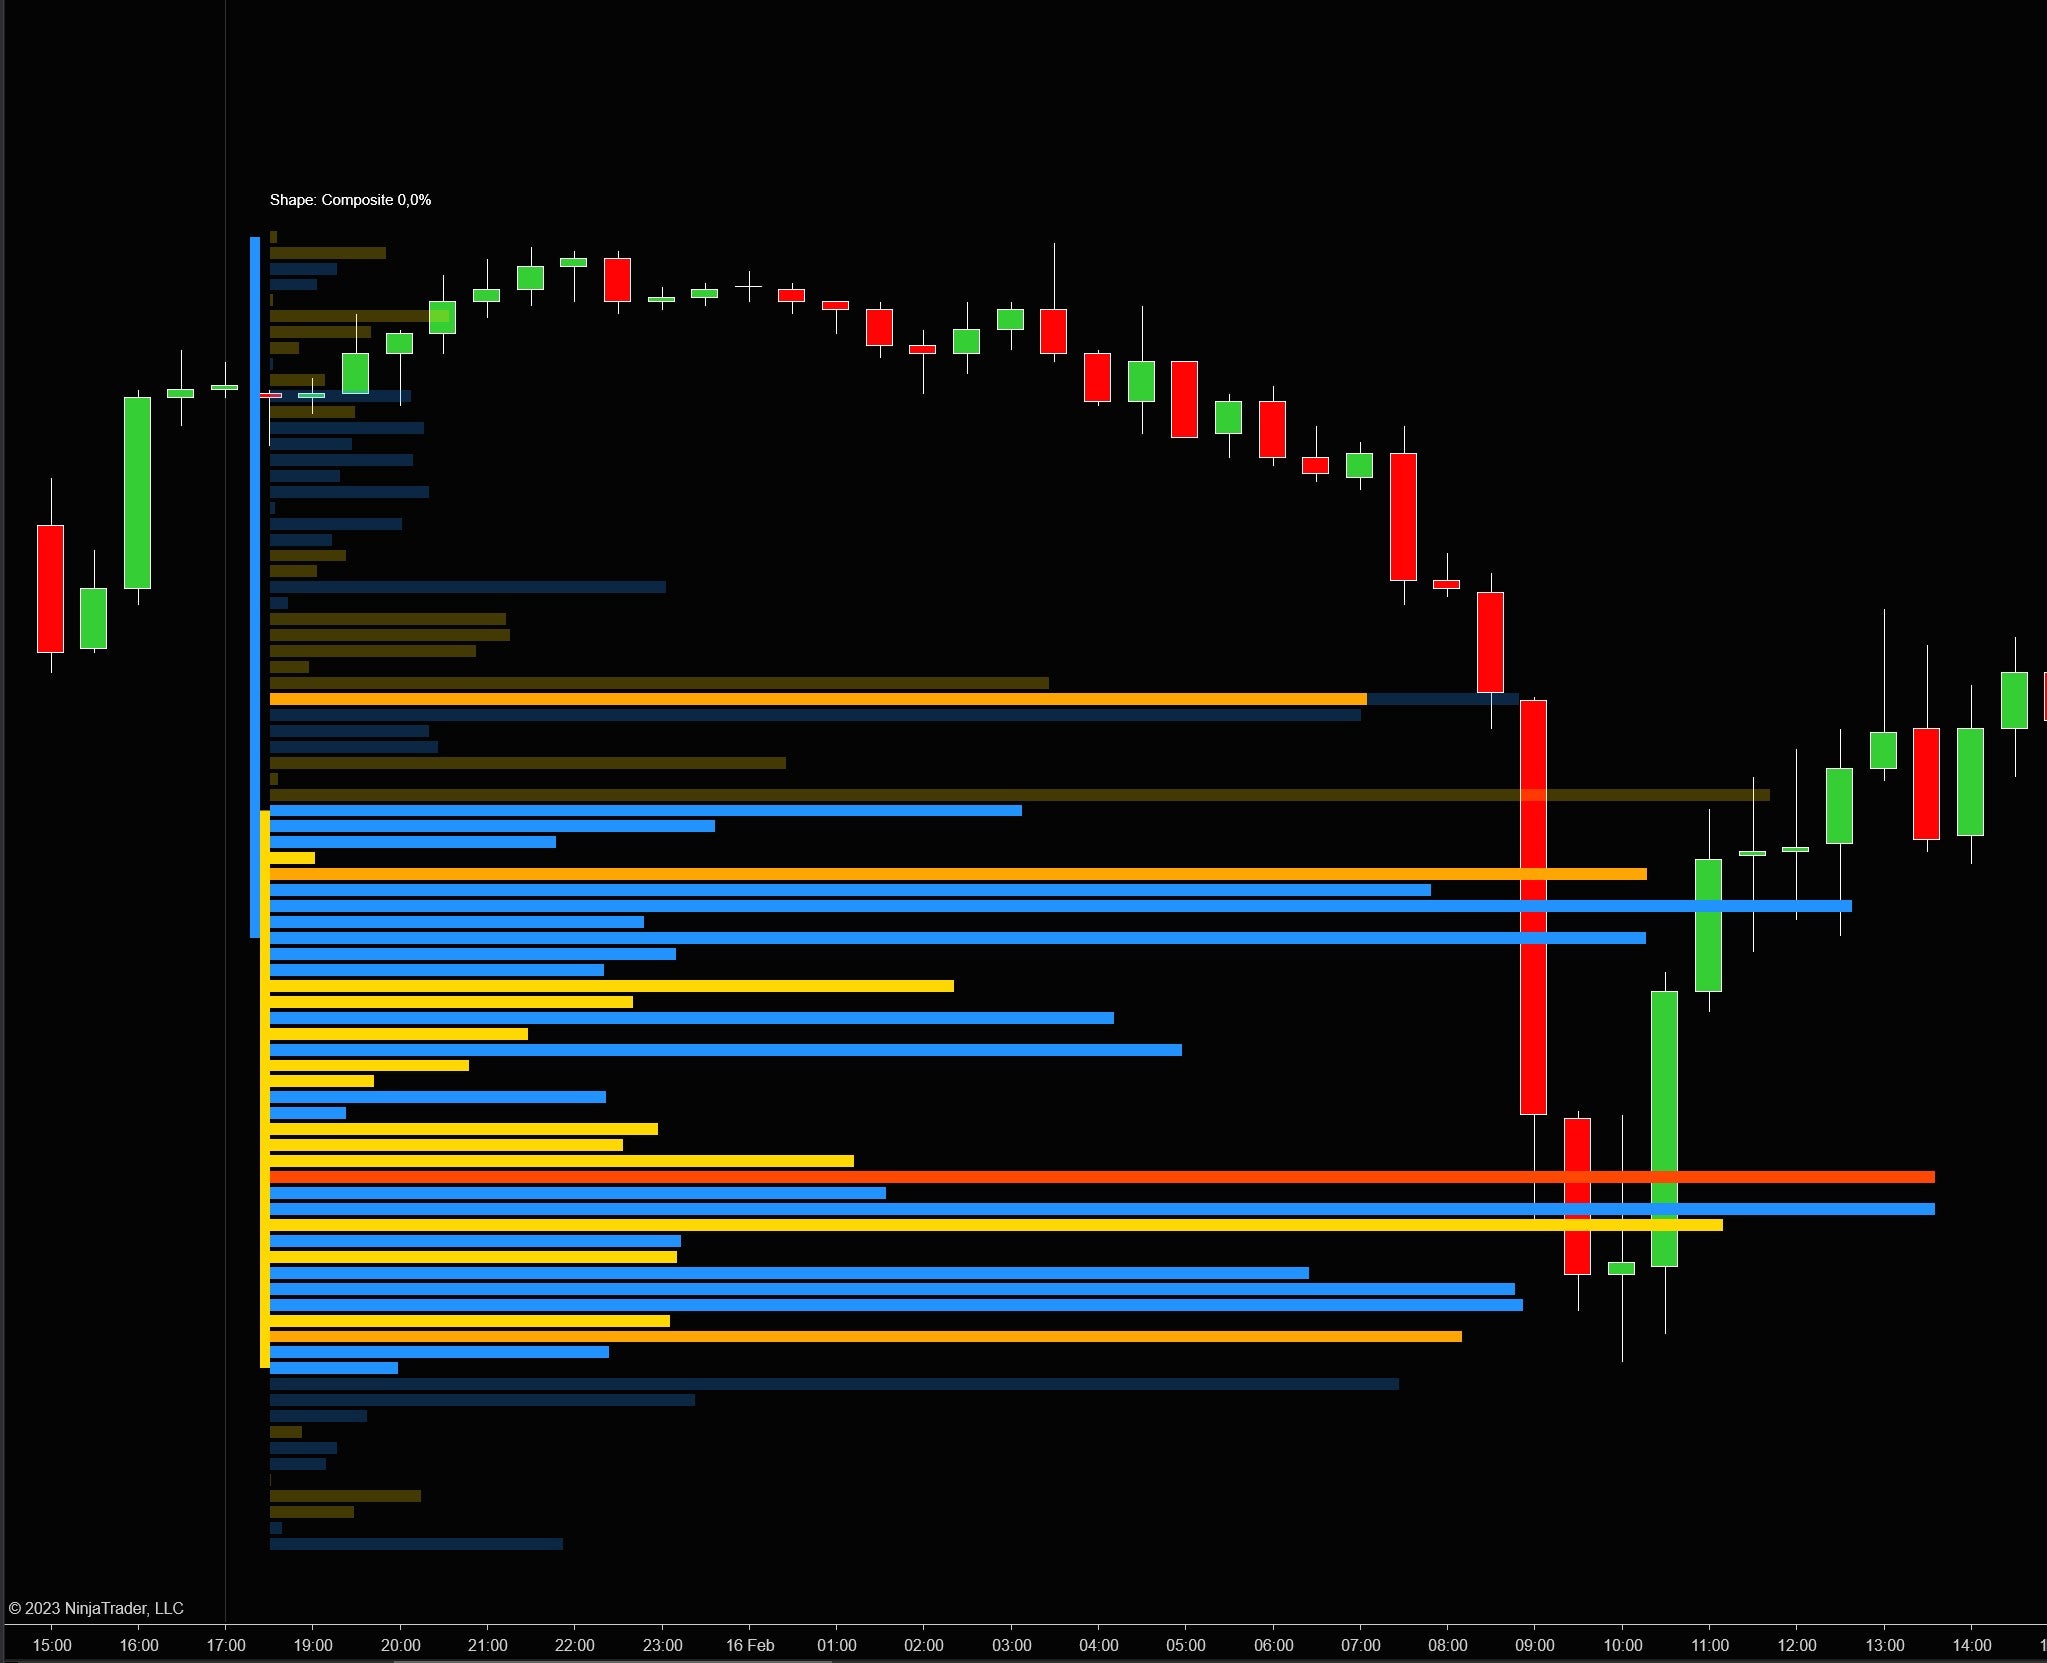
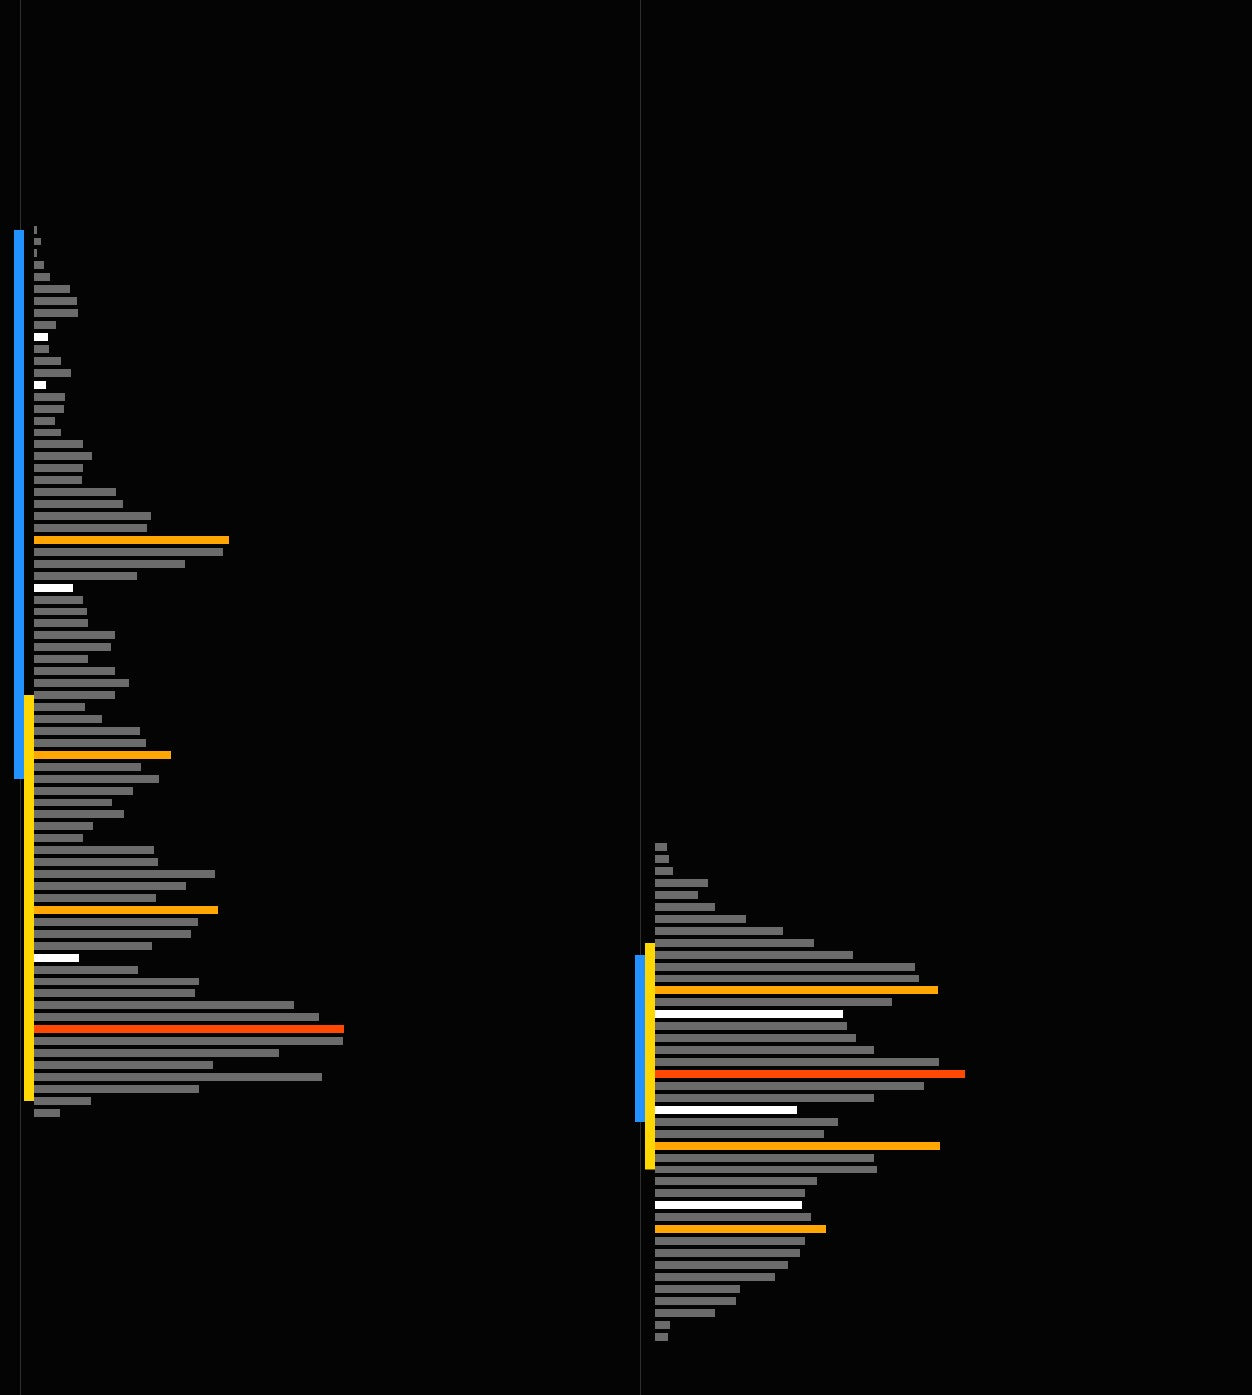
Buy/Sell (Default)
Each bar colored by who dominated — buyers or sellers. Volume on the ask gets one color, volume on the bid another. Inside the value area uses full opacity; outside uses reduced opacity for visual depth. Most popular mode.

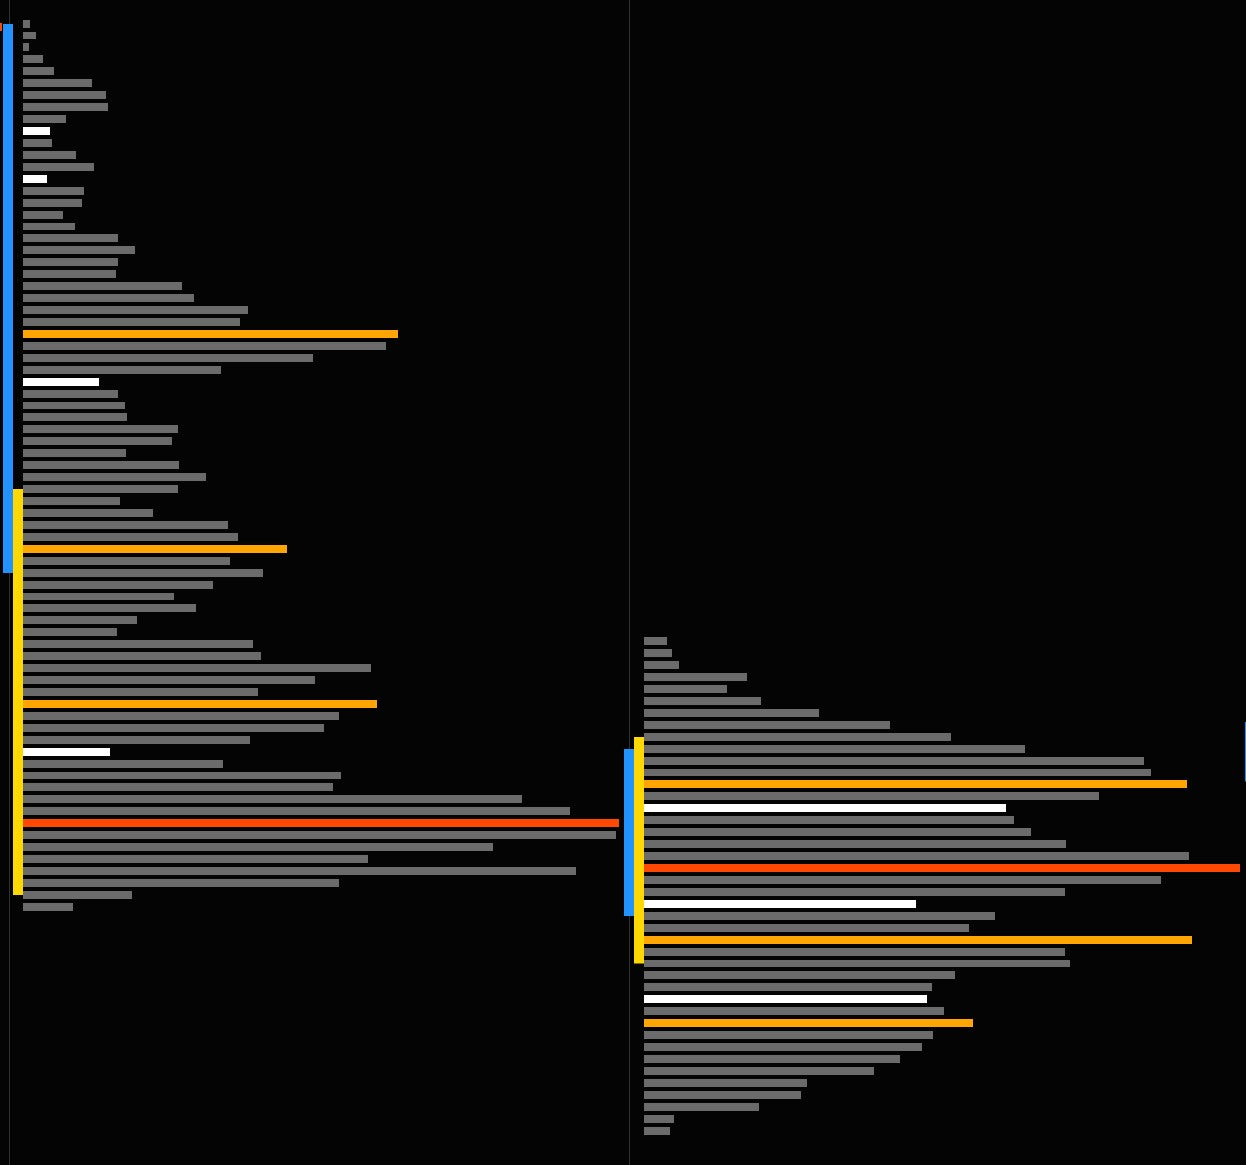
Delta
Colors each level by net delta (ask minus bid). Shows the imbalance at each price — how one-sided the activity was. Strong positive delta at the lows = potential support. Strong negative delta at the highs = resistance.
Delta & Volume — The Complete Picture
The most information-dense mode. Combines volume bars with a delta overlay. See both the total volume distribution and the directional imbalance in a single view. You get the profile shape, the POC, the value area, AND who controlled each level — all at once.
Inside vs. Outside Value Area
Regardless of color mode, bars inside the value area render at full opacity while bars outside use reduced opacity. This creates a natural visual emphasis on the zone where the majority of volume traded. All 6 inside/outside colors (Up, Down, Neutral for each) are individually customizable.
5. Key Levels & Pivot Lines — Your Trading Roadmap
Every profile automatically calculates 7 key levels. These are the prices that matter most — where to look for trades, set targets, and manage risk. Each level can be displayed as a line, a labeled line, or hidden. Configured independently for the current and previous profiles.
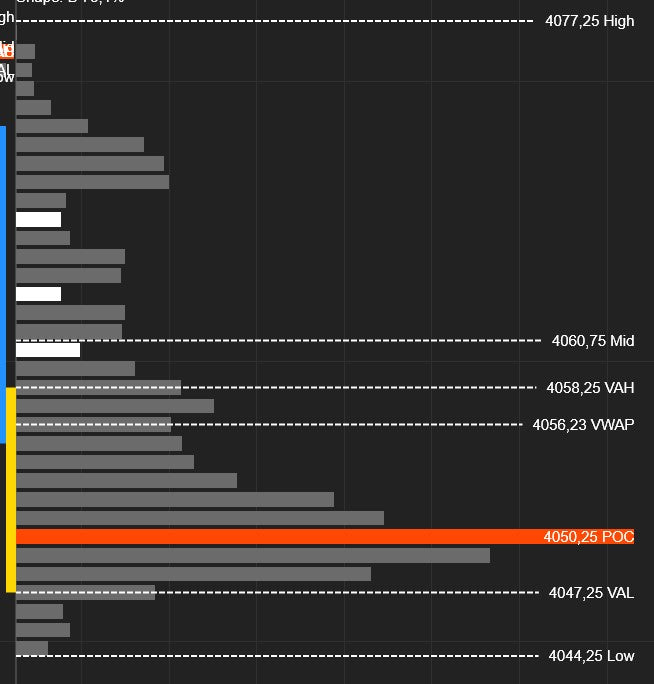
POC (Point of Control)
The single most important level in any volume profile. The POC is the price where the most volume traded — it's fair value. Price has a strong tendency to gravitate back to the POC.
- Magnet effect — When price moves away from the POC during the session, look for it to return.
- Support/resistance — Previous session POCs are powerful levels. Price often pauses or reverses at a prior day's POC.
- POC migration — When the POC shifts higher or lower during the session, it confirms directional momentum.
Value Area High & Low (VAH / VAL)
The price range where 70% of total volume traded (configurable). VAH is the top, VAL is the bottom. This is the "acceptance zone."
- Rejection trade — Price fails to break VAH or VAL? High-probability reversal back inside the value area.
- 80% rule — Price opens above VAH and trades back into the value area? There's an 80% chance it rotates all the way to VAL.
- The value area percentage is adjustable. Some traders use 68.2% (one standard deviation).
VWAP (Volume-Weighted Average Price)
The true average cost of all trades in the session, weighted by volume. This is the benchmark institutions use to measure execution quality.
- Trend filter — Price above VWAP = bullish bias. Below = bearish.
- Mean reversion — When price deviates far from VWAP, expect a snap-back.
- Institutional magnet — Large orders cluster around VWAP because that's where institutions target fills.
Session High
Highest traded price. A break signals new buying interest. A failure creates a double-top with volume context.
Session Mid
Midpoint between high and low. Quick directional filter: above mid = buyers in control, below = sellers.
Session Low
Lowest traded price. A break signals selling continuation. A hold with heavy volume = buying opportunity.
Display Controls
Every display option is configurable independently for current and previous profiles:
| Setting | Options | What It Controls |
|---|---|---|
| Pivots | None, Line, Line & Label | Whether to show lines, lines with labels, or nothing |
| Label Content | Price, Label, Price & Label | What the label text shows (price value, level name, or both) |
| Label Orientation | Left, Right | Which side of the profile the labels appear on |
| Extend Lines | On / Off | Extend pivot lines to the right edge of the chart |
| Show VWAP / MID / HIGH / LOW | On / Off each | Individual toggles for each supplementary level |
Extended Lines
Project the current profile's pivot lines forward to the right edge of the chart. See where today's POC, VAH, and VAL sit relative to current price, even when the profile is many bars to the left. Previous profiles have an even more powerful extension system — see Smart Line Extension.
Default Pivot Colors
6. High & Low Volume Nodes — The Levels That Matter Most
Volume nodes are the actionable price levels hidden inside the profile. HVNs are local peaks — where the market found consensus. LVNs are the gaps — thin zones the market rushed through. Knowing both is essential for every volume profile trader.
Low Volume Nodes (LVNs)
Price levels where very little volume traded — gaps in the auction. These are among the most tradeable signals the profile produces:
- Breakout acceleration — Price enters an LVN and there's nothing to stop it. It accelerates through. If you're in a trade heading into an LVN, let it run.
- Rejection boundaries — Price approaching an LVN may pause or reverse at the edge. The market hesitates before crossing into "thin air."
- Gap-fill targets — Unfilled LVNs from previous sessions are high-probability targets. Price tends to revisit them to build volume.
Default: 4 LVNs per profile, shown in white.
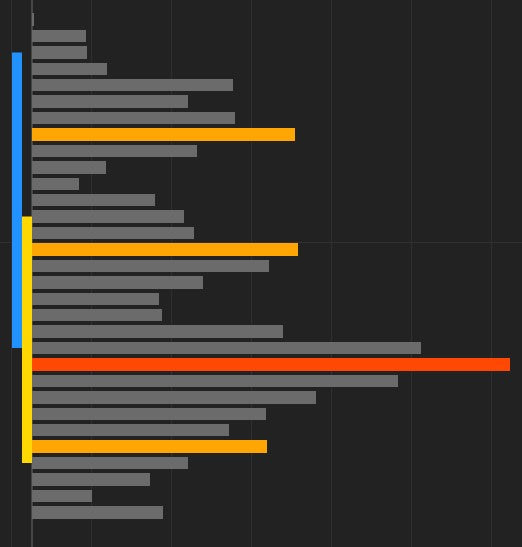
High Volume Nodes (HVNs)
Price levels with peak trading activity — local maxima in the volume distribution. Where the market found the most agreement.
- Strong support/resistance — Price returning to an HVN encounters the memory of heavy trading. Expect slowdowns, consolidation, or reversals.
- Magnet effect — In ranges, price gravitates toward HVNs and passes quickly through LVNs.
- Consensus clusters — Multiple HVNs at similar prices = strong structural level.
Default: 4 HVNs per profile, shown in orange. Disabled by default — enable with one click.
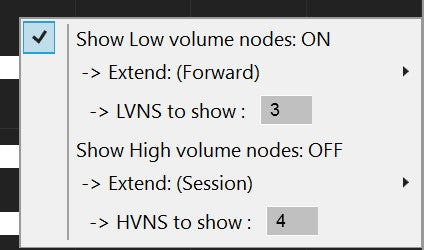
Node Settings
| Setting | Default | Description |
|---|---|---|
| Show Low Volume Nodes | On | Enable LVN markers on the profile |
| Number of LVNs | 4 | How many local minima to highlight |
| Region Size (LVN) | 1 | Neighborhood size for detection. Higher values detect broader LVN regions. |
| Extend (LVN) | None | None = no extension. Session = to end of profile. Forward = to chart right edge. |
| Extend Count (LVN) | 1 | How many sessions back to show extended lines |
| Show High Volume Nodes | Off | Enable HVN markers on the profile |
| Number of HVNs | 4 | How many local maxima to highlight |
| Region Size (HVN) | 1 | Neighborhood size for HVN detection |
| Extend (HVN) | None | Extension mode for HVN lines (None, Session, Forward) |
| Extend Count (HVN) | 1 | How many sessions back to extend HVN lines |
Colors: HVN markers default to Orange (20% opacity when extended). LVN markers default to White (20% opacity when extended). All fully customizable.
7. Smart Line Extension — Keep Yesterday's Levels Alive
Yesterday's POC, VAH, VAL, and VWAP don't lose their significance when a new session starts. They're your battle lines for today. This feature extends them forward — and intelligently removes them when the market deals with them.

Three Extension Modes
| Mode | Behavior | Best For |
|---|---|---|
| Forever | Lines extend indefinitely to the right | Seeing all historical levels as a permanent reference grid. Spot confluences across sessions. |
| Until Broken | Lines stop when price closes through the level | Only showing levels that are still intact. A broken level disappears automatically. |
| Until Tested | Lines stop when price touches the level | The most aggressive cleanup. Only untested levels remain — the ones the market hasn't dealt with yet. |
| Setting | Default | Description |
|---|---|---|
| Extend Previous Lines | On | Master toggle for extending previous pivot lines |
| Extend Count | 1 | How many previous sessions to extend (1 = yesterday only) |
| Extend Until | Until Tested | When to stop: Forever, Until Broken, Until Tested |
8. TPO Overlay — Add the Time Dimension
Volume shows conviction. Time shows acceptance. The TPO (Time Price Opportunity) overlay adds a second dimension to the profile: how long the market spent at each price, not just how much volume traded there.
◈ Volume vs. Time Divergence
A price level with high volume but low TPO means a lot traded in a short burst — aggressive initiative activity, often the start of a move. High TPO but low volume means the market lingered without conviction — a potential breakout zone. These divergences are powerful signals.
◈ TPO Gets Its Own POC & Value Area
The TPO overlay calculates a separate POC (the price level with the most time periods) and separate VAH/VAL. Compare where volume says fair value is vs. where time says fair value is. When both agree, the level is rock-solid. When they diverge, the market is in transition.
| Setting | Default | Description |
|---|---|---|
| Show TPO Outline | Off | Toggle the TPO overlay on the profile |
| Inside Value Area Stroke | DodgerBlue, Dash, 2px | Color for TPO bars inside the TPO value area |
| Outside Value Area Stroke | Red, Dash, 2px | Color for TPO bars outside the TPO value area |
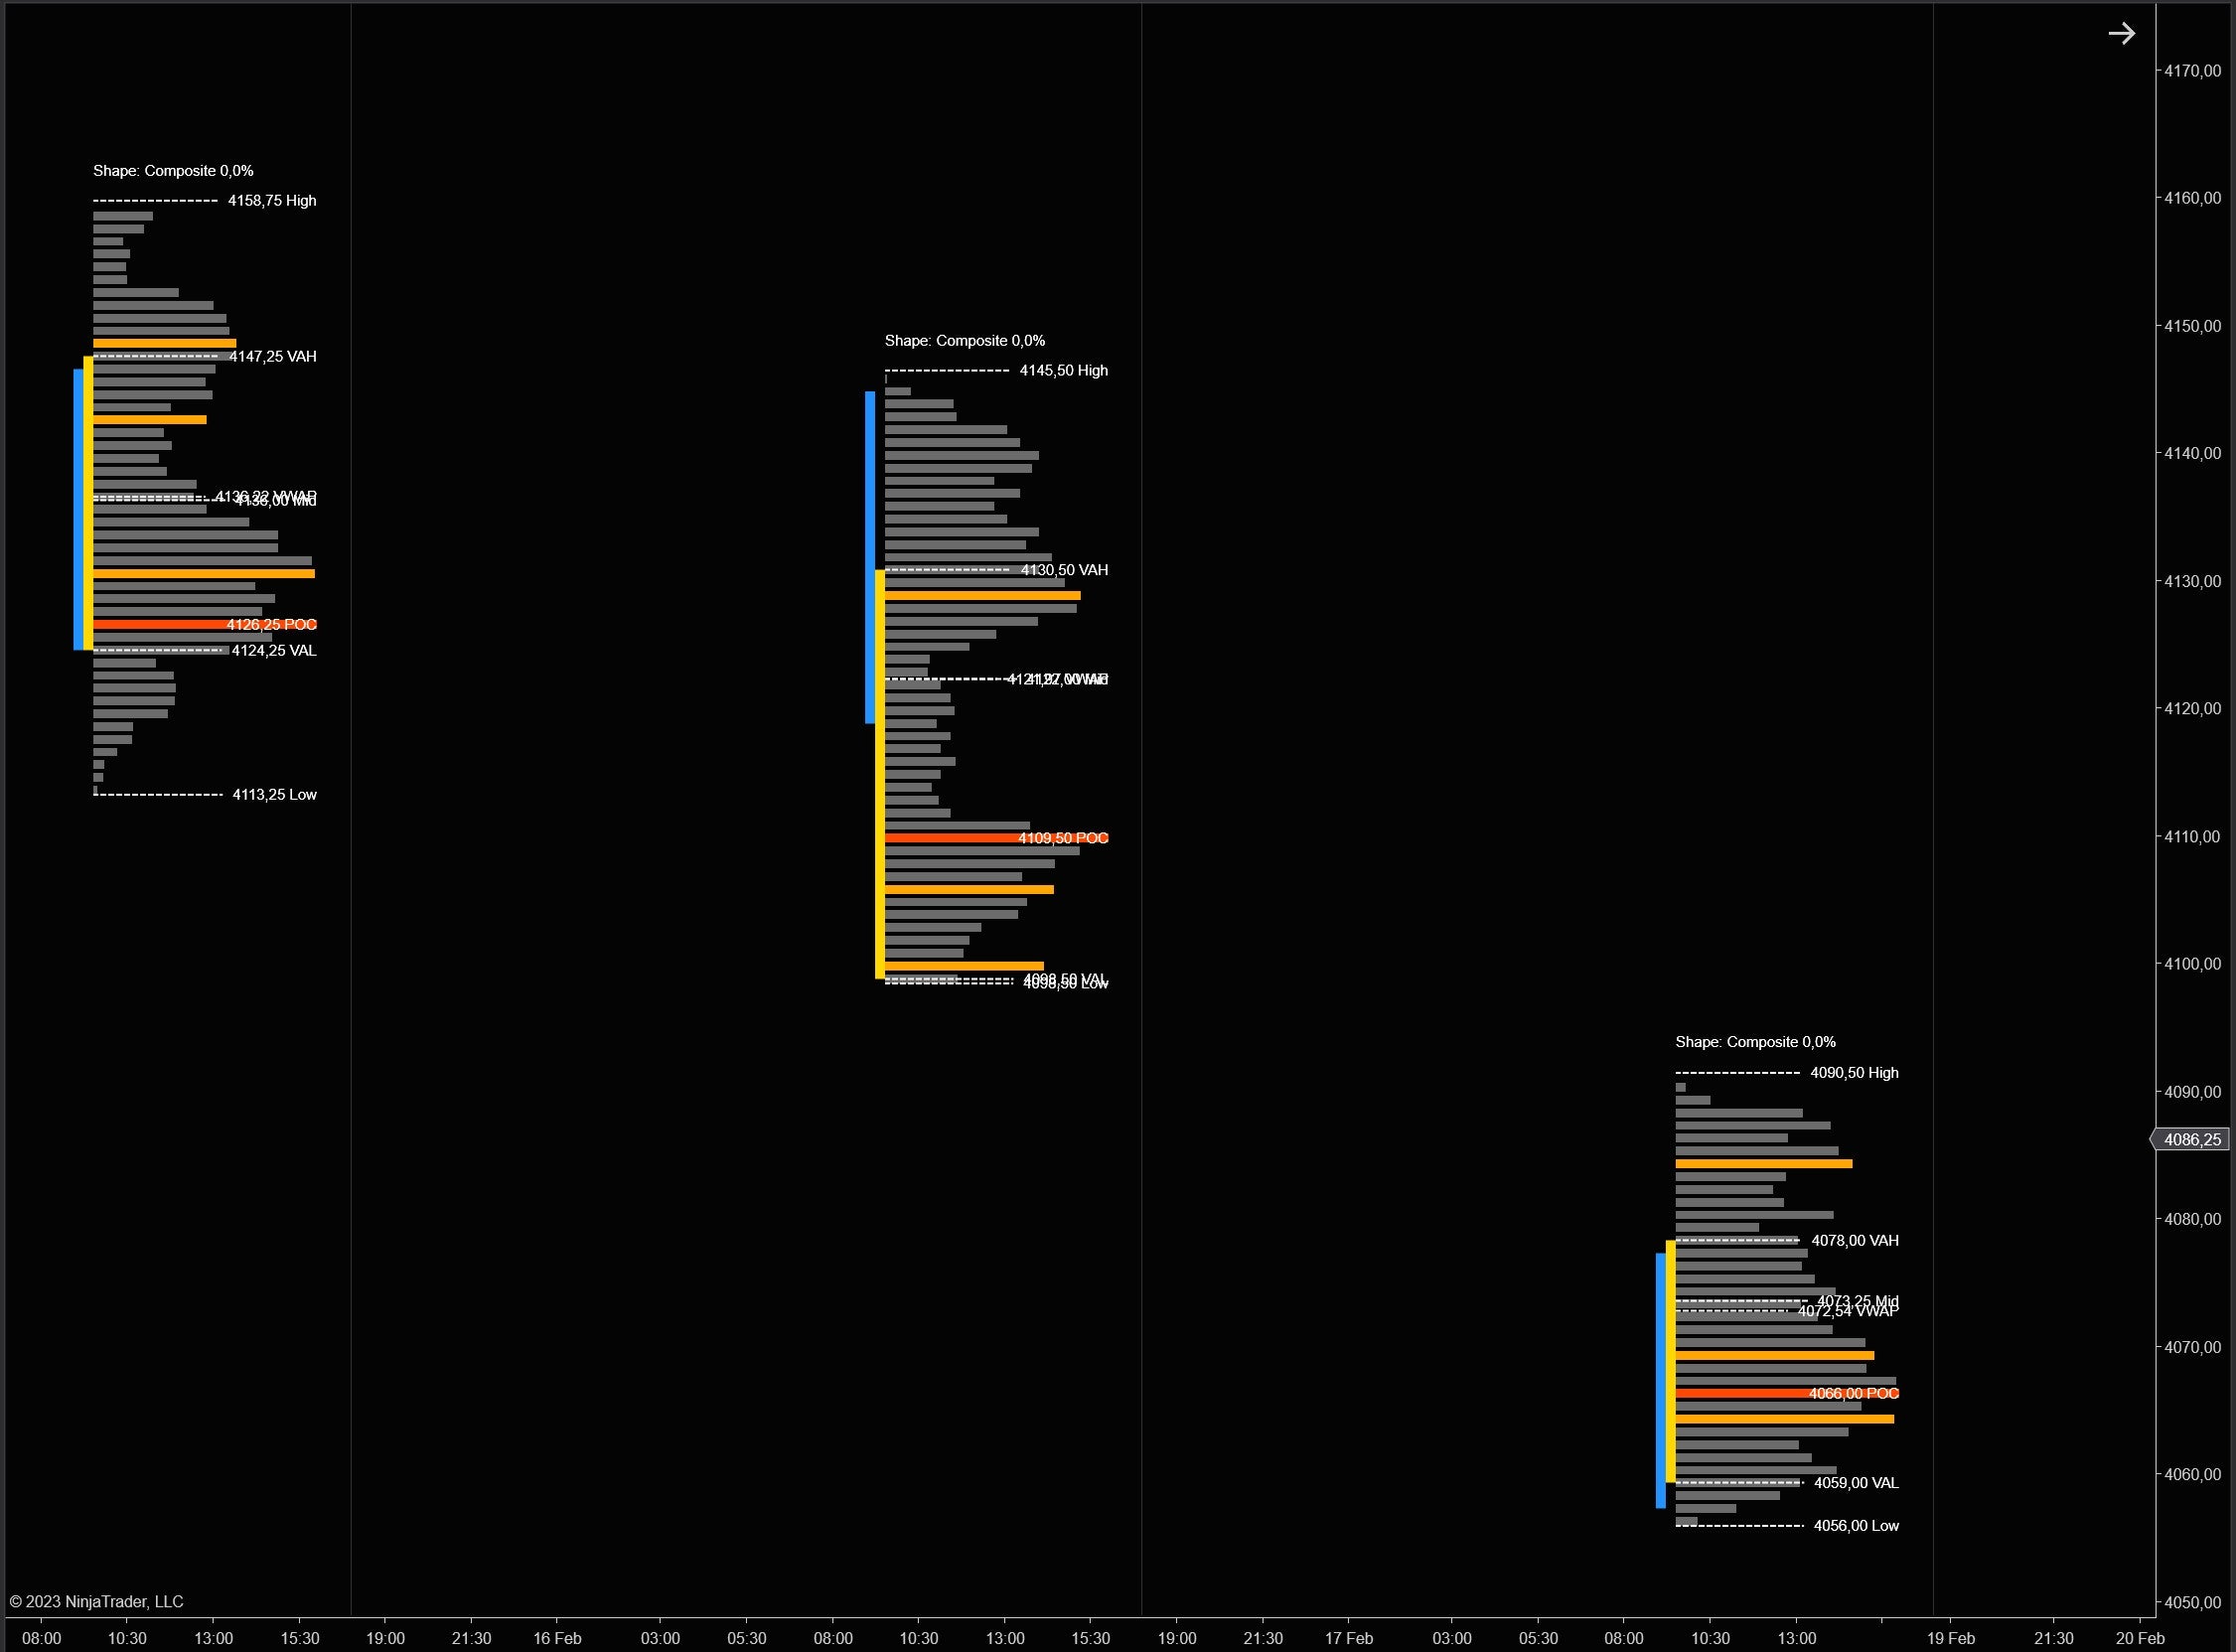
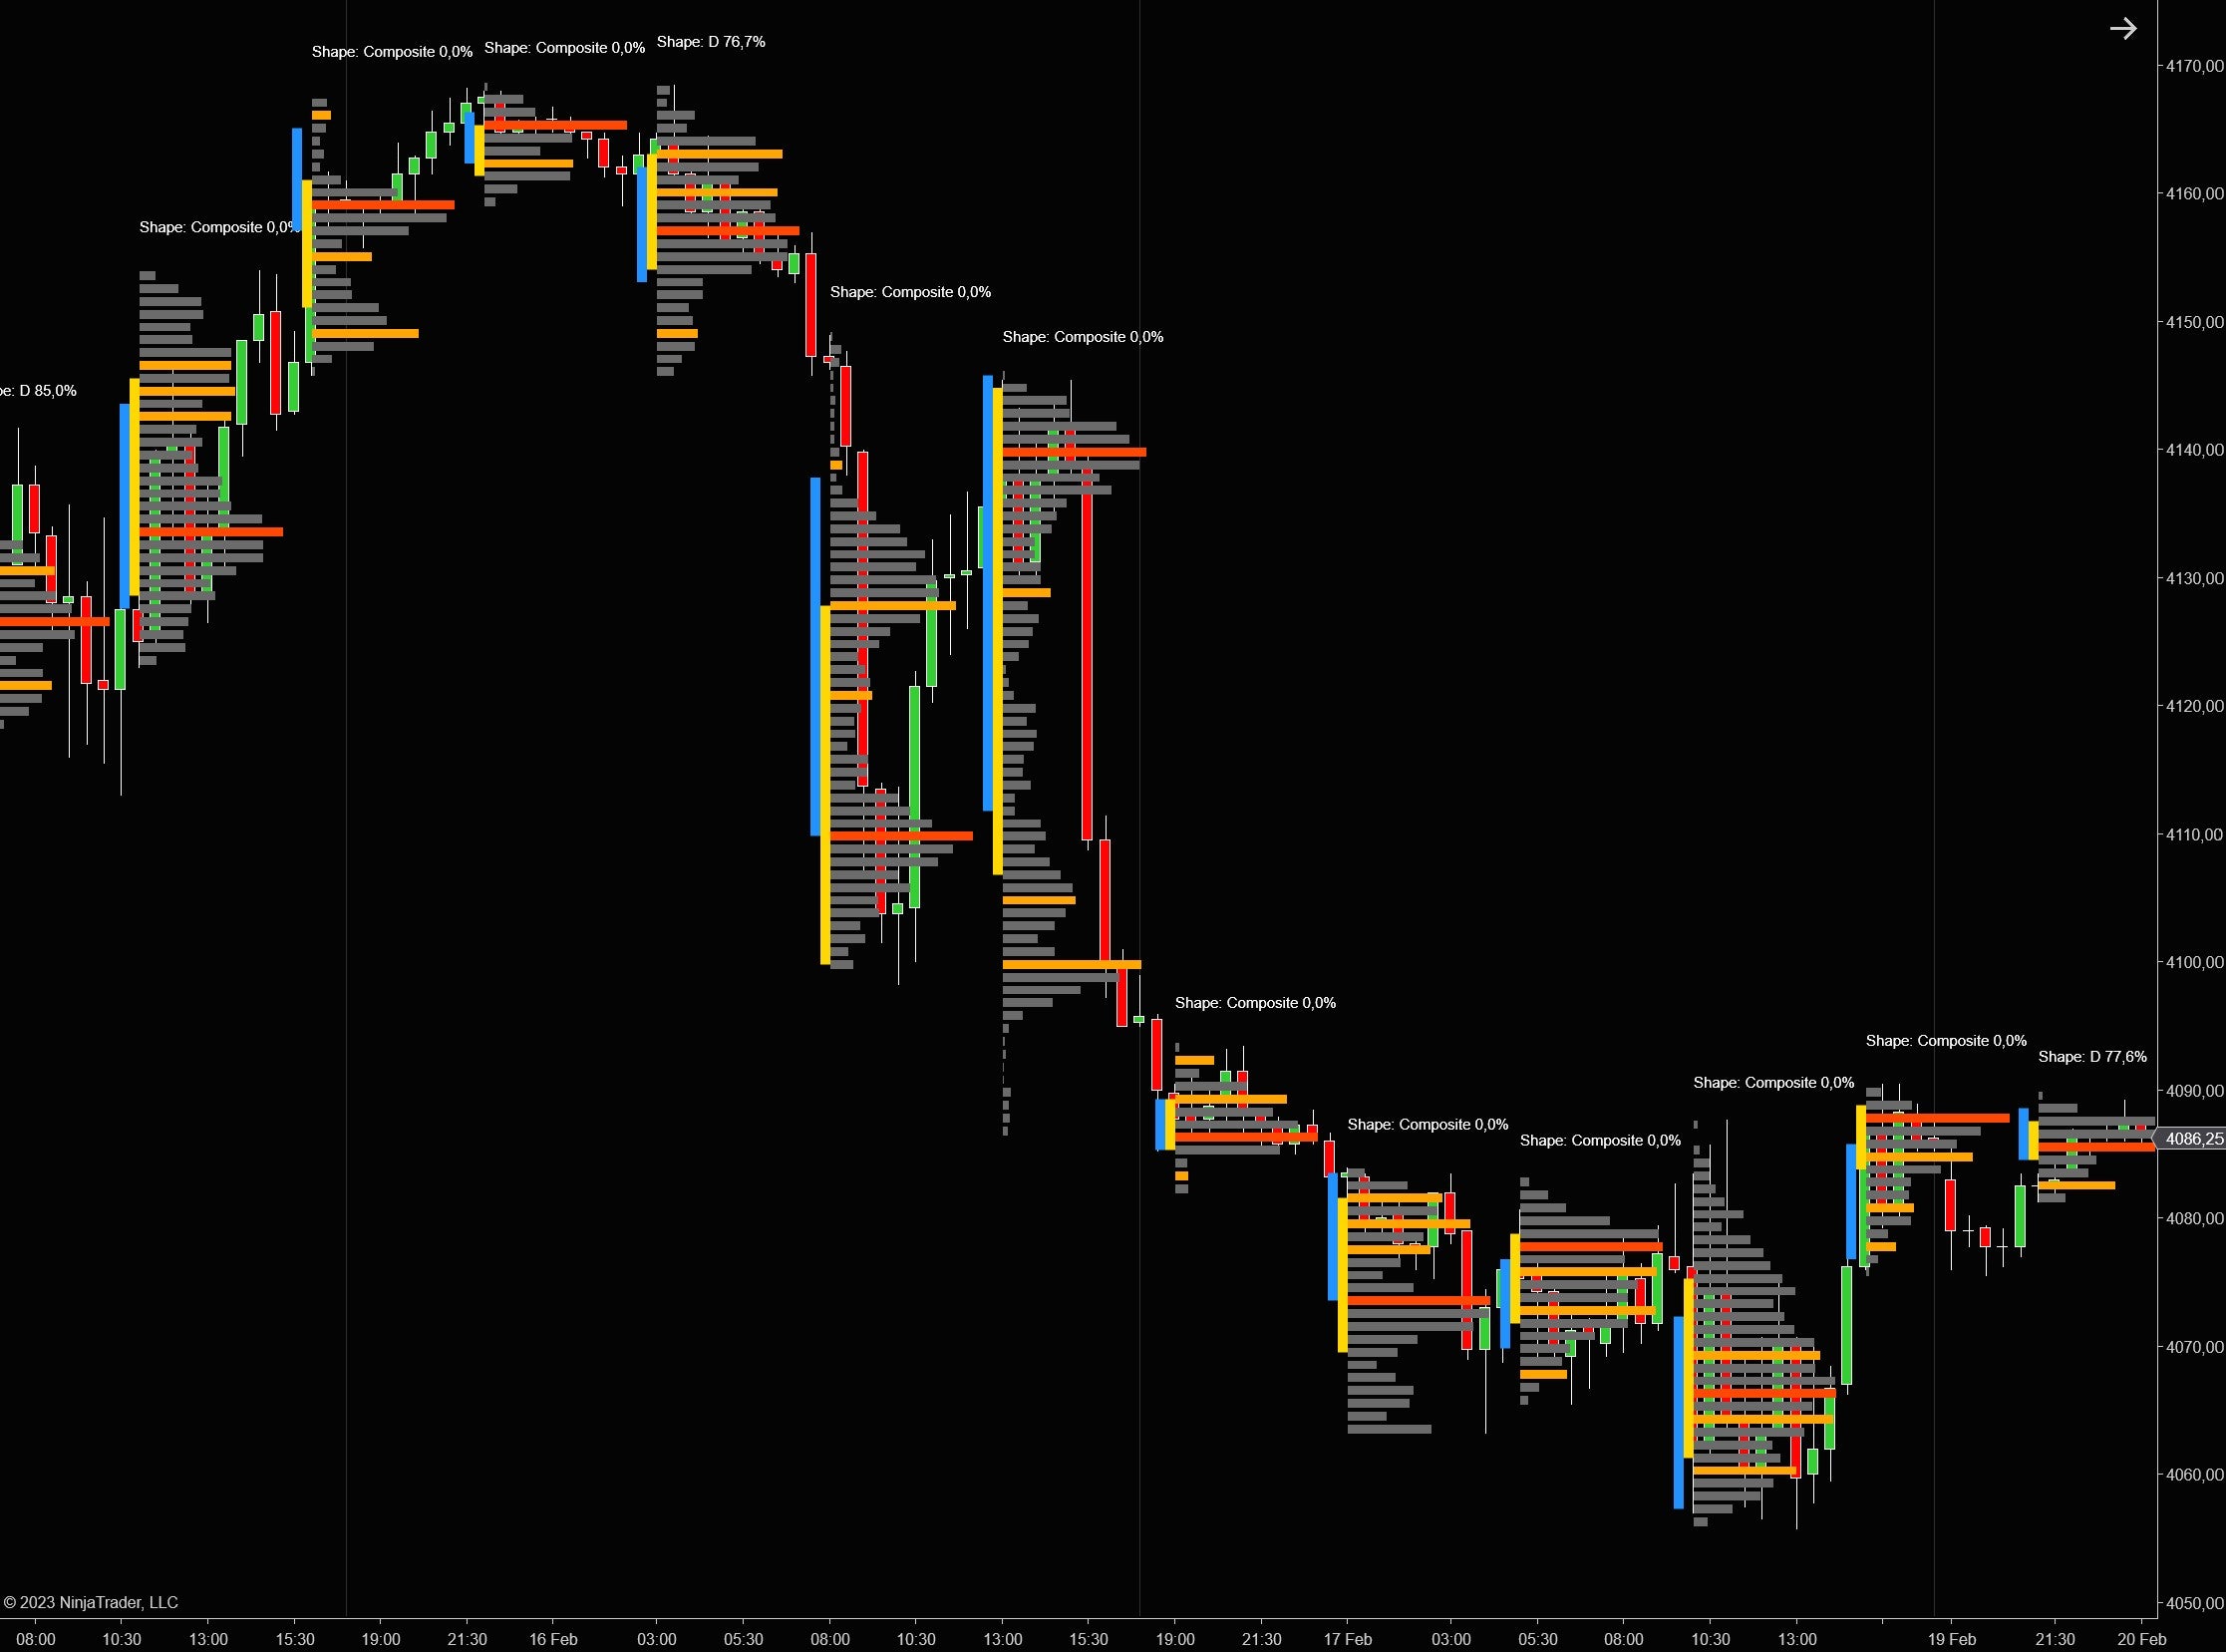
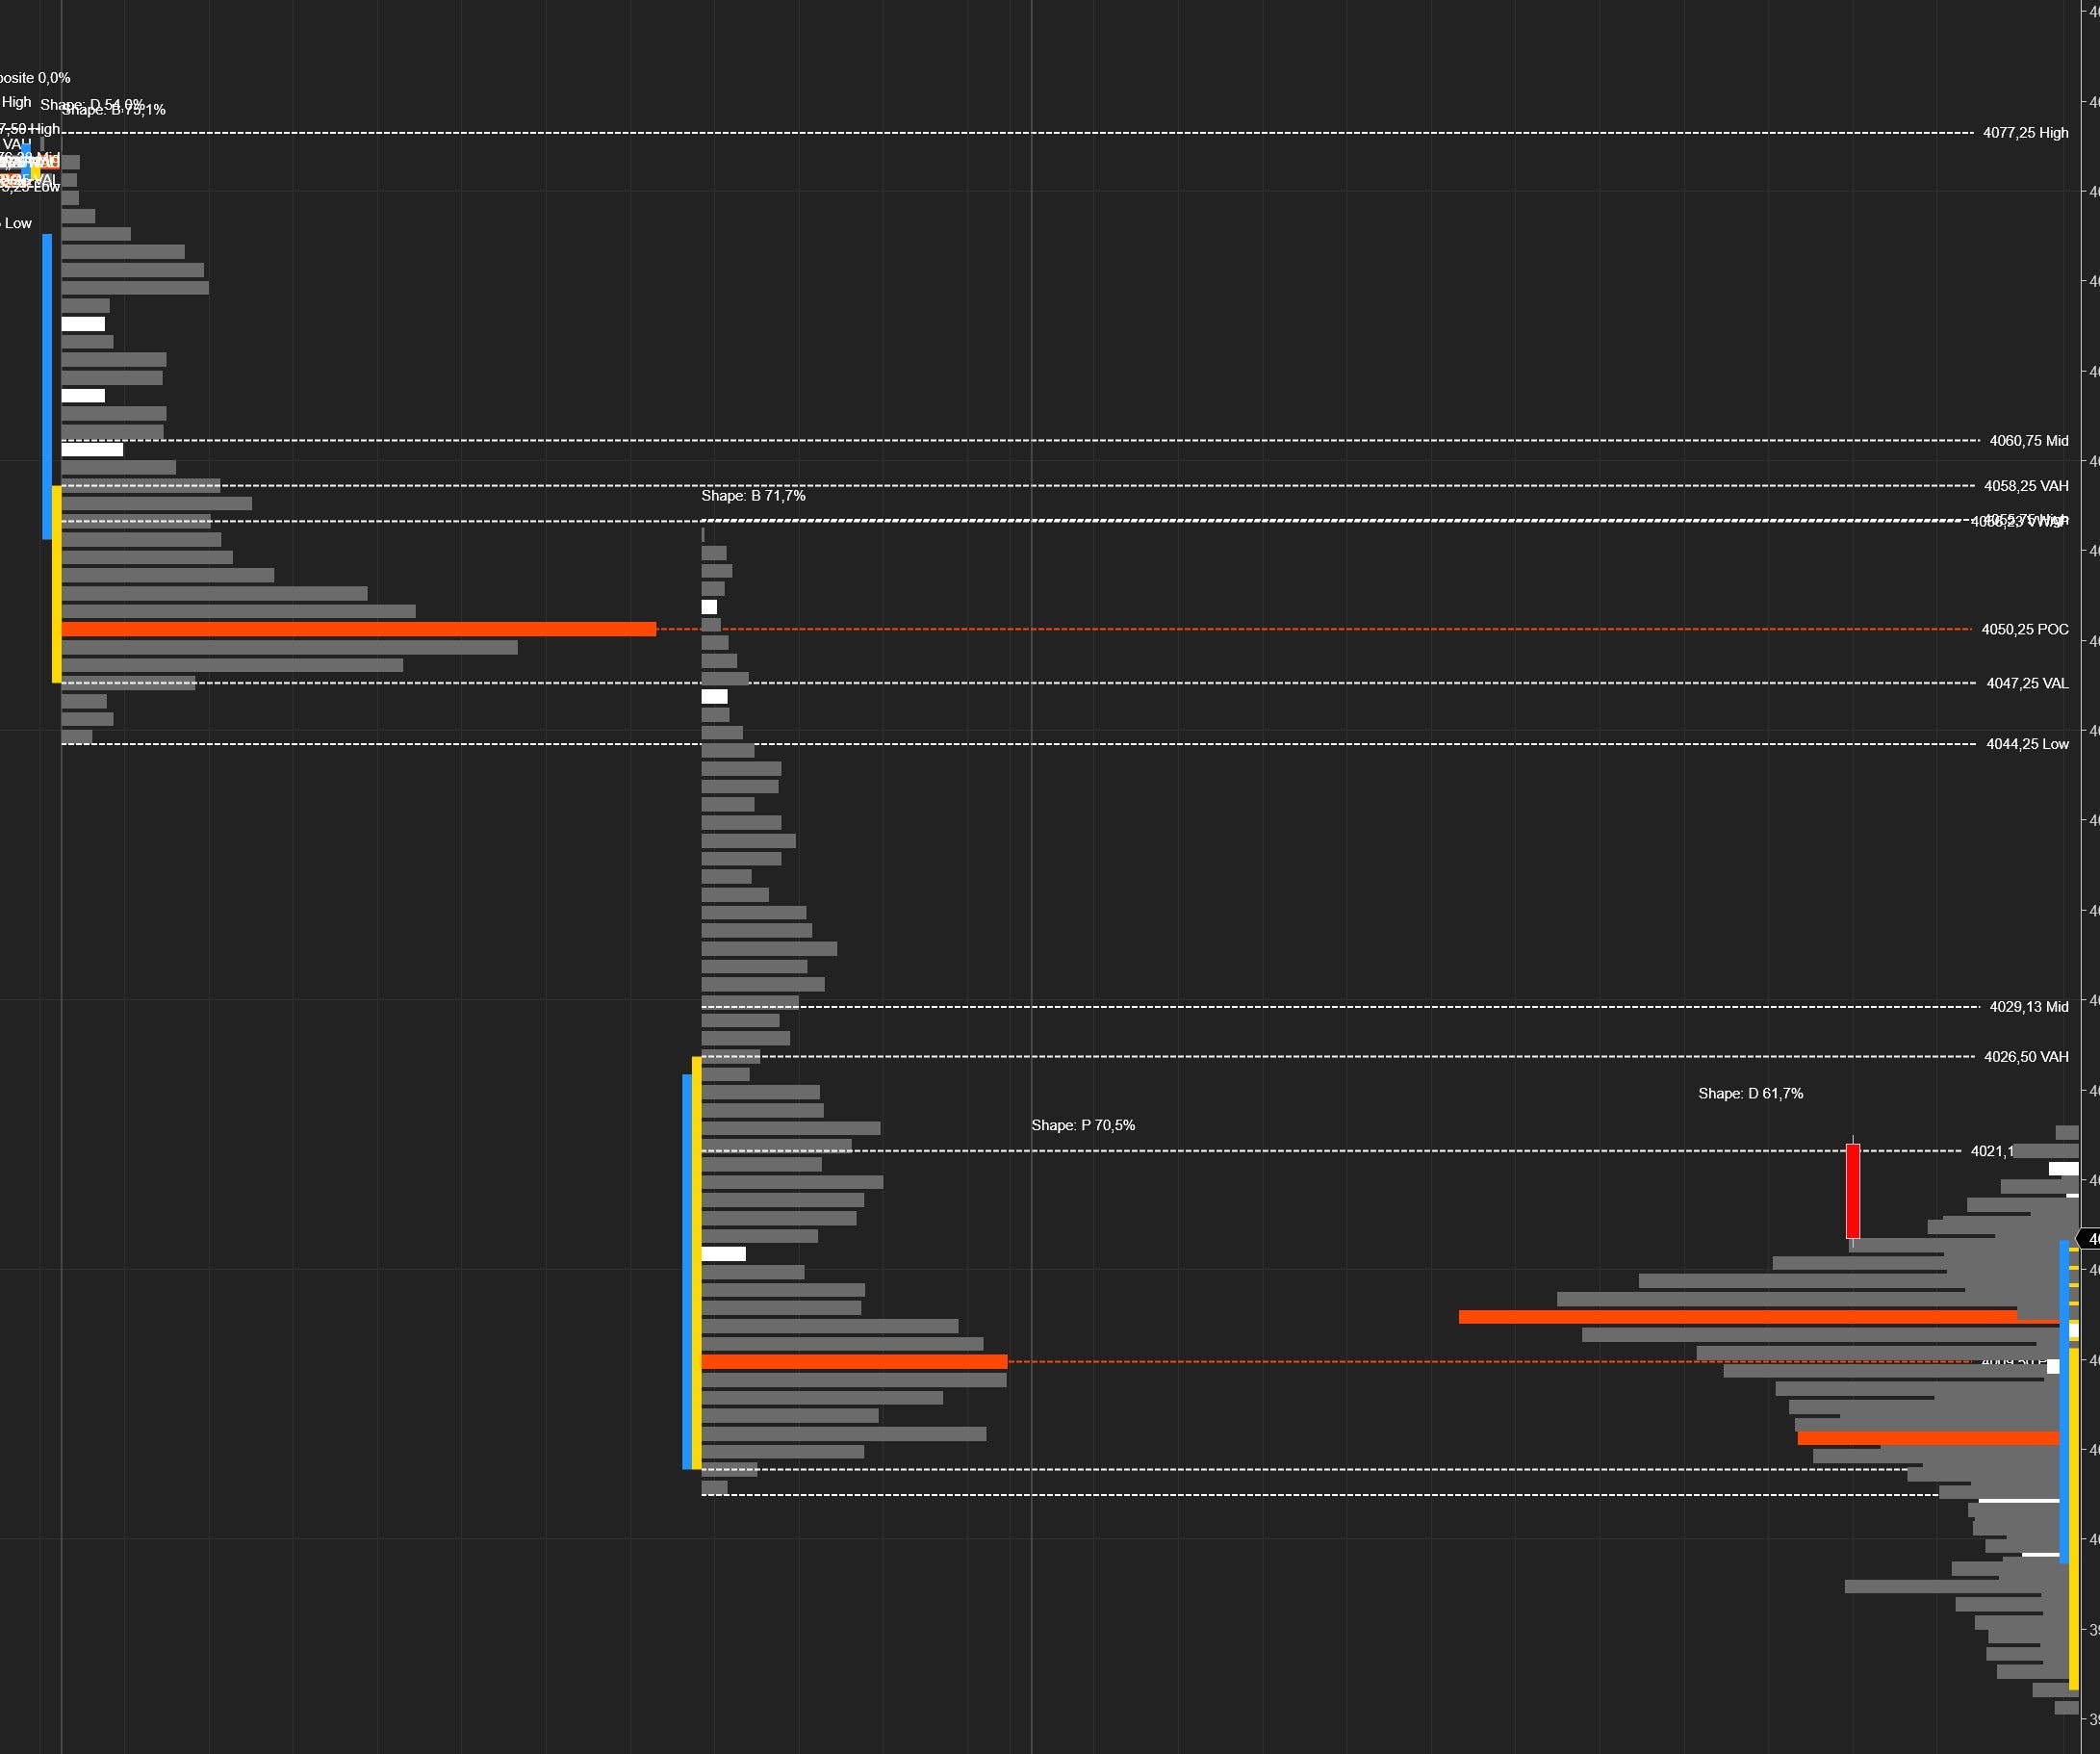
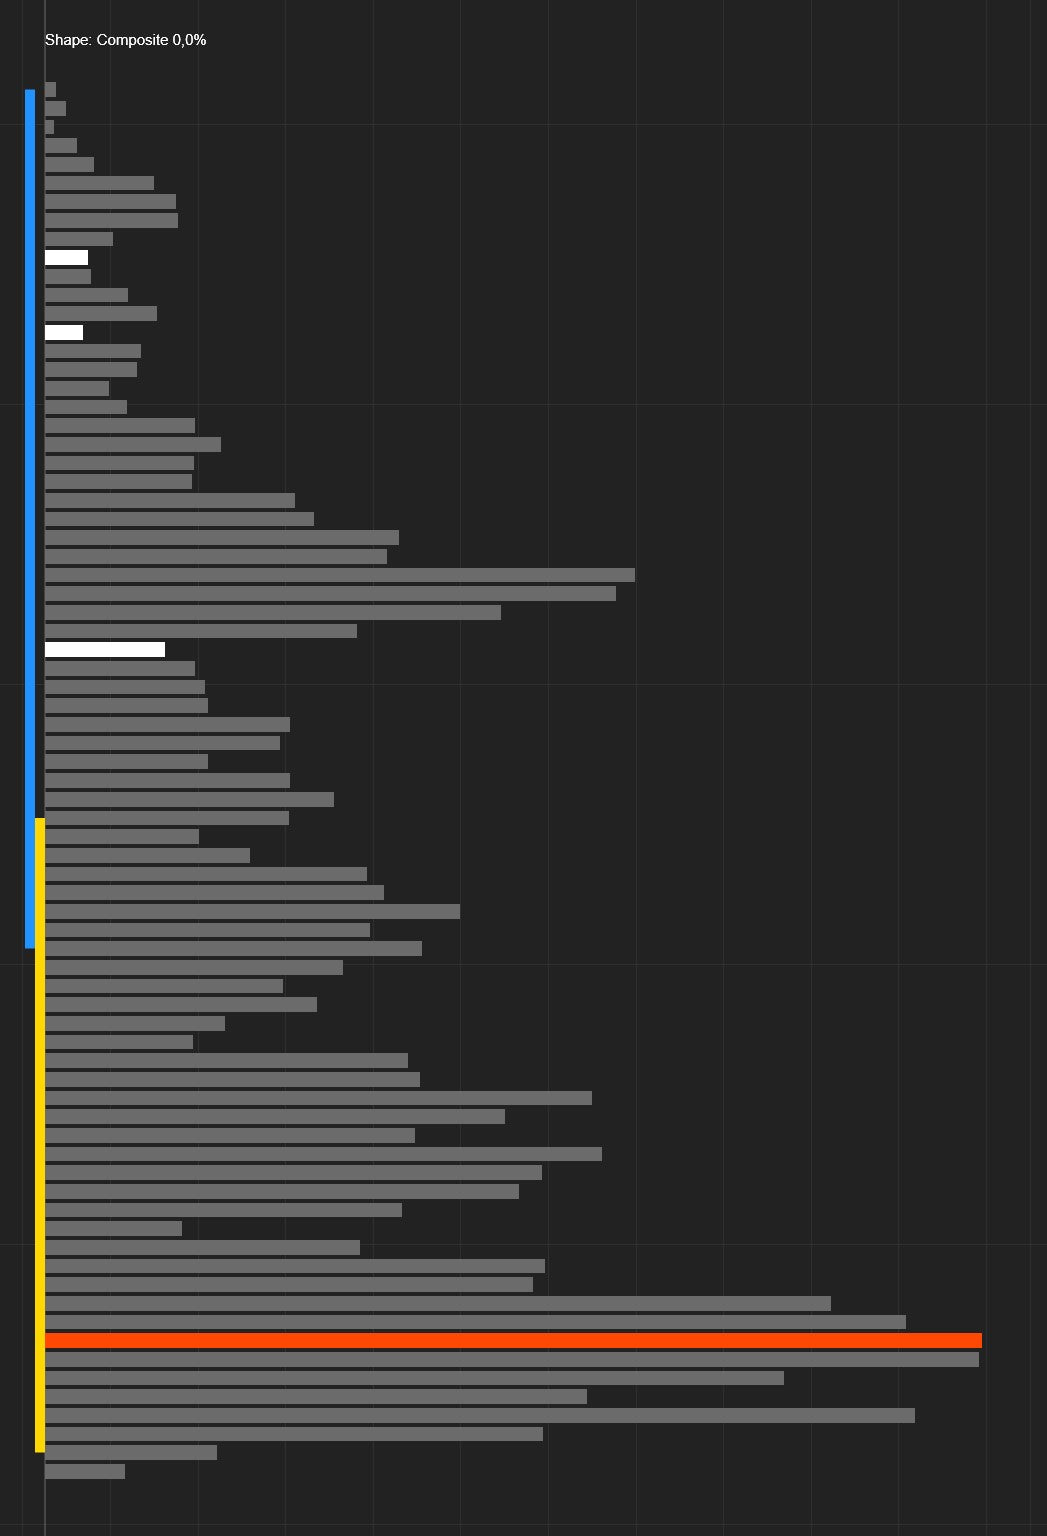
9. Auto Profile Splitting — Reveal the True Structure
When the market shifts value during a session (morning range, then an afternoon breakout), a single profile gives you a misleading POC and Value Area because they average across unrelated distributions. Auto-splitting fixes this by detecting the composite shape and splitting it into sub-profiles.
Without Splitting
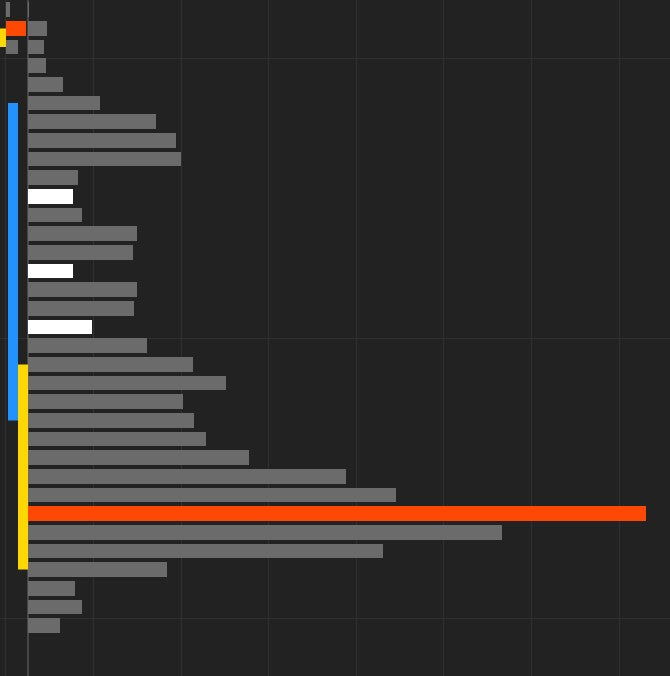
One blended profile with a POC that sits between two distributions — a price level that may not even matter. The value area spans the entire range, masking the real structure.
With Splitting
Each distribution gets its own POC, Value Area, and HVN/LVN analysis. Now you see the true market structure — separate fair values for each phase of the session.
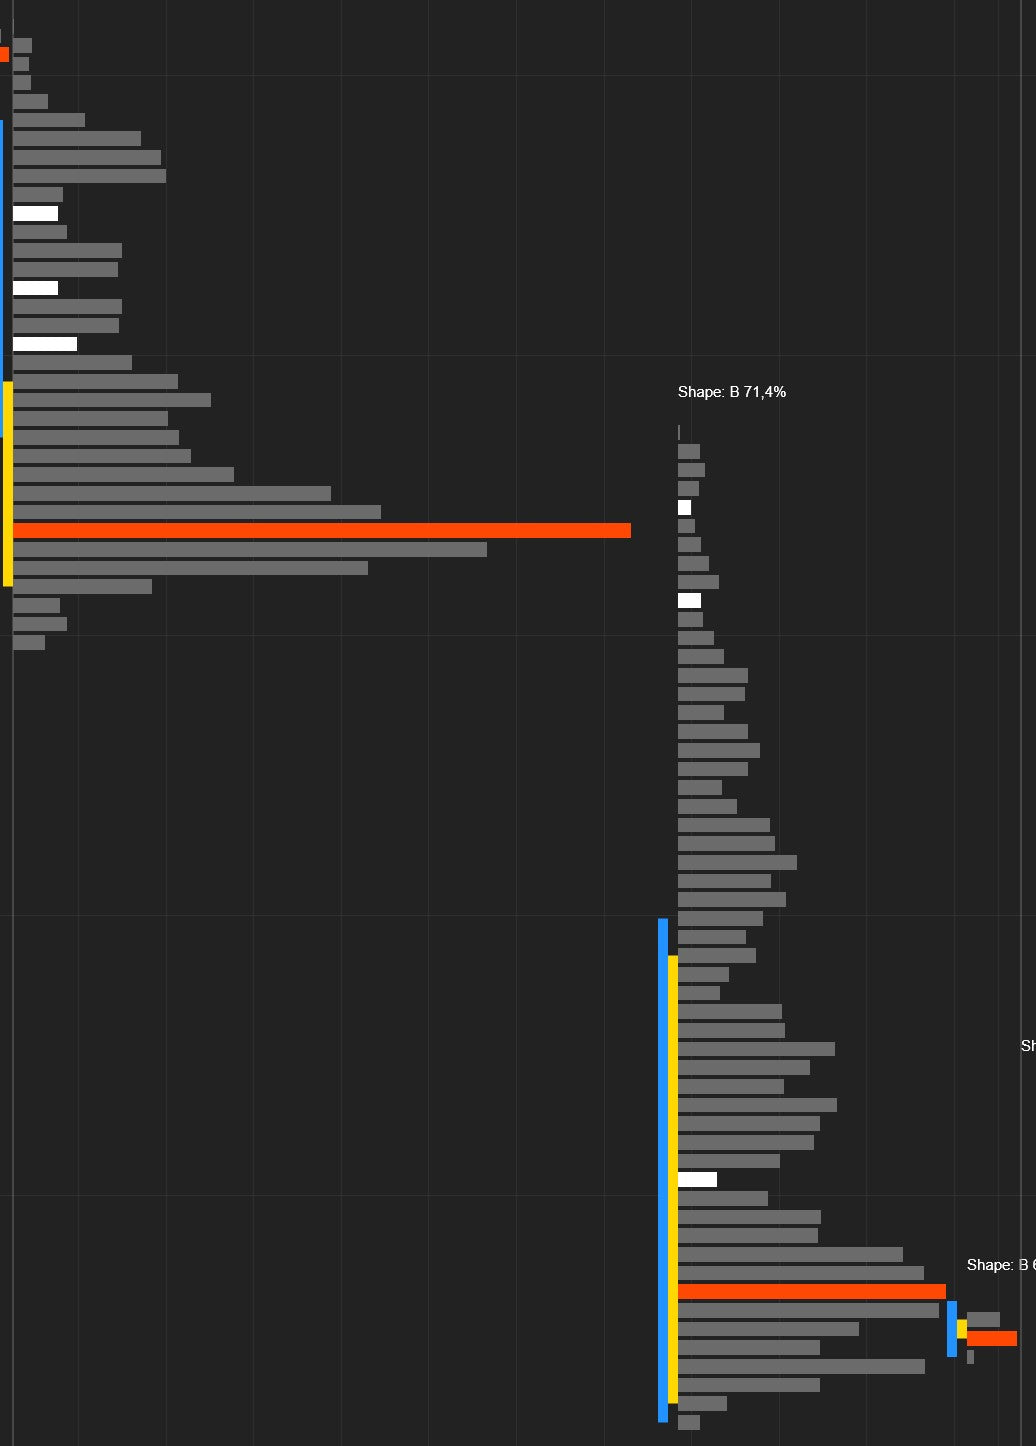
Four Profile Shapes
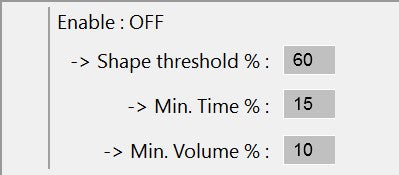
Splitting Settings
| Setting | Default | Description |
|---|---|---|
| Enable Auto-Split | Off | Automatically detect and split composite profiles |
| Shape Threshold (%) | 60 | Volume % needed in one region to classify as P or D. Higher = stricter detection. |
| Min Split Time (%) | 15 | Minimum session time % before splitting is considered. Prevents premature splits. |
| Min Split Volume (%) | 10 | Minimum volume % in the split region. Filters out noise. |
10. Visual Customization — Make It Yours
Every aspect of the profile's appearance is adjustable. Width, resolution, smoothing, orientation, outline — dial in exactly the look you want.
Profile Width
Compact (40% — Default)
Profile bars extend up to 40% of the session's horizontal space. Clean and compact, leaving room for the candles.
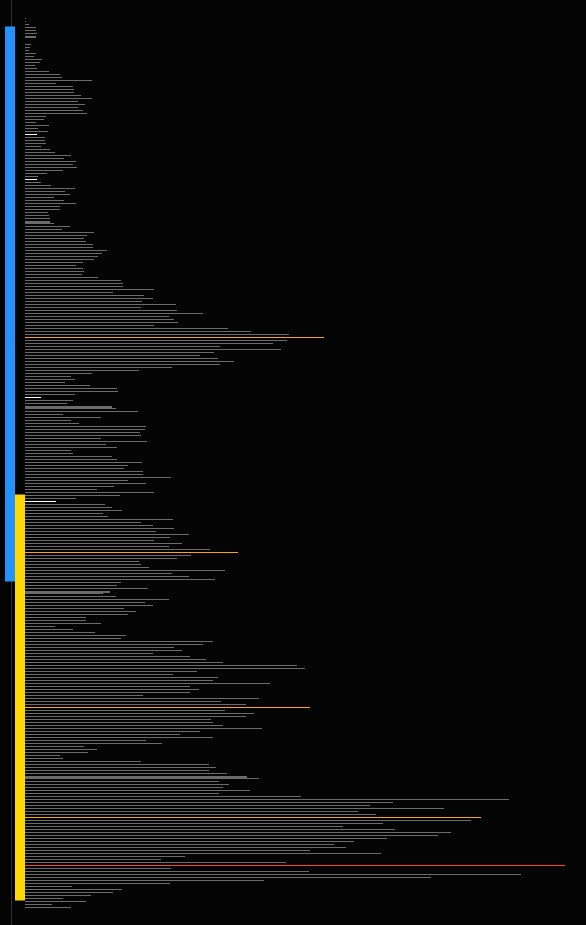
Full Width (100%)
The profile spans the entire session, creating a dramatic volume overlay that fills the background. At 20-30%, it sits neatly alongside the candles.
Tick Aggregation
1 Tick Per Level
Maximum resolution. Every price tick gets its own bar. Most granular but most dense. Best for detailed analysis on ES, NQ, YM, CL.
4 Ticks Per Level (Default)
Aggregates 4 ticks per bar. The sweet spot — clear distribution shape without the noise of individual tick data.

Profile Smoothing
Normal
The raw volume distribution. Every bump and dip visible. Maximum precision for traders who read raw data.

Smoothed
Smoothing removes jagged noise and reveals the underlying shape. The smoothing period (default: 8) controls the intensity — higher = smoother. Great for shape analysis and weekly/monthly profiles.

Orientation
Left (Default)
Profile builds from the left side of the session toward the right. Anchors at the session open.
Right
Profile builds from the right side toward the left. Places the volume data immediately adjacent to the latest candles.

Resolution (Data Granularity)
| Resolution | Default | Use Case |
|---|---|---|
| Second | 1-second | Default. Best balance of accuracy and performance. Good buy/sell volume split. |
| Minute | 1-minute | Faster processing, lower precision. Good for weekly/monthly profiles or slower machines. |
| Tick | 1-tick | Maximum precision for buy/sell split. Highest processing cost. Use when tick data is available. |
More Display Settings
| Setting | Default | What It Does |
|---|---|---|
| Value Area (%) | 70 | Volume percentage that defines the value area |
| Vertical Spacing | 2 px | Gap between volume bars. Increase for airier look. |
| Vertical VAL Line Width | 10 px | Width of the vertical value area boundary markers |
| Show Outline | Off | Draws a smooth outline around the profile shape |
| Profiles to Show | 0 (all) | Limits rendered profiles. Set to 3-5 for performance. |
| Update Historical Plots | Off | When on, populates plot values for historical bars (needed for backtesting) |
| Show Session Total Volume | On | Displays total volume + price range text at the bottom of each profile |
11. Volume & Delta Text — See the Numbers
Display numeric volume or delta values next to each price level. Configurable independently for current and previous profiles.
12. Paint Bars — Unified Chart Appearance
Override the default NinjaTrader candlestick colors so your candles match the volume profile's visual style. Or hide them entirely for a pure Market Profile view.
| Setting | Default | Description |
|---|---|---|
| Enable Paint Bars | On | Override candlestick colors |
| Show Paint Bars | Back | Back = behind profile. Front = on top. Hide = invisible candles (profile only). |
| Up Bar Color | LimeGreen | Fill for bullish candles |
| Down Bar Color | Red | Fill for bearish candles |
| Up Bar Outline | White | Border for bullish candles |
| Down Bar Outline | White | Border for bearish candles |
13. Easy Access Toolbar — Change Settings Without Leaving the Chart
An interactive menu built directly into the NinjaTrader chart window. No settings dialogs, no multi-step menus. Just click and go. Sub-menus carry inline color pickers, numeric scrollers, and dynamic per-mode panels.

Top-Level Menu
- Enable / Disable the indicator with one click
- Profile mode (parent menu, NEW) — Daily / Weekly / Monthly / Custom Session / Fixed Interval / Visible Range / Every X Bars / All Bars / Composite Date Range / Rolling N Days. Selecting a mode reveals a sub-panel with mode-specific settings (interval minutes, rolling-N count, date range start/end), so you can change them without leaving the chart.
- Color mode — Mono, Heatmap, Buy/Sell, Delta, Delta & Volume
- Number of profiles to render
- Current profile — orientation, pivots, labels, extension, volume text, developing-trace toggles
- Previous profiles — orientation, pivots, labels, extension, previous-POC display (All / Naked / Hide), migrating-POC toggle
- HVN / LVN — toggle, counts, region size, extension mode & count
- Smoothing — toggle and period
- Auto-splitting — toggle and thresholds (shape %, min split time %, min split volume %)
- Paint bars — toggle and Z-order (Hide / Front / Back)
- Outline toggles — VP outline, TPO outline
- Level toggles — VWAP, MID, HIGH, LOW individually
- Session divider — toggle
- Session total volume — toggle
- Recalculate — force full profile recalculation
Auction Tools sub-menu (NEW)
- Stats Card — Show on live profile, Show on previous profiles, Show Day Type pill
- Initial Balance — Show IB, IB minutes (scroll wheel), Show IB extensions
- Single Prints & Poor High / Poor Low — independent toggles
- Migrating POC toggle
- Audio Alerts sub-menu — POC / VAH / VAL touch, HVN / LVN approach, Naked POC test, IB break — each with its own toggle, plus approach distance (ticks) and cooldown (seconds) scrollers
Numeric fields support mouse wheel adjustment. Toggle items show a checkbox indicator for current state. Sub-menu items carry descriptive captions and inline color pickers wherever a stroke is exposed.
14. NinjaScript Plots — Build Strategies on Volume Profile Data
Every key level is available as a NinjaScript plot. Use them in AlgoStudio Pro, Market Analyzer, alert conditions, or your own custom strategies. 28 plots total — 11 for the current profile, 11 for the previous, 4 developing-trace series, and 2 Initial Balance levels.

Current Profile (Plots 0–10)
Previous Profile (Plots 11–21)
The same 11 plots, but for the previous session's profile. Programmatic access to yesterday's POC, VAH, VAL, VWAP, node prices, and TPO levels.
Developing Trace NEW (Plots 22–25)
The live POC / VAH / VAL / VWAP as they migrate through the developing session. Read the directional bias of the auction in real time — when the developing POC ticks higher each bar, buyers are in control.
Initial Balance NEW (Plots 26–27)
The session's IB high and IB low as plot series. Combine with price comparisons to alert or auto-enter on IB breaks; or use them as adaptive levels in any strategy that already understands "yesterday's high" or "premarket high."
Plot Index Reference
| # | Plot Name | NinjaScript Property | Units |
|---|---|---|---|
| 0 | Current VP Value Area High | CurrentVPValueAreaHigh |
price |
| 1 | Current VP Value Area Low | CurrentVPValueAreaLow |
price |
| 2 | Current VP POC | CurrentVPPOC |
price |
| 3 | Current Low Volume Node Price | CurrentLowVolumeNodePrice |
price |
| 4 | Current High Volume Node Price | CurrentHighVolumeNodePrice |
price |
| 5 | Current LVN Distance | CurrentLowVolumeNodeDistance |
ticks |
| 6 | Current HVN Distance | CurrentHighVolumeNodeDistance |
ticks |
| 7 | Current TPO Value Area High | CurrentTPOValueAreaHigh |
price |
| 8 | Current TPO Value Area Low | CurrentTPOValueAreaLow |
price |
| 9 | Current TPO POC | CurrentTPOPOC |
price |
| 10 | Current VWAP | CurrentVWAP |
price |
| 11 | Previous VP Value Area High | PreviousVPValueAreaHigh |
price |
| 12 | Previous VP Value Area Low | PreviousVPValueAreaLow |
price |
| 13 | Previous VP POC | PreviousVPPOC |
price |
| 14 | Previous Low Volume Node Price | PreviousLowVolumeNodePrice |
price |
| 15 | Previous High Volume Node Price | PreviousHighVolumeNodePrice |
price |
| 16 | Previous LVN Distance | PreviousLowVolumeNodeDistance |
ticks |
| 17 | Previous HVN Distance | PreviousHighVolumeNodeDistance |
ticks |
| 18 | Previous TPO Value Area High | PreviousTPOValueAreaHigh |
price |
| 19 | Previous TPO Value Area Low | PreviousTPOValueAreaLow |
price |
| 20 | Previous TPO POC | PreviousTPOPOC |
price |
| 21 | Previous VWAP | PreviousVWAP |
price |
| 22 | Developing POC (NEW) | DevelopingPOC |
price |
| 23 | Developing VAH (NEW) | DevelopingVAH |
price |
| 24 | Developing VAL (NEW) | DevelopingVAL |
price |
| 25 | Developing VWAP (NEW) | DevelopingVWAP |
price |
| 26 | Initial Balance High (NEW) | InitialBalanceHigh |
price |
| 27 | Initial Balance Low (NEW) | InitialBalanceLow |
price |
- Mean reversion — Go long below Previous VAL, target Previous POC. Short above Previous VAH, target Previous POC.
- Breakout — Enter when price breaks above Previous VAH with volume confirmation.
- LVN acceleration — When Current LVN Distance (ticks) approaches zero, position for the fast move through.
- VWAP fade — Fade extreme deviations from Current VWAP, targeting snap-back.
- Value area rotation — If price opens above Previous VAH and re-enters the value area, target Previous VAL.
-
IB Break setup (NEW) — Long on close above
InitialBalanceHigh, targetInitialBalanceHigh + (IB range); mirror for shorts. -
Developing-POC trend filter (NEW) — Take long signals only when
DevelopingPOChas ticked higher over the last N bars; short signals only when it has ticked lower. - Market Analyzer — Add POC, VAH, VAL, VWAP, IB High/Low columns to your watchlist for multi-instrument level monitoring.
Update Historical Plots is Off by default. Plot values are only populated in real-time. Enable it if you need historical plot values for backtesting — but expect longer chart load times.15. Day-Type Classification — Auction Theory at a Glance
Every completed session is auto-classified into one of the seven Market Profile day types and rendered as a colored pill in the stats card header. The classifier combines day range vs. IB ratio, POC drift over the developing trace, both-side IB break, and a peak/trough scan of the volume distribution to detect Double Distribution.
The Seven Day Types
| Day Type | Detection Rule | What It Means |
|---|---|---|
| Trend Day | Range ≥ 1.8× IB and |POC drift| ≥ 45% of range | Strong one-directional auction. Ride the trend; don't fade. |
| Double Dist | Two volume peaks separated by a clear trough (peak ≥ 65% of POC, trough ≤ 45% of POC, ≥ 3 levels apart) and range ≥ 1.5× IB | Two distinct distributions in one session. Trade between them, not through them. |
| Neutral Ext | Both IB sides broken and |POC drift| ≥ 50% | Tested both extremes, closed at one end. Bias toward the close direction next day. |
| Neutral | Both IB sides broken (no strong drift) | Rotation between extremes. Fade both sides. |
| Norm Var | Range 1.25–1.8× IB | Healthy extension after IB. Trend with reasonable pullback opportunities. |
| Non-Trend | Range < 0.85× IB | Tight, IB-bound session. Wait for the next day's open to commit. |
| Normal | Default — balanced session, ~1× IB | Mixed signals. Trade level-to-level, no directional bias. |
16. Statistics Card — Every Metric in One Glance
A premium glassmorphism stats card anchored above each profile's high. Shows total volume, signed delta with %, range in ticks, value-area width, IB range, and the above/below-POC balance ratio. The Day-Type pill sits in the header next to the session label so you can read everything at a glance.

Card Content
-
Header — Day-Type pill (colored dot + text) followed by the session label (e.g.
● Norm Var Thu Apr 30). - Metrics block — Volume, signed Delta with %, Range in ticks, Value Area Width in ticks, Initial Balance range in ticks, Above-/Below-POC balance ratio.
- Levels block — POC, VAH, VAL, and (when present) VWAP, formatted to instrument precision.
Worked example
● Norm Var   Thu Apr 30
Volume       1.2M
Delta        −43.66k (−3.7%)
Range        240t
VA Width     104t
IB           168t
Balance      1.15
POC          7272.75
VAH          7285.75
VAL          7259.75
VWAP         7273.50
The card lives on the parent composite (not the sub-profile), so it survives auto-splits and refreshes. Width auto-fits the widest content row, so labels never overflow.
Settings
| Setting | Default | Description |
|---|---|---|
| Show Stats Card | On | Master toggle for the floating per-profile stats card |
| Show on Previous Profiles | Off | Off = full card on the live profile only, compact dot+label tag on historical profiles. On = full metrics card on every profile. |
| Show Day Type | On | Toggle the colored Day-Type pill in the card header |
17. Migrating POC Line — Watch Fair Value Drift
A step-function line connecting each session's POC. Horizontal across the session, vertical riser at the boundary up or down to the next session's POC. Reveals where institutional fair value drifted day after day — at a glance you see whether the POCs are climbing (bullish migration), dropping (bearish migration), or chopping in a balance range.
◈ Why a Step Function (Not a Diagonal)
A center-to-center diagonal between session POCs is misleading — each session's POC is a single horizontal price level, not a slope. The step function shows the truth: a session has one POC, then it changes, then there's a new POC.
◈ The Three Migration Patterns
Climbing staircase = trend continuation, ride longs. Dropping staircase = trend continuation, ride shorts. Three flat POCs at the same level = institutional balance zone, fade extremes back to it.
| Setting | Default | Description |
|---|---|---|
| Show Migrating POC | On | Master toggle for the step-function POC line |
| Migrating POC Stroke | Amber-400 solid 1.5px @ 80% | Color, dash style, width, and opacity of the line |
18. Naked POC Tracking — Find the Untested Magnets
The indicator tracks every previous-session POC and remembers whether price has come back to test it. Untested ("naked") POCs are visually distinct from tested ones — and you can configure the previous-POC display to show all, naked-only, or hide.
How It Works
Every previous POC carries a IsBroken flag. The flag flips to true the first time price closes across the level. Once broken, the level is "tested" and treated as historical context. Until then, it's naked — and naked POCs are statistical magnets.
Three Display Modes
- All — Show every previous POC, naked or not. Useful for seeing the full level grid.
- Naked Only — Hide tested POCs, show only the untested ones. Cleanest view.
- Hide — Suppress all previous POCs. Use when only the live profile matters.
Trade it: Untested prior POCs are magnets. Markets revisit them with high probability, so they make excellent profit-target zones for trend trades and reversal-entry zones for mean reversion.
| Setting | Default | Description |
|---|---|---|
| Previous POC Display | All | All / Naked Only / Hide |
| Alert on Naked POC Test | Off | Audio alert when price crosses an untested previous POC |
19. Initial Balance + 1× / 2× / 3× Extensions
The Initial Balance is the first N minutes of the session (default 60). It's the auction's opening statement — and the point from which extensions are measured. The IB is auto-detected per trading day and tracked independently of the volume profile composites.

What Gets Drawn
- IB box — a transparent rectangle from session start to IB end at the IB high/low.
- Horizontal IB high / IB low lines extending forward.
- Up extensions at IB-high + 1×, 2×, 3× IB range.
- Down extensions at IB-low − 1×, 2×, 3× IB range.
Visited-Only Extensions
Each extension level has a per-day visited flag. Extensions are only drawn after price has actually traded within 1 ATR of them. Historical days don't litter the chart with untested 2× / 3× extensions — only the levels the market actually reached.
The live ("today") IB always shows all extensions regardless, so you can see where the market would extend before it gets there.
Settings
| Setting | Default | Description |
|---|---|---|
| Show Initial Balance | Off | Master toggle for IB box + horizontal lines |
| Initial Balance Minutes | 60 | IB window length in minutes from session start |
| Show IB Extensions | Off | Toggle the 1× / 2× / 3× extension projections |
| Initial Balance Stroke | DodgerBlue solid 1px @ 60% | Color/style of IB high/low lines |
| IB Extension Stroke | DodgerBlue dash 1px @ 40% | Color/style of 1×/2×/3× extension lines |
| Alert on IB Break | Off | Audio alert when price closes through IB high or IB low |
20. Single Prints & Poor High / Poor Low
The auction-theory signals for unfinished business. Single prints are price levels with only one TPO row — areas the market raced through. Poor highs and poor lows are extremes printed by multiple TPOs without rotation — failed rejection.

| Signal | Definition | Trading Implication |
|---|---|---|
| Single Print | One-TPO row inside the session range | Gap-fill target. Markets revisit single prints to redistribute volume. |
| Poor High | Multiple TPOs at the session high without rotation | Failed top — the high wasn't auctioned cleanly. High retest probability. |
| Poor Low | Multiple TPOs at the session low without rotation | Failed bottom. Will likely be retested. |
Settings
| Setting | Default | Description |
|---|---|---|
| Show Single Prints | Off | Mark single-print levels on the profile |
| Show Poor High / Poor Low | Off | Mark untested session extremes |
| Single Print Stroke | Magenta solid 2px @ 80% | Color and thickness of single-print markers |
| Poor High/Low Stroke | Magenta solid 3px @ 100% | Color and thickness of poor-high/low markers |
21. Audio Alerts on Profile Events
Configurable alerts on POC touch, VAH touch, VAL touch, HVN approach, LVN approach, naked POC test, and IB break. Each alert has its own toggle, with a global cooldown so you don't get spammed during chop. The approach-distance is configurable in ticks.

Available Alerts
| Alert | Trigger |
|---|---|
| POC Touch | Price crosses the live POC |
| VAH Touch | Price crosses VAH |
| VAL Touch | Price crosses VAL |
| HVN Approach | Price within N ticks of an HVN |
| LVN Approach | Price within N ticks of an LVN |
| Naked POC Test | Price crosses an untested previous-session POC |
| IB Break | Price closes through IB high or IB low |
Settings
| Setting | Default | Description |
|---|---|---|
| Approach Distance (ticks) | 4 | How close price must come to HVN/LVN to trigger |
| Cooldown (seconds) | 30 | Minimum interval between alerts of the same type |
| Alert Sound File | Alert1.wav | Path to the WAV file played on alert |
22. What's New & Changelog
Recent releases. We ship updates often — included free with your license.
- POC / VAH / VAL / VWAP trace lines across the developing profile — see exactly how each level migrated through the session.
- Naked POC tracking (untested previous-session POCs) with a configurable display mode: All / Naked-only / Hide.
- Initial Balance auto-detection plus 1× / 2× / 3× IB extension projections (only drawn when actually visited).
- Single Prints and Poor High / Poor Low detection with custom rendering markers.
- Audio alerts on POC touch, VAH/VAL touch, HVN/LVN approach, naked POC test, IB break — each independently toggleable, with cooldown.
- Migrating POC line redesigned as a step function (horizontal across each session, vertical riser at boundaries). Soft amber color, 1.5 px solid at 80 %, sits cleanly between cyan POC and violet bars.
- POC / VAH / VAL / VWAP exposed as NinjaScript plot series for use in strategies and Market Analyzer.
- Composite date-range profile — pick any historical window and aggregate all the volume.
- Rolling-N-day profile — always shows the last N sessions of volume.
- Floating per-profile statistics card with volume, delta, range, value-area width, IB range, and balance ratio.
- Day-Type classification with seven Market Profile categories (Trend, Normal, Norm Var, Neutral, Neutral Ext, Double Dist, Non-Trend).
- Modern DeepCharts-inspired palette as the new default: electric blue (
#3B82F6) buy, violet (#A855F7) sell, cyan accent (#22D3EE) POC, soft pink (#F472B6) VAH, mint (#34D399) VAL, indigo (#818CF8) VWAP. Replaces the legacy yellow/red/lime palette. - Premium glassmorphism floating stats card with day-type pill, session label, and full per-profile metrics. Anchored above the profile high so it never collides with price.
- Cleaner default look: hide Mid / High / Low / VWAP per-profile lines, dominant 3 px solid POC, 1 px dashed VAH/VAL at 85 %, ExtendCurrentLines = true so the live profile's levels reach the right edge of the chart.
- Auto-stagger for POC / VAH / VAL / VWAP / High / Low labels on tight profiles — labels are sorted, nudged apart by one row height, and a thin angled connector links each label back to its true line position.
- High and Low pivot lines now on by default — at-a-glance session range without opening settings.
- Outside-value-area bar opacity lowered from 25 % → 15 % so the saturated value area visually dominates.
- Session-divider hairline switched to slate-500 dotted at 30 % — a subtle vertical rhythm without competing with content.
- Sigma volume label is suppressed for partial sessions narrower than 60 px (no more awkward σ rows under tiny weekend / holiday profiles).
- Toolbar gained a "Profile mode" parent menu with dynamic per-mode settings — change interval minutes, rolling-N count, or composite date range without leaving the chart.
- Sub-menus throughout the toolbar got descriptive captions and inline color pickers.
- Day-Type classifier rewritten to use IB-ratio + POC drift + peak/trough scan. Previously almost every session was tagged "Double Distribution" because the classifier checked an unreliable shape flag.
- Day-Type labels switched to Title Case (
Trend Day,Norm Var,Double Dist, …) instead of shouting all-caps. - Buy/sell volume bias — sessions previously almost always showed more buy than sell volume due to an off-by-one in the up/down tick classifier. Now correctly attributes ticks to the side that traded into them.
- BarCount=1 in Every-X-Bars mode no longer breaks the profile builder.
- Previous-profile lines now extend correctly when ExtendUntil = Forever (the previous code fell back to a per-profile-slot width and silently never extended).
- Leftmost / partial composite no longer fails to render due to a startBar boundary issue.
23. Complete Settings Reference
Every configurable setting, organized by category. The indicator intelligently shows/hides settings based on your selected profile type — you'll only see the fields relevant to your current configuration. Use the Easy Access Toolbar for quick changes, or the full NinjaTrader properties dialog for detailed configuration.
Categories: Parameters, Current Profile, Previous Profiles, HVN/LVN, TPO, Auto-Splitting, Paint Bars, Initial Balance, Auction Tools, Stats Card & Day Type, Alerts, Composite / Rolling-N, Colors.
Parameters
| Setting | Default | Description |
|---|---|---|
| Profile | Daily Session | Profile type: All Bars, Every X Bars, Custom Session, Daily, Weekly, Monthly, Visible Range, Fixed Interval, Composite Date Range, Rolling N Days |
| Bar Count | 10 | Bars per profile (Every X Bars mode) |
| Custom Session #1 Start / End | 09:30 / 16:00 | First custom time window (HH:mm) |
| Custom Session #2-5 Start / End | Empty | Additional custom time windows (up to 5 total) |
| Interval Start / End Time | 00:00 / 23:59 | Time bounds for Fixed Interval mode |
| Interval Duration (min) | 120 | Duration of each fixed interval block |
| Date Range Start / End | −30d / today | NEW — date window for Composite Date Range mode |
| Rolling Days Count | 5 | NEW — number of trailing sessions for Rolling N Days mode |
| Color Mode | Buy/Sell | Mono, Heatmap, Buy/Sell, Delta, Delta & Volume |
| Resolution | Second | Data granularity: Minute, Second, Tick |
| Resolution Interval | 1 | Interval for the resolution setting |
| Ticks Per Level | 4 | Tick aggregation per volume bar |
| Profile Width (%) | 40 | Profile width as % of session width |
| Vertical Spacing | 2 | Pixel gap between bars |
| Value Area (%) | 70 | Volume % defining the value area |
| Enable Smoothing | Off | Toggle profile smoothing |
| Smoothing Period | 8 | Smoothing intensity (higher = smoother) |
| Show Outline | Off | Draw outline around profile shape |
| Vertical VAL Line Width | 10 | Width of value area boundary markers |
| Show Session Divider | On | Vertical hairline between sessions |
| Profiles to Show | 0 (all) | Limit rendered profiles (0 = all) |
| Show Session Total Volume | On | Sigma + range text below profile (auto-suppressed when session < 60 px wide) |
| Show VWAP Line | On (changed) | Toggle VWAP level — was Off pre-1.0.1.39 |
| Show MID Line | Off | Toggle session midpoint |
| Show HIGH Line | On (changed) | Toggle session high — was Off pre-1.0.1.39 |
| Show LOW Line | On (changed) | Toggle session low — was Off pre-1.0.1.39 |
| Update Historical Plots | Off | Populate plot values for historical bars |
Current Profile
| Setting | Default | Description |
|---|---|---|
| Orientation | Left | Profile growth direction |
| Pivots | Line & Label | None, Line, Line & Label |
| Label Location | Right | Label side (Left or Right) |
| Label Content | Price & Label | Price, Label, or Price & Label |
| Extend Lines (Current) | On (changed) | Extend live profile's POC/VAH/VAL to chart edge |
| Show Developing POC | On | Trace the POC migration through the live session |
| Show Developing Value Area | Off | Trace VAH/VAL migration |
| Show Developing VWAP | Off | Trace VWAP migration |
| Volume Text | None | None, Total Volume, Delta, Volume & Delta |
Previous Profiles
| Setting | Default | Description |
|---|---|---|
| Orientation | Left | Profile growth direction |
| Pivots | Line & Label | None, Line, Line & Label |
| Label Orientation | Right | Label side |
| Label Content | Price & Label | Price, Label, or Price & Label |
| Extend Lines | On | Extend previous pivot lines forward |
| Extend Count | 1 | Prev sessions to extend (1 = yesterday only) |
| Extend Until | Until Tested | Forever, Until Broken, Until Tested |
| Previous POC Display | All | NEW — All / Naked Only / Hide |
| Show Migrating POC | On | NEW — step-function POC line connecting sessions |
| Volume Text | None | None, Total Volume, Delta, Volume & Delta |
Stats Card & Day Type NEW CATEGORY
| Setting | Default | Description |
|---|---|---|
| Show Stats Card | On | Master toggle for the floating per-profile stats card |
| Show on Previous Profiles | Off | Off = full card on live profile only, compact dot+label tag on historical. On = full card everywhere. |
| Show Day Type | On | Toggle the colored Day-Type pill in the card header |
Initial Balance NEW CATEGORY
| Setting | Default | Description |
|---|---|---|
| Show Initial Balance | Off | Master toggle for IB box + horizontal lines |
| Initial Balance Minutes | 60 | IB window length in minutes from session start |
| Show IB Extensions | Off | Toggle the 1× / 2× / 3× extension projections (visited-only on history) |
Auction Tools — Single Prints & Poor Highs/Lows NEW CATEGORY
| Setting | Default | Description |
|---|---|---|
| Show Single Prints | Off | Mark one-TPO rows on the profile |
| Show Poor High / Poor Low | Off | Mark untested session extremes (multi-TPO highs/lows without rotation) |
Audio Alerts NEW CATEGORY
| Setting | Default | Description |
|---|---|---|
| Alert on POC Touch | Off | Fire when price crosses the live POC |
| Alert on VAH Touch | Off | Fire when price crosses VAH |
| Alert on VAL Touch | Off | Fire when price crosses VAL |
| Alert on HVN Approach | Off | Fire within N ticks of an HVN |
| Alert on LVN Approach | Off | Fire within N ticks of an LVN |
| Alert on Naked POC Test | Off | Fire when price crosses an untested previous POC |
| Alert on IB Break | Off | Fire when price closes through IB high or IB low |
| Alert Approach (ticks) | 4 | Distance trigger for HVN/LVN approach alerts |
| Alert Cooldown (seconds) | 30 | Minimum interval between same-key alerts |
| Alert Sound File | Alert1.wav | Path to the WAV file played on alert |
High/Low Volume Nodes
| Setting | Default | Description |
|---|---|---|
| Show Low Volume Nodes | On | Enable LVN detection |
| Number of LVNs | 4 | Local minima to highlight |
| Region Size (LVN) | 1 | Detection neighborhood size |
| Extend (LVN) | None | None / Session / Forward |
| Extend Count (LVN) | 1 | Sessions to extend |
| Show High Volume Nodes | Off | Enable HVN detection |
| Number of HVNs | 4 | Local maxima to highlight |
| Region Size (HVN) | 1 | Detection neighborhood size |
| Extend (HVN) | None | None / Session / Forward |
| Extend Count (HVN) | 1 | Sessions to extend |
Market Profile (TPO)
| Setting | Default | Description |
|---|---|---|
| Show TPO Outline | Off | Enable TPO overlay |
| Inside VA Stroke | DodgerBlue, Dash, 2px | TPO bars inside value area |
| Outside VA Stroke | Red, Dash, 2px | TPO bars outside value area |
Splitting
| Setting | Default | Description |
|---|---|---|
| Enable Auto-Split | Off | Auto-detect composite profiles |
| Shape Threshold (%) | 60 | Volume % for P/D classification |
| Min Split Time (%) | 15 | Min session time before splitting |
| Min Split Volume (%) | 10 | Min volume in split region |
Paint Bars
| Setting | Default | Description |
|---|---|---|
| Enable Paint Bars | On | Override candle colors |
| Paint Bars Z-Order | Back | Hide / Front / Back |
| Up Bar Color | LimeGreen | Bullish candle fill |
| Down Bar Color | Red | Bearish candle fill |
| Up Bar Outline | White | Bullish candle border |
| Down Bar Outline | White | Bearish candle border |
Colors Updated for v1.0.1.29
| Color Setting | Default (v1.0.1.29) |
|---|---|
| Inside VA Volume Up | Electric Blue #3B82F6, 95% |
| Inside VA Volume Down | Violet #A855F7, 95% |
| Inside VA Neutral | Slate, 80% |
| Outside VA Volume Up | Electric Blue #3B82F6, 15% |
| Outside VA Volume Down | Violet #A855F7, 15% |
| Outside VA Neutral | Slate, 18% |
| Heatmap High | Violet #A855F7
|
| Heatmap Low | Electric Blue #3B82F6
|
| Outline | Muted Slate, Solid, 1px @ 60% |
| Session Divider | Slate-500 #64748B, Dot, 1px @ 30% |
| POC | Cyan #22D3EE, Solid, 3px @ 100% |
| Value Area High | Soft Pink #F472B6, Dash, 1px @ 85% |
| Value Area Low | Mint #34D399, Dash, 1px @ 85% |
| VWAP | Indigo #818CF8, Solid, 1px @ 80% |
| Migrating POC | Amber-400 #FBBF24, Solid, 1.5px @ 80% |
| HVN Marker | Cyan #22D3EE, Solid, 2px @ 95% |
| HVN Extended | Cyan, 20% |
| LVN Marker | Muted Slate, Solid, 2px |
| LVN Extended | Muted Slate, 20% |
| Initial Balance | DodgerBlue, Solid, 1px @ 60% |
| IB Extension | DodgerBlue, Dash, 1px @ 40% |
| Single Print Marker | Magenta, Solid, 2px @ 80% |
| Poor High/Low Marker | Magenta, Solid, 3px @ 100% |
| Text Color | White |
| Font Size | 10 |
24. Free Trial & Pricing
Try It Free for 7 Days
Full access to every feature. No credit card. No commitment.
Download it, put it on your charts, and see where the real volume sits.
Everything Included
- 8 profile types (Daily, Weekly, Monthly, Custom, Fixed Interval, Visible Range, Every X Bars, All Bars)
- 5 color modes (Mono, Heatmap, Buy/Sell, Delta, Delta & Volume)
- HVN/LVN detection with smart extension
- TPO overlay with separate POC & Value Area
- Auto profile splitting with shape detection
- 28 NinjaScript plots for strategies & Market Analyzer
- Interactive chart toolbar
- Smart previous session line extension
- Up to 5 custom session windows
- All future updates included
Join Our Community
Get help, share setups, and connect with other volume profile traders in our Discord. Ask questions, request features, and stay updated on releases.
Join us on Discord — $1/year for community access, Q&A, and product support.