
Master Trend Precision With Dynamic Tracking That Filters Market Noise For Confidence.
Your Trend Signals Aren't Wrong. They're Just Late.
Most traders fail because they rely on fixed-length moving averages that physically cannot adapt to changing market speeds.
You wait for the moving average to cross. You enter the trade. Then the market immediately pulls back because you bought the exact top. The indicator lagged, feeding you obsolete data when momentum had already shifted.
The McGinley River is built specifically to eradicate this lag. It utilizes a dynamic mathematical formula that automatically speeds up during high volatility and slows down in choppy markets. It isn't a static lookback; it's a living, breathing algorithm that tracks the institutional footprint directly on the price action.
Stop getting chopped out by delayed indicators. With the McGinley River, you see the true trend shift exactly when the volume hits, giving you the pure mathematical edge required to execute without hesitation.
You're Trading Illusions.
We Map The Speed Of Money.
Retail traders rely on lagging MAs. Institutional algorithms adapt to live volatility. Stop following ghost data.
Fixed-Length Fatalities
You use static EMAs and SMAs that drag behind the actual price. By the time your line signals a shift, the smart money has already taken profit, leaving you holding the bag.
The Whipsaw Trap
In choppy, sideways markets, your traditional MAs cross back and forth relentlessly. You take trade after trade, getting ground to dust by fakeouts and noise.
Volatility-Adjusted Geometry
The McGinley River auto-adjusts to market speed, tracking price tightly during explosive moves and widening during chop to filter out noise. You get pure trend fidelity.
React Faster. Filter Out Noise.

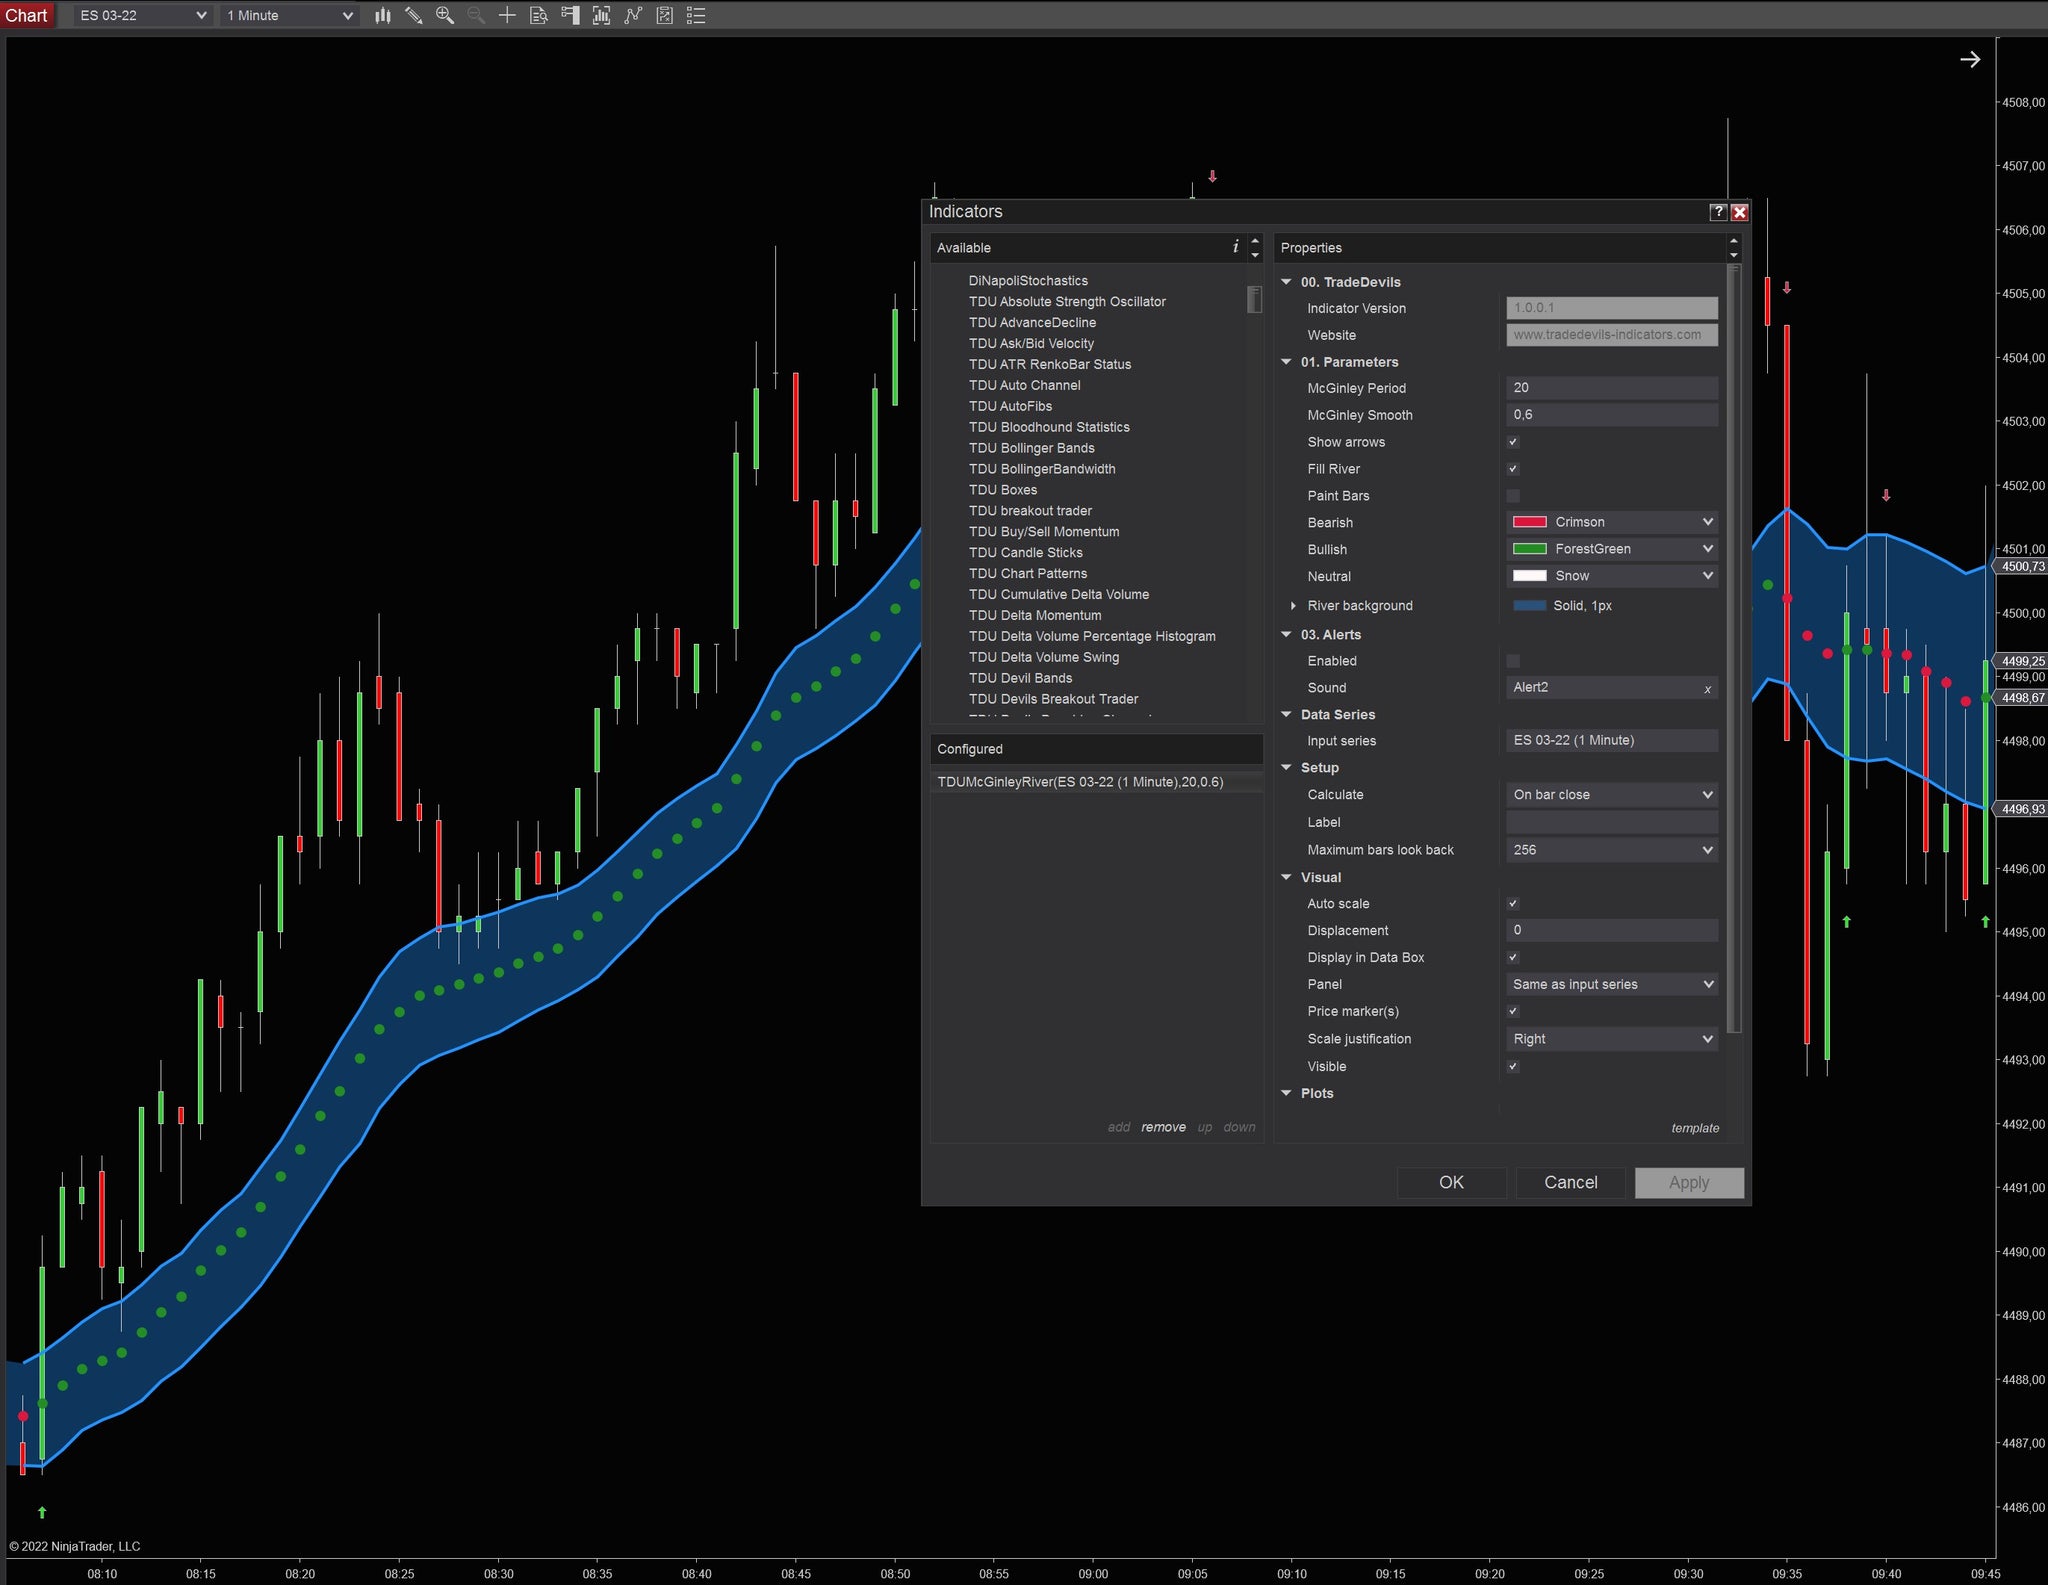
Raw Output: Dynamic Volatility Bands Filtering Market Noise Live.
The Architecture Of The Indicator
Everything you need to automate your trend analysis, packed into one dynamic algorithmic tool.
Eradicate Signal Lag
The algorithmic formula dynamically adjusts to market velocity, so that you catch trend shifts instantly instead of waiting for a slow moving average to catch up.
Filter Institutional Noise
The proprietary "River" bands widen during sideways chop to block false signals, so that you stop getting whipsawed and only deploy capital when a true trend is verified.
Anticipate Reversals Early
The integrated Squeeze Marker detects when price momentum is critically exhausted, so that you can lock in profits or prepare for a hard reversal before the crowd reacts.
Automate The Edge
Built for quants. Export real-time +1/-1 trend direction plots directly into Bloodhound or custom strategies, allowing you to remove emotion completely and let your systems run 24/7.

Adapt To Market Speed.
Stop relying on rigid EMAs. The McGinley River calculates real-time market velocity to tighten up during breakouts and relax during consolidation, ensuring your trendline is always positioned for maximum accuracy.
- Adjust smoothing factors to your specific style.
- Eliminate the inherent lag of traditional moving averages.
- Track price intimately during high-volatility bursts.
Ignore The Chop.
Choppy markets destroy retail accounts. The upper and lower "River" bands encapsulate standard price wiggles, giving you a definitive boundary. If price is in the river, you stay out. If it breaks the river, you execute.
- Filter out false momentum spikes and fakeouts.
- Identify true directional bias instantly.
- Protect your capital during low-volume sessions.

Execute With Total Clarity.
Configure the charts to feed your brain instantly. Paint your bars to match the McGinley trend direction, toggle aggressive trend-following arrows, and flood the "River" for high-contrast visibility. Customization guarantees you spot your entry criteria without hesitation.
- Color-code price action to current trend bias.
- Spot immediate directional shifts with unmissable arrows.
- Customize the UI to seamlessly fit your existing templates.
Never Miss A Shift.
Stop staring blindly at the screen. Configure precise audio alerts that trigger the millisecond the algorithm detects a verified trend reversal, freeing you to monitor multiple markets knowing the system will alert you when volatility strikes.
- Audio notifications for critical trend shifts.
- Use custom alert sounds for immediate recognition.
- Walk away from the monitors with absolute confidence.

The Nerd Vault
Core McGinley line buffered by two outer bands designed exclusively for noise filtration in sideways markets.
Integrated momentum exhaustion logic that visually flags when price is slowing down for a reversal or range.
Formula completely detaches from fixed-lookback constraints, adapting to live market velocity tick-by-tick.
Zero-latency notifications that trigger the instant the prevailing trend breaches logic thresholds.
Optional bar painting, trend-change arrows, and river-fill aesthetics for rapid visual processing.
Engineered to operate flawlessly on any market (Futures, Forex, Equities) across any timeframe.
For advanced quantitative traders, this indicator exports raw plot data directly into memory, ready to be digested by NinjaScript strategies or Bloodhound logic trees.
- Trend Plot (+1): Emits a signal indicating a verified, upward McGinley trend.
- Trend Plot (-1): Emits a signal indicating a verified, downward McGinley trend.
- Squeeze State: Emits boolean/numeric state changes when the momentum exhaustion Squeeze Marker is active.
- River Boundaries: Exposes upper and lower band values for programmatic range calculations.
- 14-jan-2023 (v1.0.0.2) - Added Squeeze Marker feature to detect when price is slowing down into a reversal or range.
- 05-nov-2022 (v1.0.0.0) - Initial core release of the McGinley River architecture.
Frequently Asked Questions
Everything you need to know about licensing, platform architecture, and trials.
General Info & Trials
Licensing & Billing
Platforms & Technical
Tools & Automation
Hardware & Specs
Ready to Automate Your Edges?
Stop guessing on trends. Start executing dynamically.