
Creating automated trading strategies with the footprint indicator

The orderflow footprint indicator exposes 2 ways different API's for programmers
The first API is the standard NInjaTrader way in which the programmer uses one or more of the plots exposed by the indicator to create his own strategy. This method is preferred for beginners, simple stragies and for those working with BloodHound or the Strategy builder
The second API is much more advanced and gives access to all internals of the footprint indicator. It allows the developer to create much more advanced orderflow strategies. Downside is that this is only available from NinjaScript and no from BloodHound or the Strategy Builder
Please note that we cannot give support on questions about programming , ninjascript, ninjascript builder, strategy builder/analyzer or bloodhound!
Using plots to build your own orderflow strategy / indicator
The FootPrint Plots indicator exports 50+ plots for all the common delta signals & metrics. These plots are standard NinjaTrader plots and can be used from :
You can use these plots from:
- your own indicator
- your own strategy
- Bloodhound*
- Ninja Script
- Strategy builder
By using these plots you can develop your own orderflow based automated strategies.
(*) You can use these plots with BloodHound. However, BloodHound does not support Tick Replay yet in NinjaTrader 8. This means that the signals/plots will only work with Bloodhound when you disable tick replay !!
Avilable plots:

Using NinjaTraders DataBox to examine plot values
You can use NinjaTraders built-in databox to example the values for each plot. Just open the databox window, then hover your mouse over a candle and the databox will show you the values for each Plot. This makes it very easy to determine what the value(s) are for a particular situation you trying to code in your own strategy
Example strategy using plots exported by the TDU Footprint Plots indicator
Here we have a very simple automated strategy which uses some of these plots.
The strategy is just a skeleton example on how to use the footprint indicator.
Ofcourse you will need to extend it with your own entry/exit logic rules, but it does show how you can use the footprint indicator
In this case it just uses the stacked buy and stacked sell imbalances plots to get the stacked imbalances for the current bar and then plots them on the chart with up/down arrows

How to create an orderflow strategy using the Strategy builder
Another option to create an automated strategy is by using the Strategy Builder which comes with NinjaTrader. The strategy builder allows you to create automated trading strategies without any coding. In the follow video we take a quick look at the strategy builder and demonstrate how you can create a simple strategy using the Strategy Builder and the footprint indicator
Creating advanced orderflow strategies using the IFootprintBar interface
Besides the 50+ plots mentioned above the indicator also provides a way to get access to all footprint bars with all the internals. This gives strategy developers much greater control and enables them to access much more details about each footprint bar
Below you can see the same strategy as above, but this time we use the IFootprintBar interface to get the footprint bar on line #57
The IFootprint bar exposes many more properties then the 50+ plots mentioned above

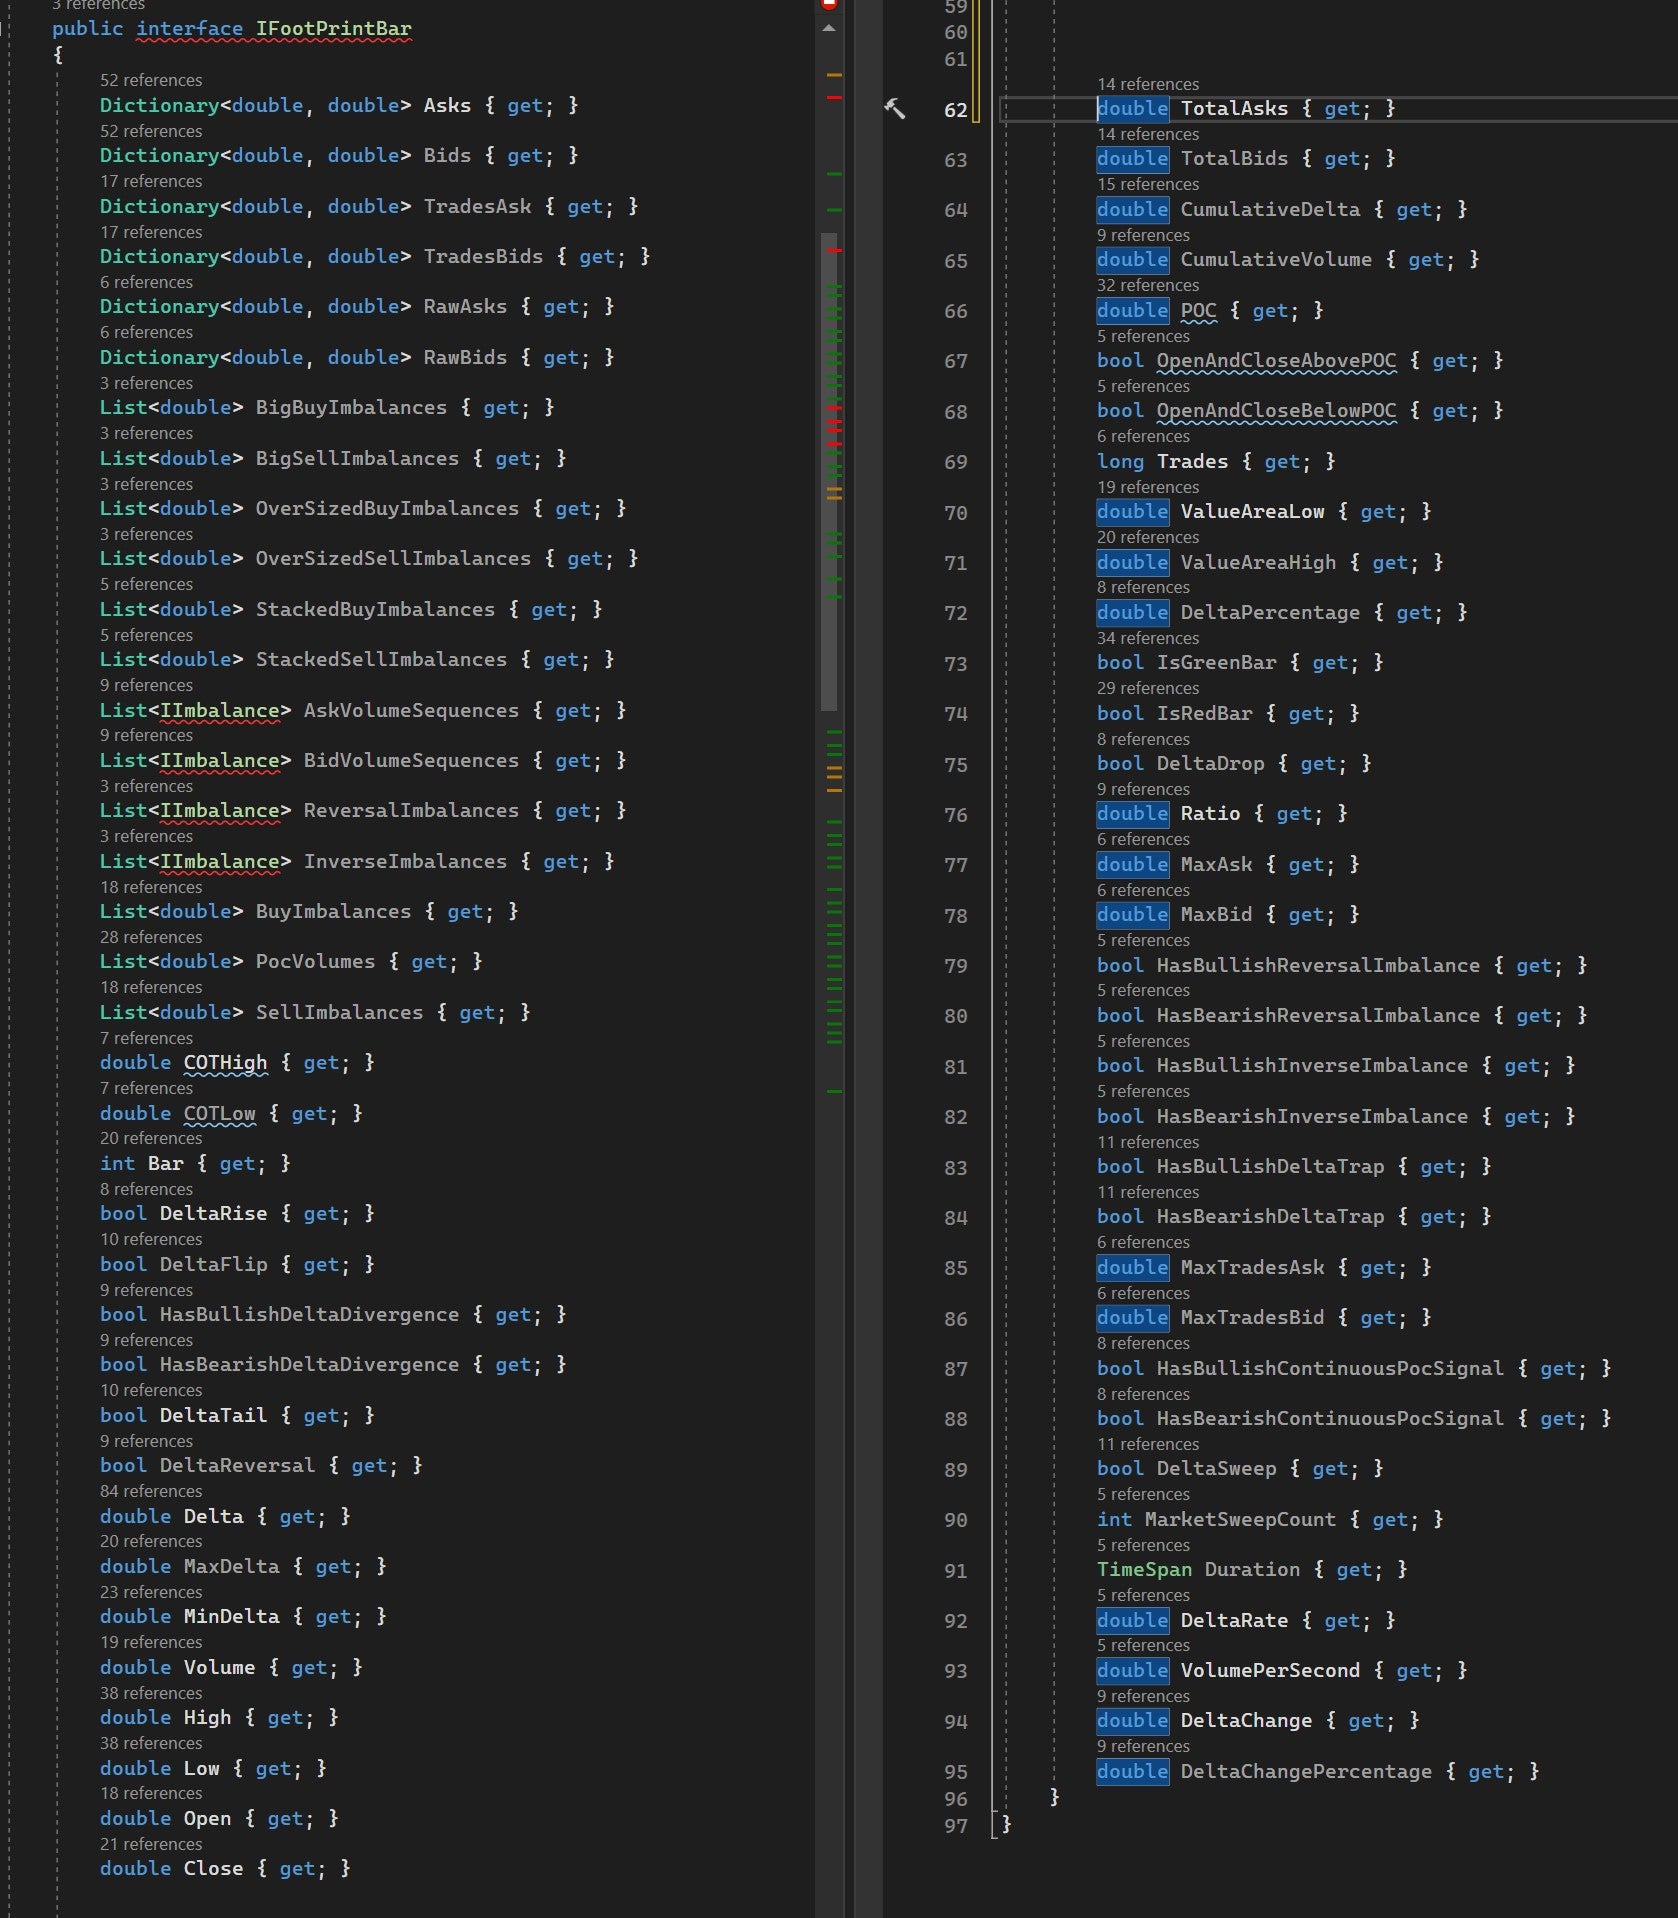
IFootPrintBar
The IFootPrintBar contains all data about a single footprint bar. You can get a handle to IFootPrintBar using the
GetFootPrintBar(barsAgo) method as shown above
Here you will see the definition of IFootPrintBar with all is properties
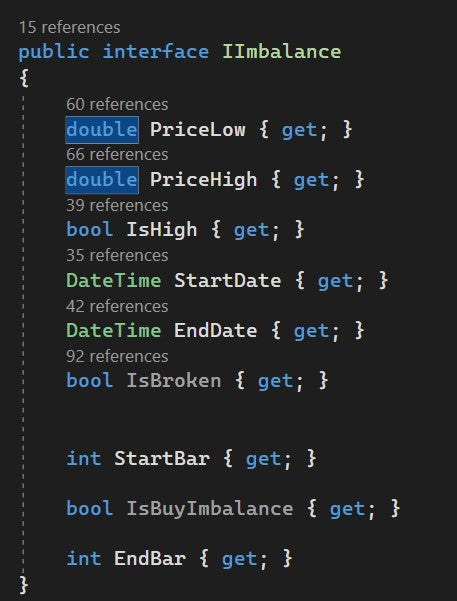
IImbalance
The IFootPrintBar contains several lists with imbalances (e.g. the AskVolumeSequences)
Below you can find the interface declaration for IImbalance
For traders, by traders
We are just like you. We like trading the markets every day.
And every day, the market teaches us something new. Besides this, we also get a lot of feedback from our customers. We take all this information and ideas to further continue to develop our indicators. And if you bought it before.. then ALL future updates will be free. How's that for a change ?
39 Updates
So far.. we added 39 new features since the first release in may 2021
5 star rating
We received a 5 star rating from our customers
350+ traders
Hundreds of traders are using our footprint indicator everyday
Join us on discord
Want to chat with us and other traders? Got questions on our indicators ? Or want to know more about our products? Then join us on discord for just $1 a year
